Mobile Navigation

  • National
    • Policy
      • High Expectations
      • Quality Choices
      • Personalized Pathways
    • Research
    • Commentary
      • Gadfly Newsletter
      • Flypaper Blog
    • Events
    • Scholars Program
  • Ohio
    • Policy
      • Priorities
      • Media & Testimony
    • Research
    • Commentary
      • Ohio Education Gadfly Biweekly
      • Ohio Gadfly Daily
  • Charter Authorizing
    • Application
    • Sponsored Schools
    • Resources
  • About
    • Mission
    • Board
    • Staff
    • Career
Home
Home
Advancing Educational Excellence

Main Navigation

  • National
  • Ohio
  • Charter Authorizing
  • About

National Menu

  • Topics
    • Accountability & Testing
    • Advanced Education
    • Career & Technical Education
    • Charter Schools
    • Curriculum & Instruction
    • ESSA
    • Evidence-Based Learning
    • Facilities
    • Governance
    • Personalized Learning
    • Private School Choice
    • School Finance
    • Standards
    • Teachers & School Leaders
    • Think Again
  • Research
  • Commentary
    • Gadfly Newsletter
    • Flypaper Blog
    • Gadfly Podcast
  • Events
  • Scholars Program

The Education Gadfly Weekly

Sign Up to Receive Fordham Updates

We'll send you quality research, commentary, analysis, and news on the education issues you care about.
Thank you for signing up!
Please check your email to confirm the subscription.

The Education Gadfly Weekly: The hollowing-out of the American high school experience

Volume 26, Number 36
9.10.2026
9.10.2026

The Education Gadfly Weekly: The hollowing-out of the American high school experience

Volume 26, Number 36
view
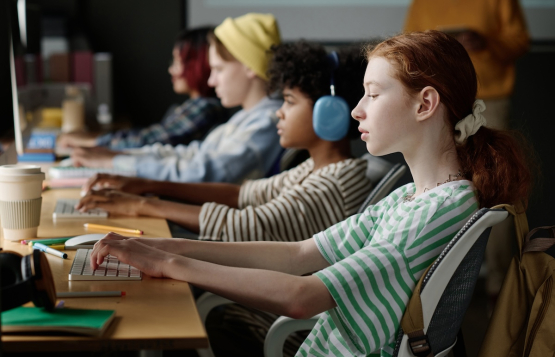
Students on computers
High Expectations

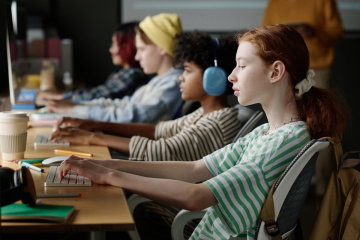
Screens, AI, and grade inflation are hollowing out the American high school experience

High school students report widespread screen distraction, AI misuse, and grading practices that make it easier to earn high marks without mastering the relevant material. A new Fordham survey suggests that we will only solve these problems by restoring the basic conditions for learning: attention, effort, honest work, and adults willing to hold adolescents to high expectations.

Amber M. Northern, Ph.D., Michael J. Petrilli 9.10.2026
NationalFlypaper

Screens, AI, and grade inflation are hollowing out the American high school experience

Amber M. Northern, Ph.D. | Michael J. Petrilli
9.10.2026
Flypaper

What Massachusetts’s portrait of a learner gets right (and New York’s doesn’t)

Meredith Coffey, Ph.D.
9.10.2026
Flypaper

Is this the post-homework era?

Alicia Anderson
9.10.2026
Flypaper

Examining education sector mixing within homeschool families

Jeff Murray
9.8.2026
Ohio Gadfly Daily

Fewer students, more dollars, and harder choices

Mike McShane
9.10.2026
Flypaper

Too much tech, too little learning? | Episode 1033 of The Education Gadfly Show

9.9.2026
Podcast
view
Graduate

What Massachusetts’s portrait of a learner gets right (and New York’s doesn’t)

Meredith Coffey, Ph.D. 9.10.2026
Flypaper
view
School backpack

Is this the post-homework era?

Alicia Anderson 9.10.2026
Flypaper
view
Sector mixing among US homeschoolers SR image

Examining education sector mixing within homeschool families

Jeff Murray 9.8.2026
Ohio Gadfly Daily
view
Empty school desk

Fewer students, more dollars, and harder choices

Mike McShane 9.10.2026
Flypaper
view

Too much tech, too little learning? | Episode 1033 of The Education Gadfly Show

Brian R. Fitzpatrick, Ph.D., Michael J. Petrilli, David Griffith, Ph.D., Amber M. Northern, Ph.D. 9.9.2026
Podcast
view
Students on computers

Screens, AI, and grade inflation are hollowing out the American high school experience

Amber M. Northern, Ph.D. | Michael J. Petrilli
9.10.2026
Flypaper

After years of mounting concern about students and screens, the techlash came to a head in June when the Los Angeles Unified School District made headlines for approving a new screen-time policy for students.

The policy is blunt by design. It limits students’ school-assigned screen time on district-issued devices (such as laptops and tablets),[1] counting both in-school use and homework. Students in pre-K through first grade cannot use school devices for instruction at all, while older elementary students are limited to 60 minutes per day. Middle and high schools have subject-specific limits; for example, high schoolers may spend no more than 90 minutes per subject per week on screens, up to a weekly maximum of 600 minutes or ten hours.

Opinions were predictably mixed on whether LAUSD got it right. Some welcomed the limits, while others thought tech deserved a more nuanced accounting of its virtues.

Yet whatever one thinks of America’s second-largest school district’s attempt to limit the downside of technology, one thing is clear: LAUSD tapped into the national zeitgeist. Weary of children transfixed by devices, isolated from peers and adults alike, district leaders responded to parental pressure and essentially said, “Enough is enough! There has to be a better way.”

Though we might quibble about the details, we at Fordham agree with the impulse. It sure seems, from the outside, that technology has transformed the school experience, especially during high school, and not necessarily for the better. But to find out for sure, we decided to ask the kids themselves. We wanted to know whether students see technology as useful to their learning—or whether they’re weary of tapping keys and scrolling screens. (Some recent polls pointed to the latter.)

We also wanted their sense of just how pervasive technology use is in schools and what misuse on their part might look like. More specifically, how have school-issued devices contributed to distraction and academic dishonesty? How do grading policies and artificial intelligence exacerbate those challenges? And most important, what can schools do now—long after the genie has escaped her proverbial bottle—to preserve the benefits of technology and AI while reducing their harms?

A new Fordham report, High Tech, Low Standards: High School in the Age of Distraction, answers these questions. It draws on a nationally representative survey of 1,011 current high school students and 1,013 recent graduates, fielded by Impact Research and UpONE Insights, with Fordham’s Brian Fitzpatrick leading the analysis and report writing.

The investigation yielded four big findings.

First, illicit tech use is rampant.

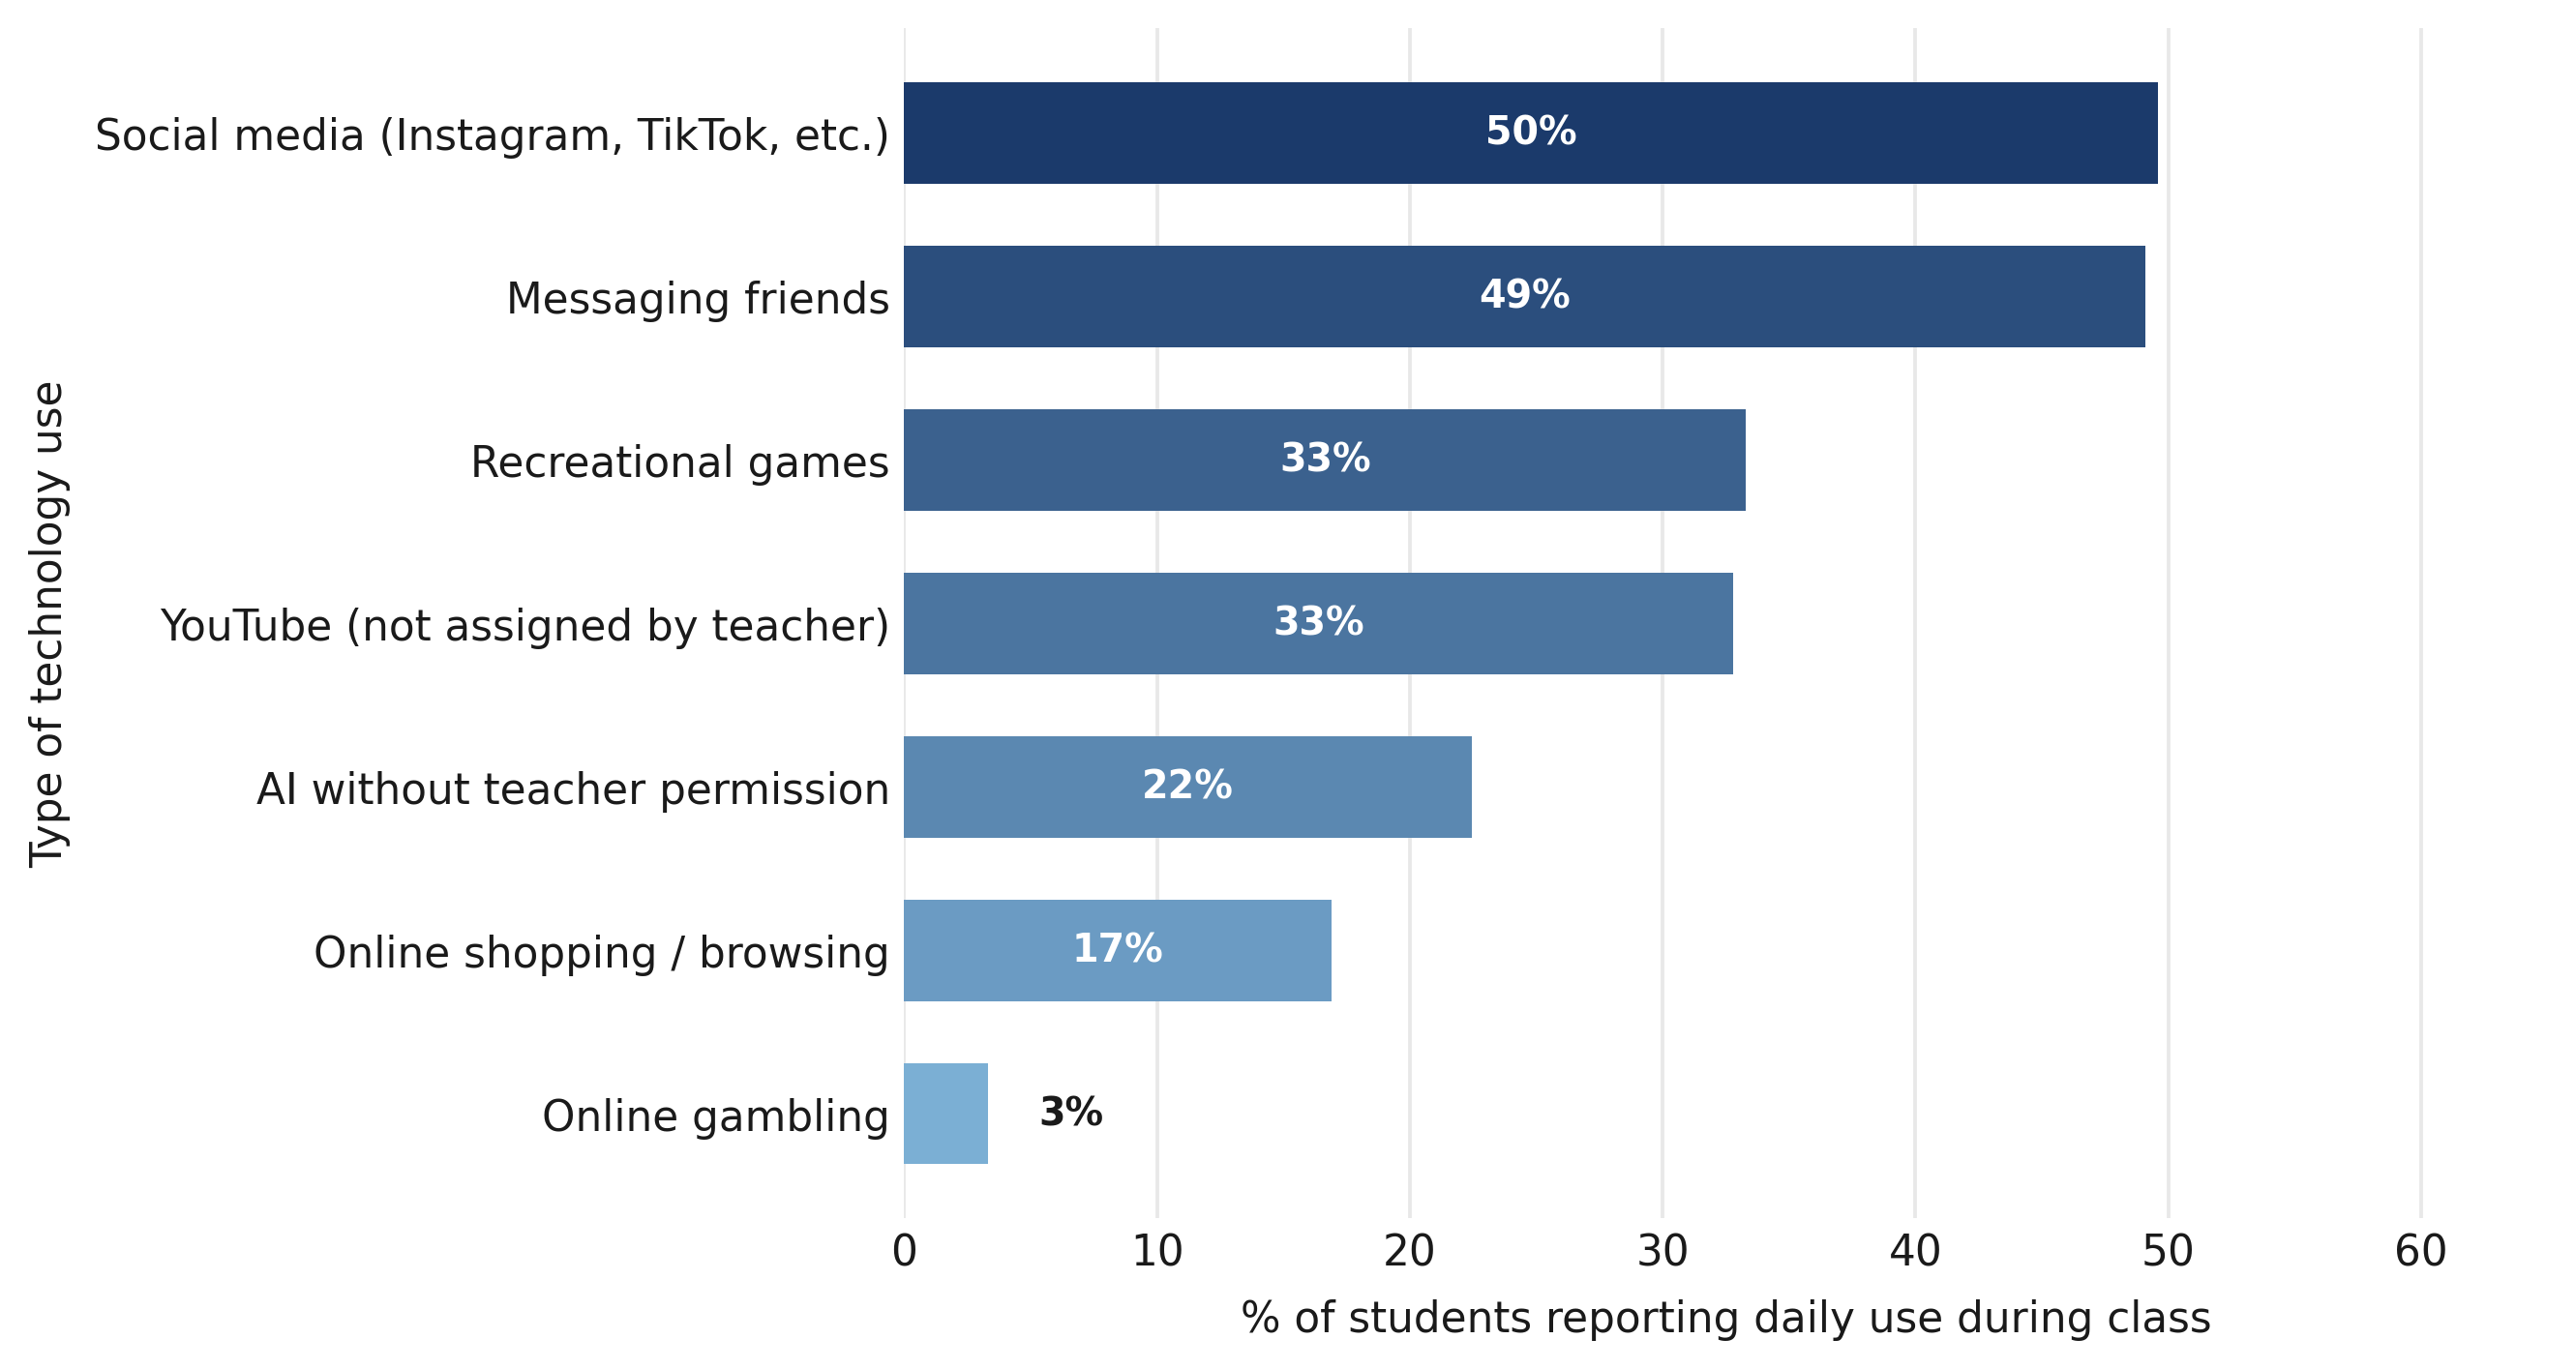
Seventy-six percent of respondents report personally engaging in at least one form of illicit technology use on a daily basis during high school, including scrolling social media, messaging friends, and shopping or gambling online (Figure 1). Roughly one-third report daily YouTube viewing or recreational gaming, while more than one in five say they use AI without permission.

Figure 1. Taken together, 76 percent of respondents report some kind of daily illicit tech use during high school.

1

Note: Each bar represents the percentage of respondents who report that they use each technology “multiple times a day” or “once a day” during school hours. Because respondents could select all that apply, the 76 percent figure reflects the share who reported at least one of these behaviors daily.

Second, AI is undermining the high school experience.

Many students are using AI not to support their learning but to bypass it altogether (Figure 2). While roughly half of respondents say they use AI to explain difficult concepts and brainstorm ideas, that same proportion say they use it to “solve math problems.” One-third (36 percent) use it to summarize books or other texts to avoid reading them, 29 percent to write the first draft of an essay or report, and 26 percent to help during quizzes or tests. Lest the point be missed: those uses sound an awful lot like cheating.

Figure 2. The most common uses of AI are legitimate, but many students also use it to cheat.

2

Note: Bars display percentages of respondents who report using AI for each task during high school.

Third, most U.S. high school students and recent graduates say they spend the majority of class time on school-provided devices.

Illicit use and sanctioned use are hard to tell apart. When so much of the school day runs through screens, it becomes difficult for teachers to know whether a student is completing an assignment or scrolling TikTok.

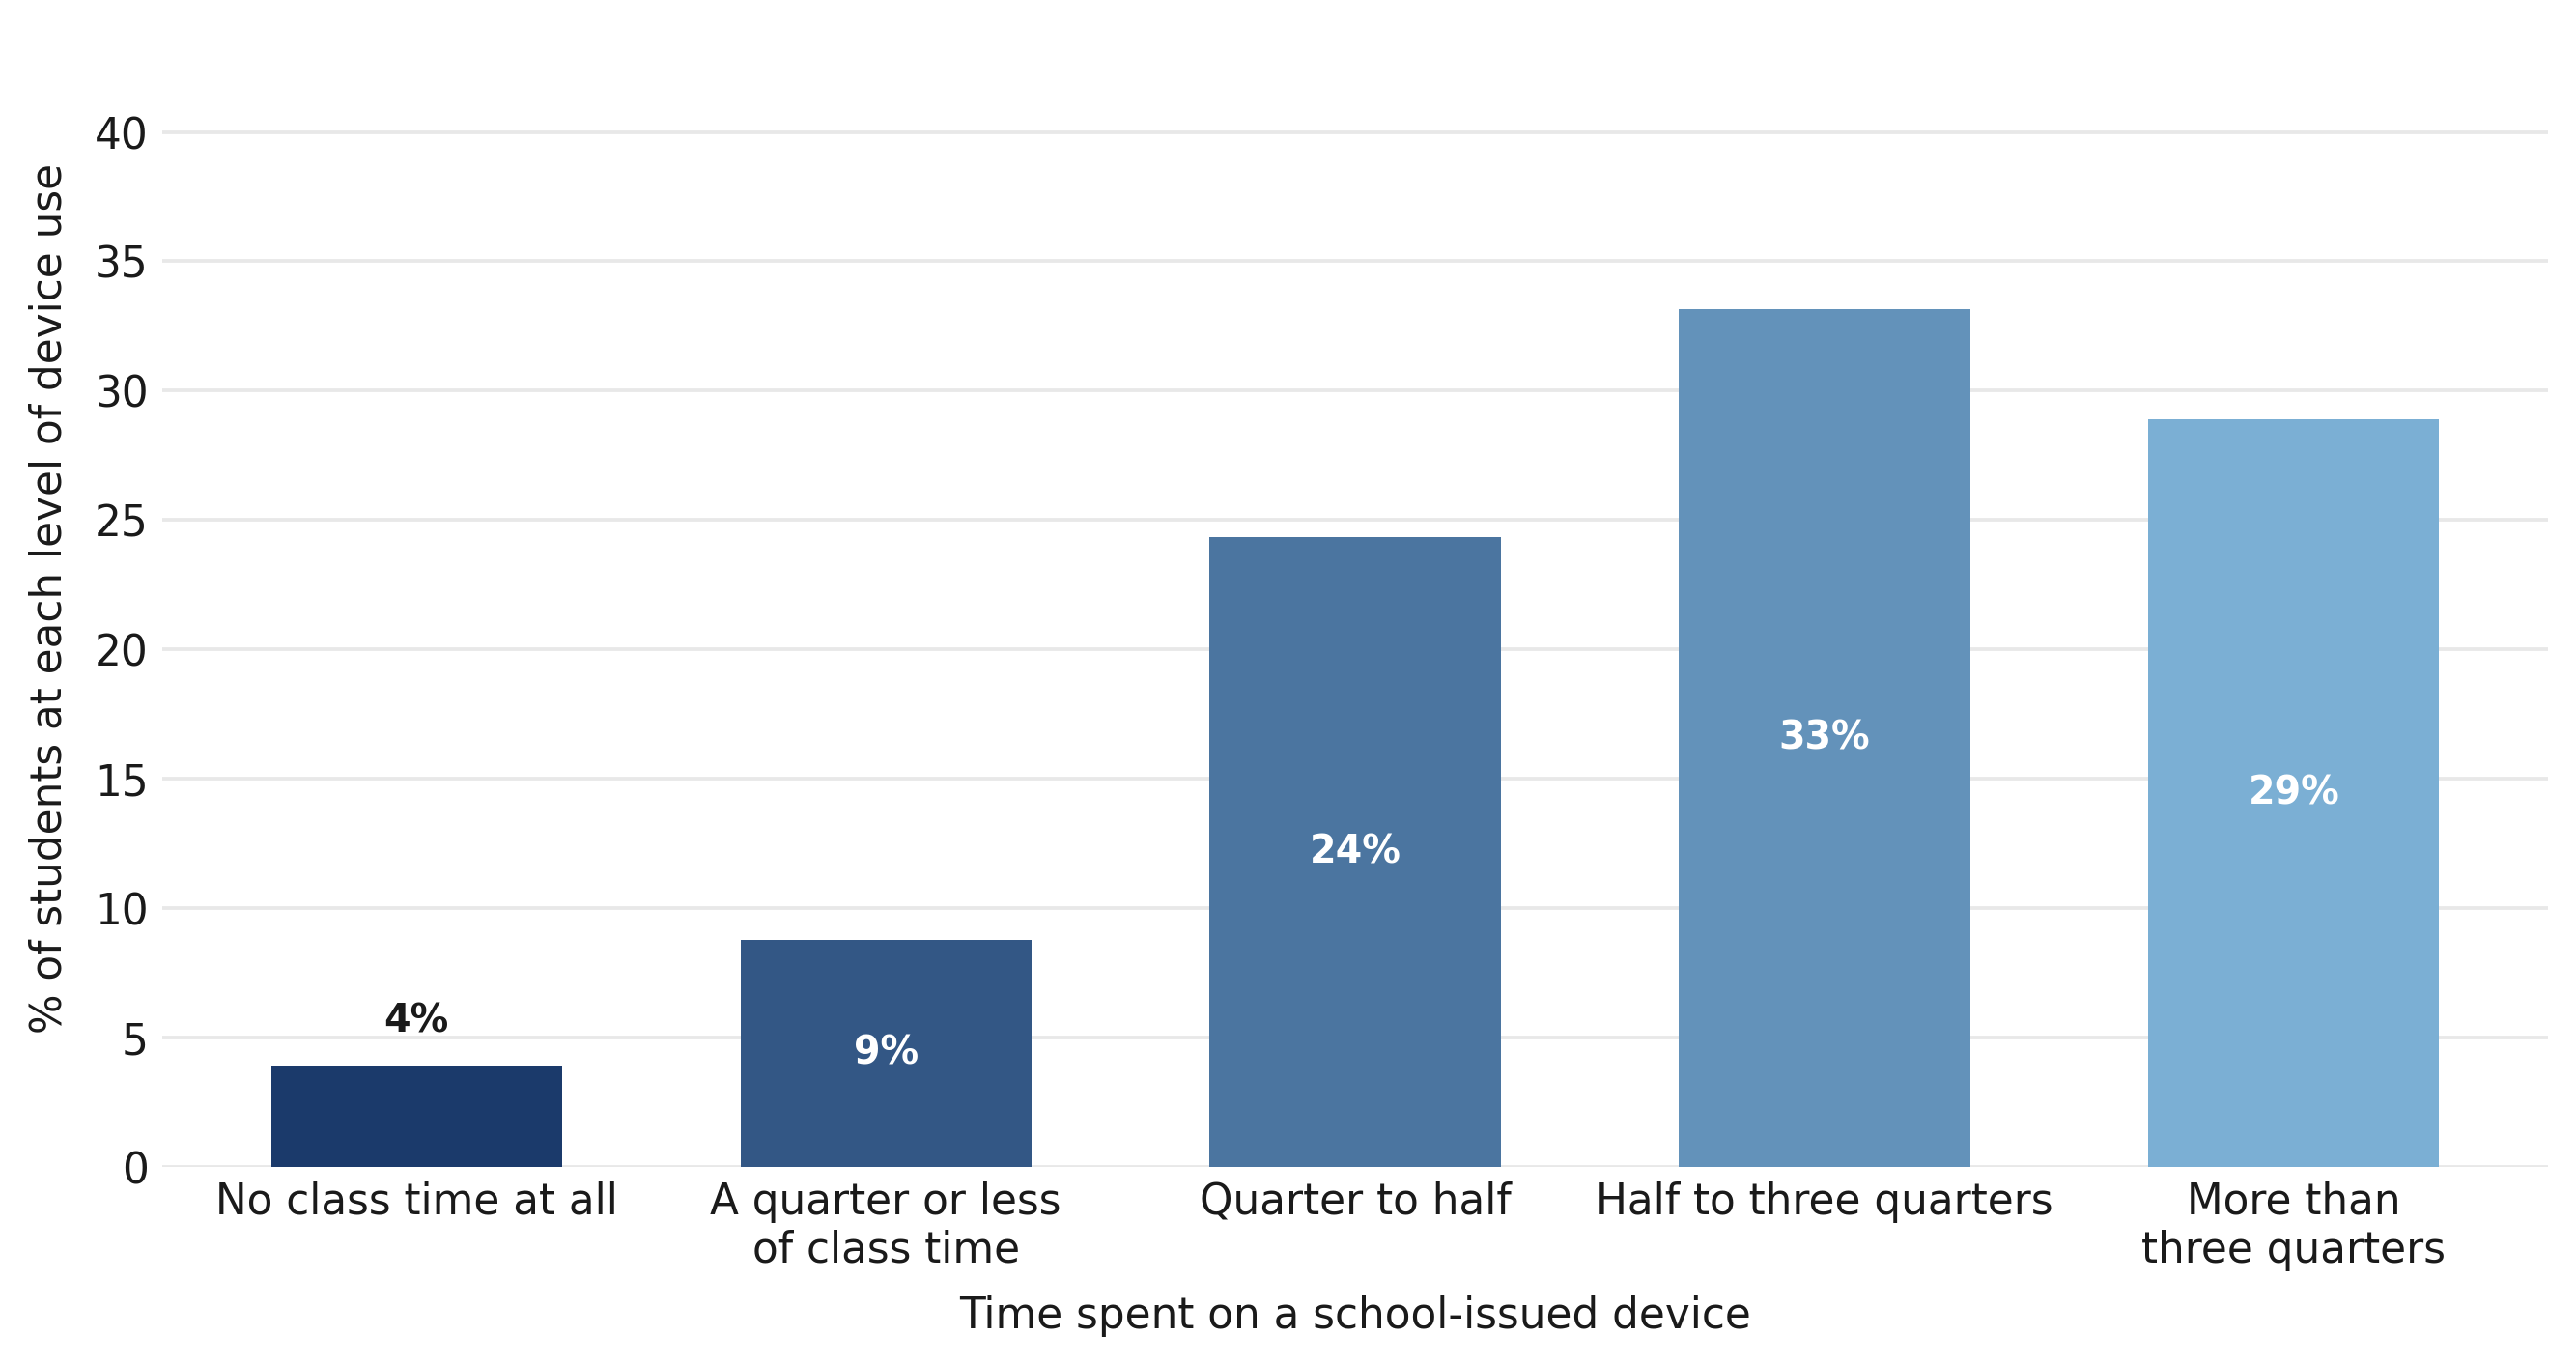
Figure 3 reveals that 62 percent of respondents spend more than half of their in-class time on school-issued devices. Let’s compare that to the new screen limits in Los Angeles. Under a typical six-hour school day, LAUSD’s cap would allow high school students to spend no more than about one-third of instructional time on screens. Based on our survey data, however, a student who spends at minimum half of class time on a school-issued device would log 900 minutes per week in this hypothetical schedule—50 percent more than LAUSD’s 600-minute weekly limit, and that doesn’t include doing homework on school devices.

Figure 3. Most respondents report spending between half and three-quarters of their school day on a school-issued device.

3

Note: Bars display the percentage of respondents at each level of self-reported device use in response to the question, “In a typical day, how much of your class time do/did you spend working on a device provided by your high school, such as a laptop or tablet?”

Finally, weak grading standards make distraction and AI misuse worse.

Many respondents report grading practices in their schools that lighten the consequences of not doing the work: partial credit for missing assignments, late-work policies that result in little penalty, and broad access to test retakes.

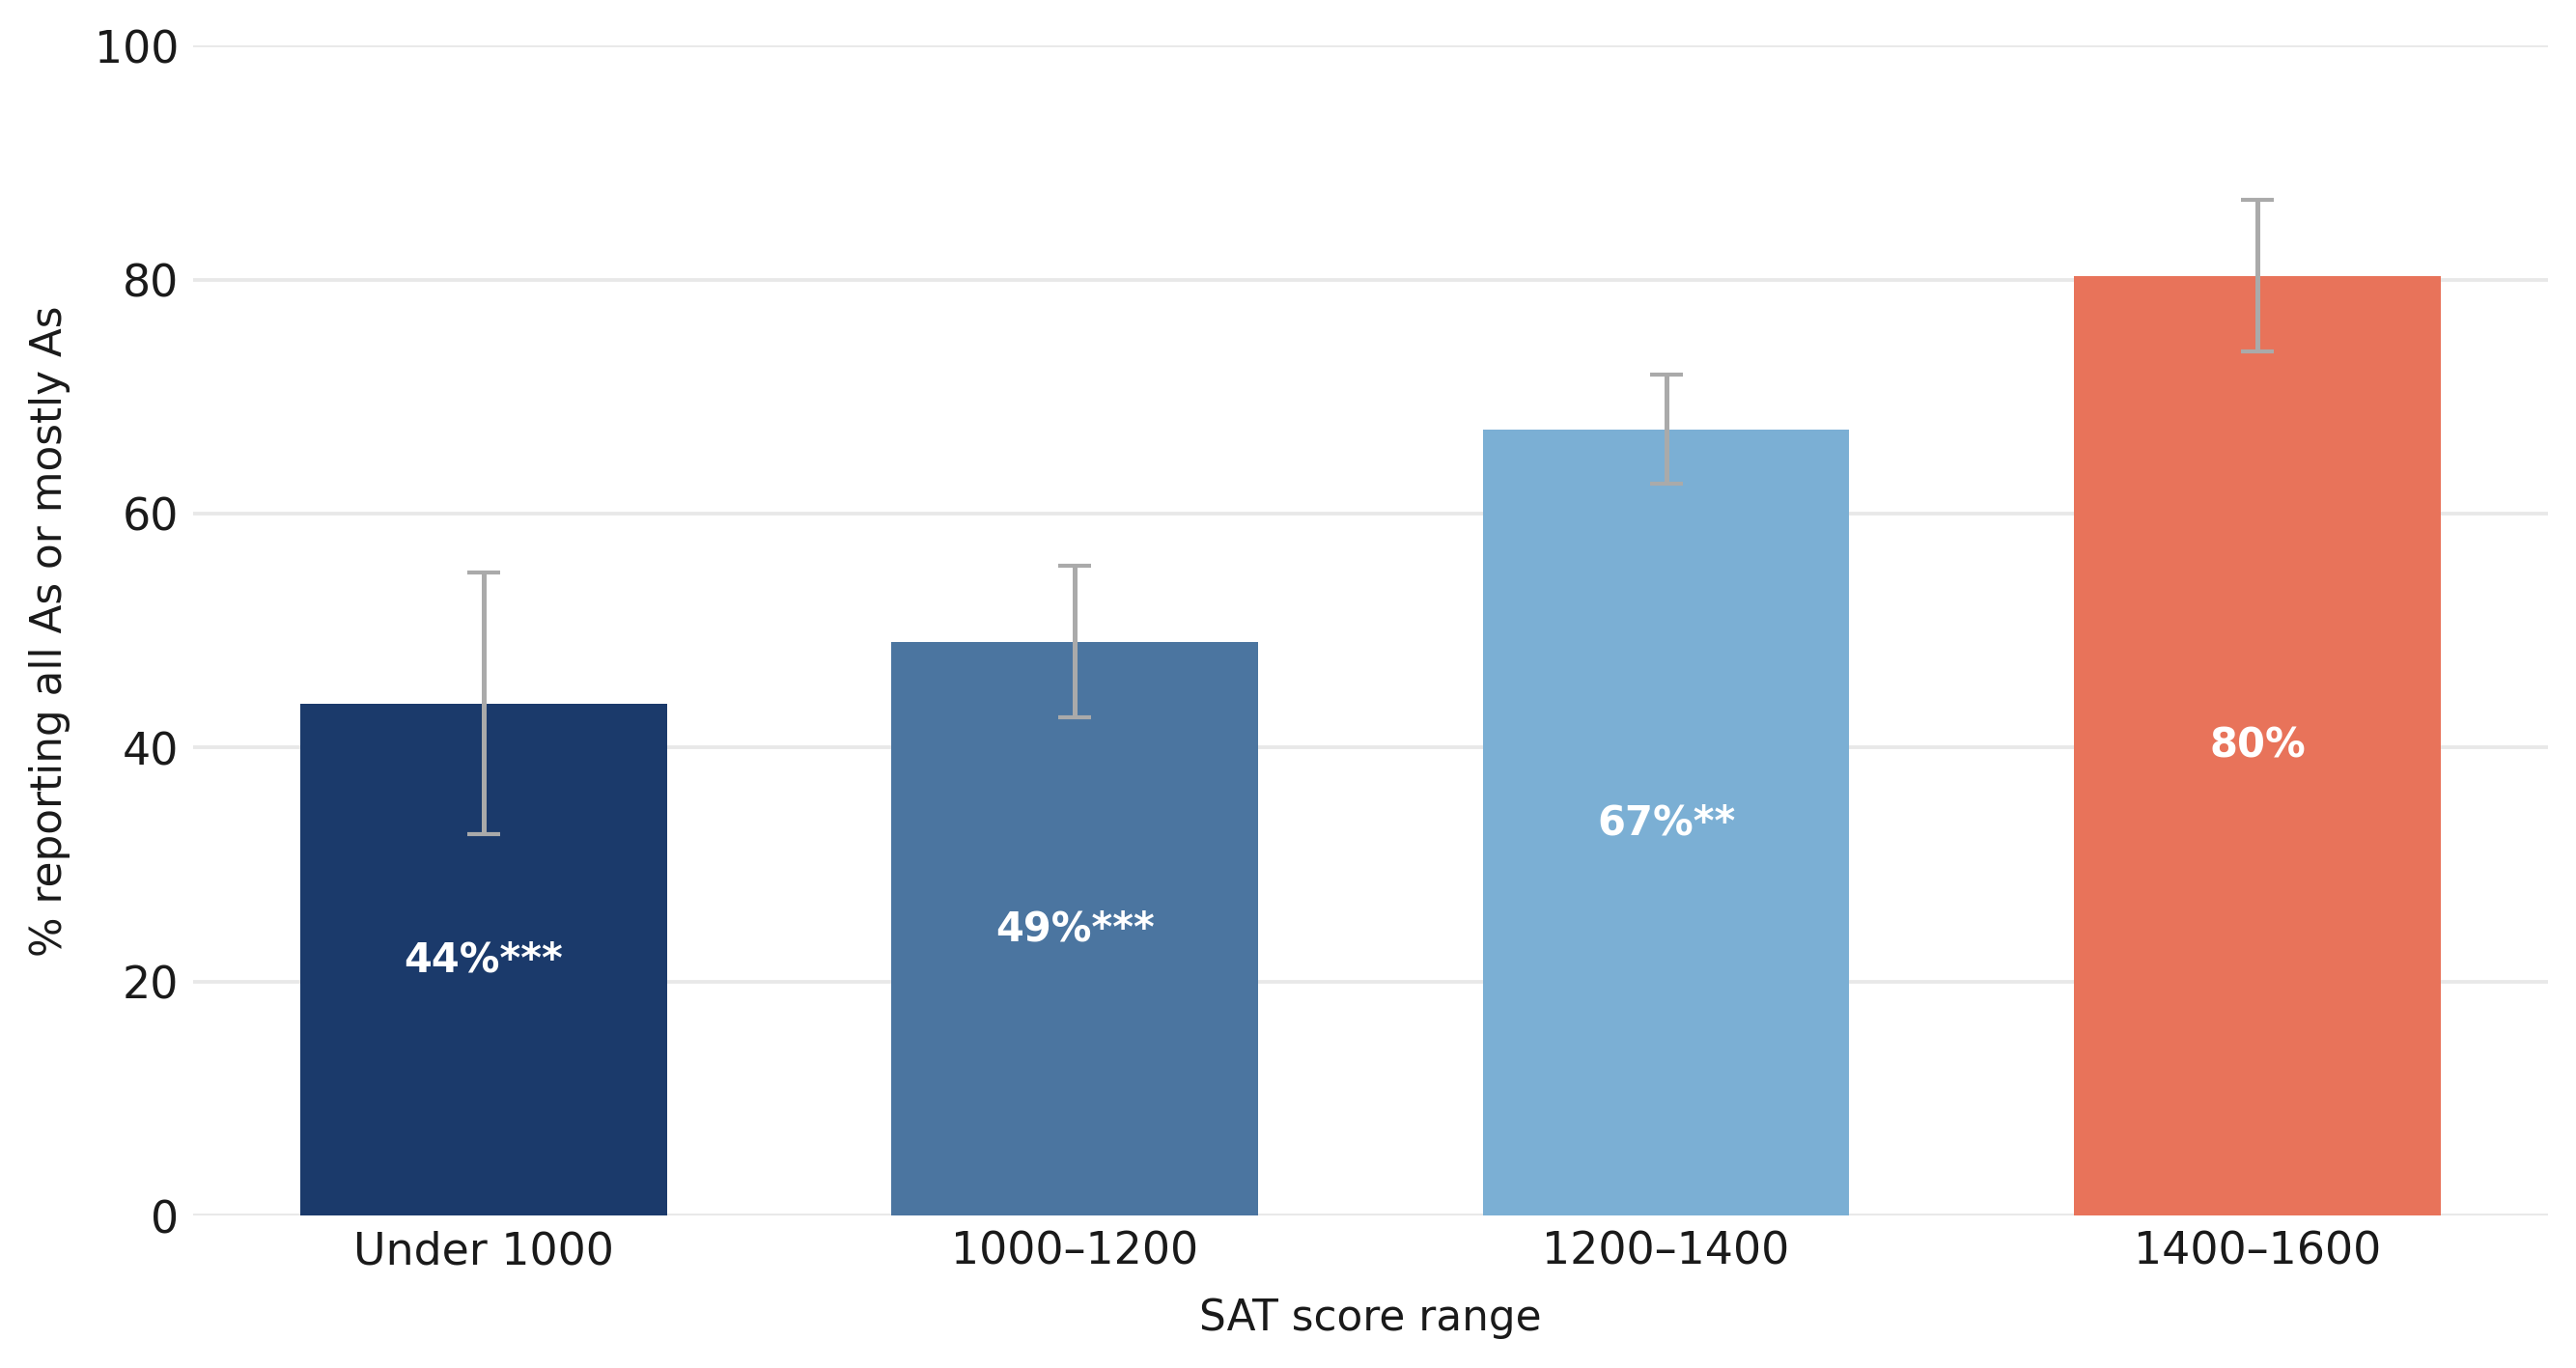
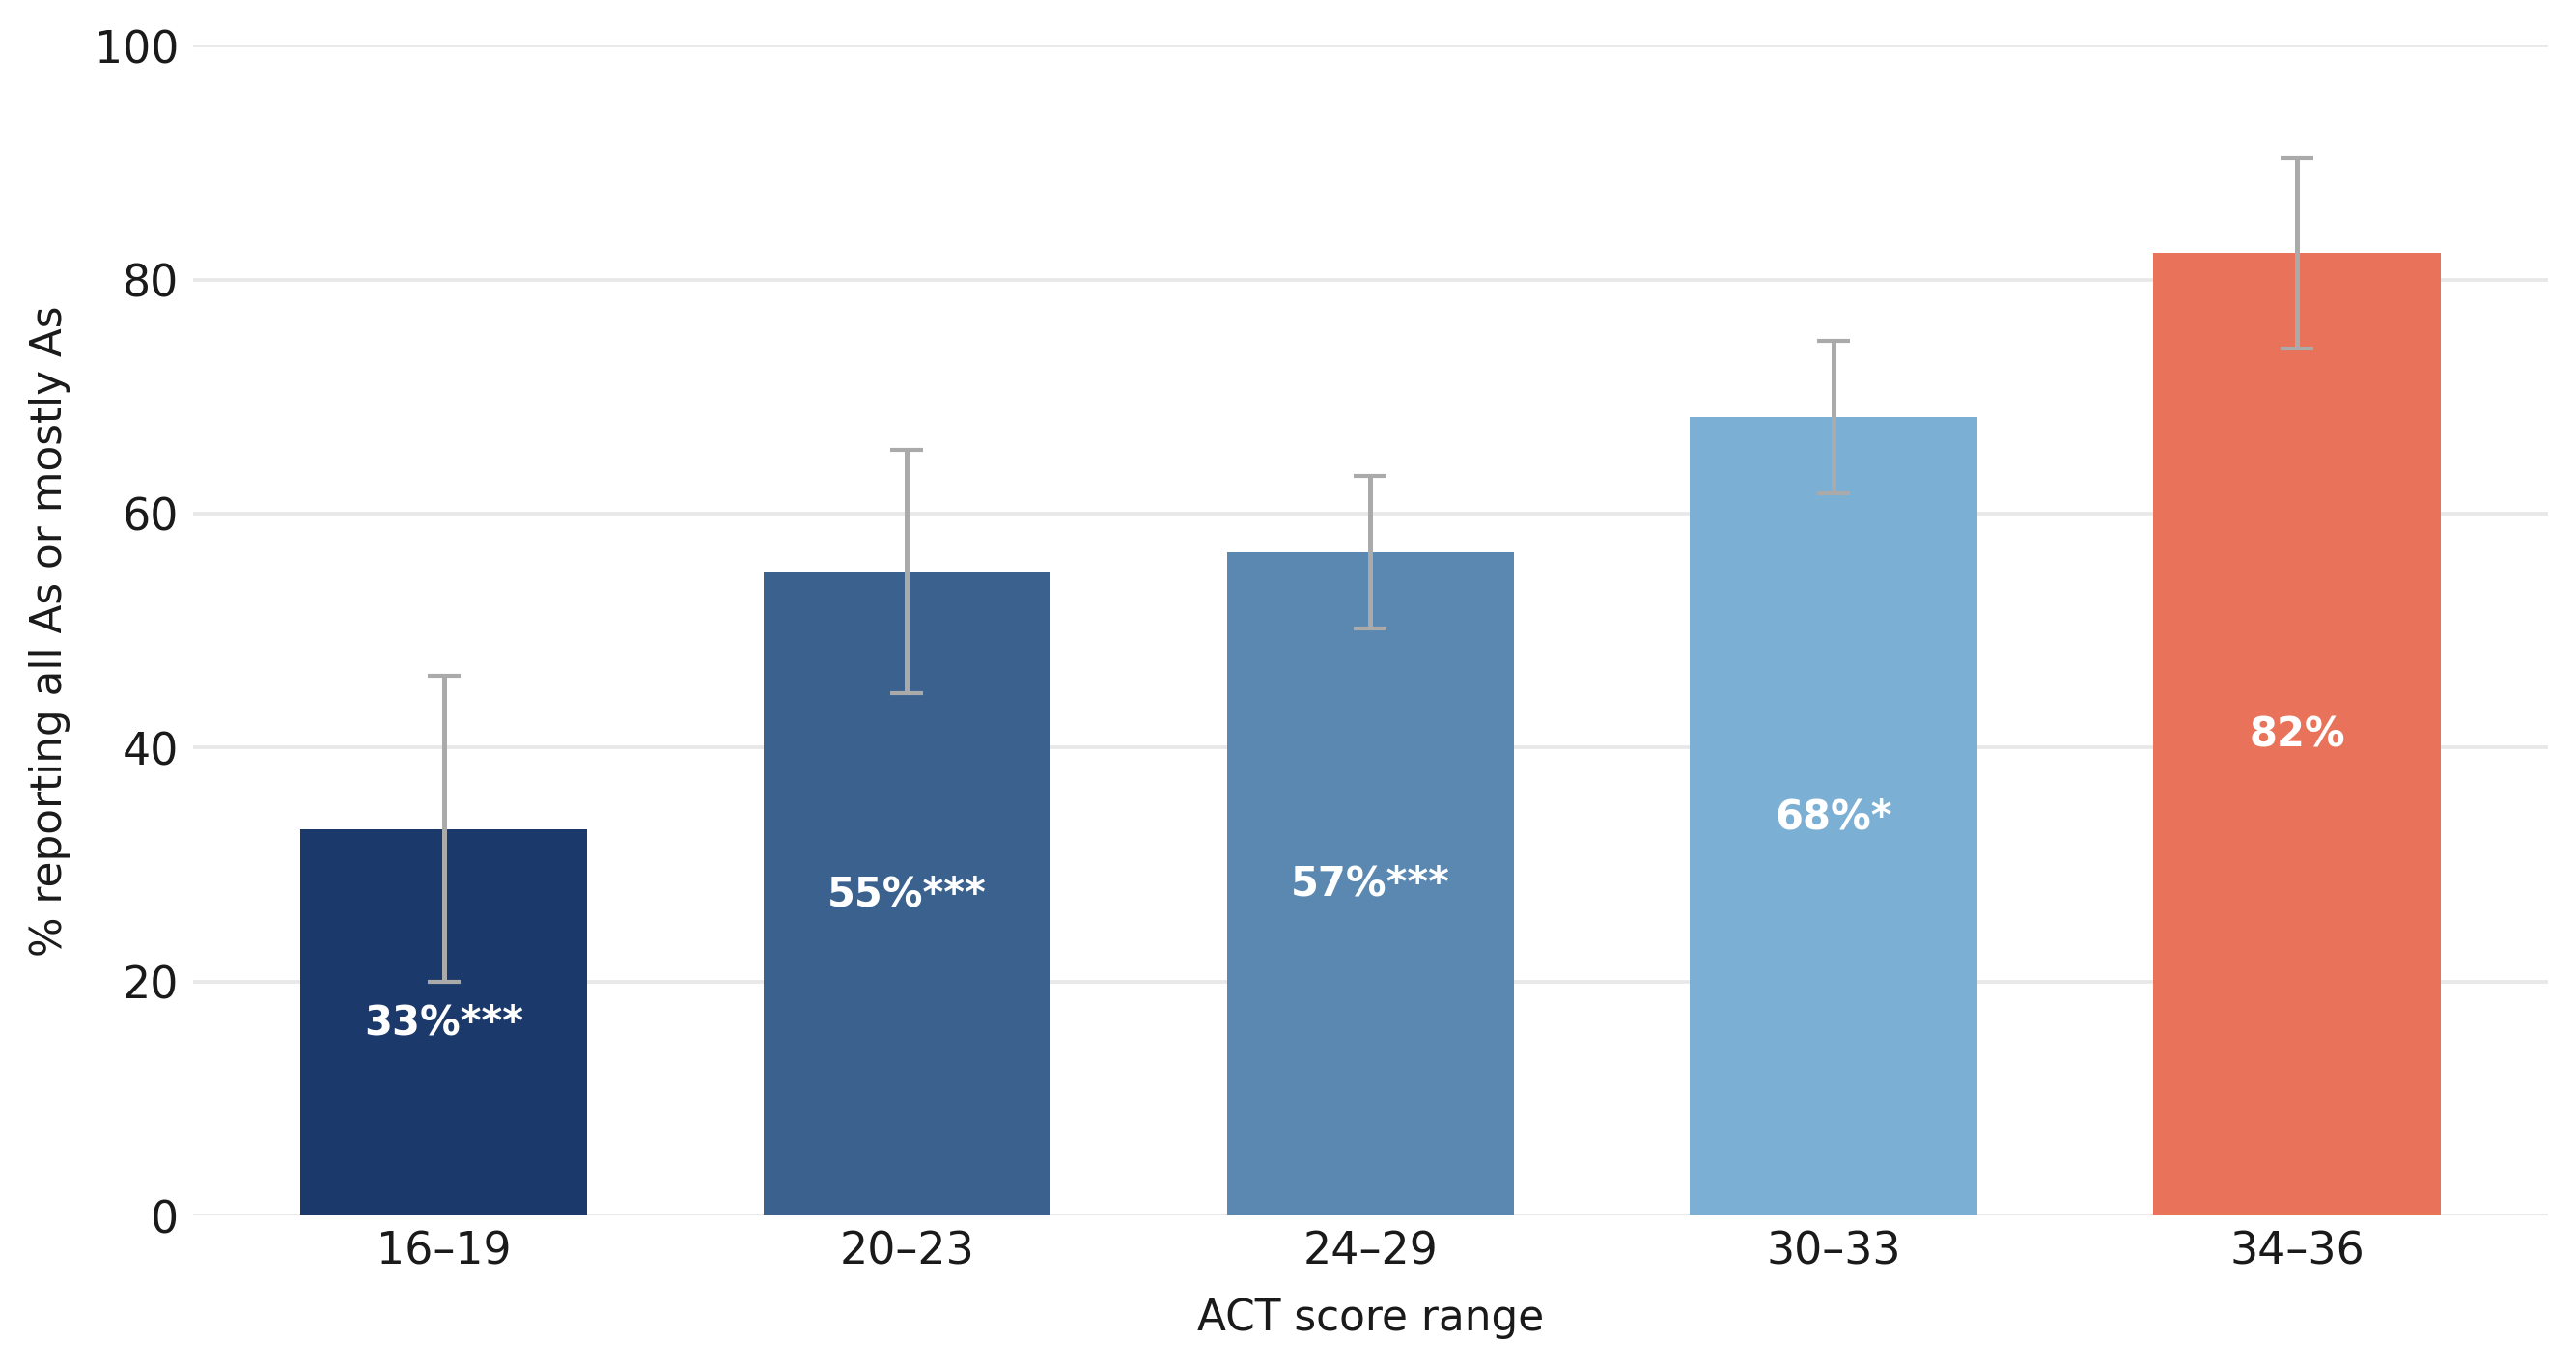
At the same time, grades are heavily concentrated at the top. Fifty-seven percent of respondents report earning all A’s or mostly A’s, including many whose SAT or ACT scores place them in the bottom half of the national achievement distribution (Figure 4). Put simply, high grades don’t always mean students have mastered the material.

Figure 4. A sizable minority of respondents at the bottom of the SAT and ACT score distributions still report getting all or mostly A’s.

Panel A

4a

Panel B

4b

Note: Bars display the percentage of respondents who report earning all or mostly A’s in high school by self-reported SAT or ACT score range. The salmon-colored bar indicates the reference category (the highest SAT/ACT score range); confidence intervals calculated at the 95 percent level; + = p < 0.1, * = p < 0.05, ** = p < 0.01, and *** = p < 0.001.

Taken together, the findings suggest that American high school students are caught up in—and often contribute to—a disturbing and interconnected set of problems: rampant distraction, widespread AI misuse, heavy dependence on screens, and grading practices that make it easier to earn high marks without mastering the material.

What to do? Fitzpatrick urges states, districts, and schools to take five steps (some of which echo LAUSD’s policy):

  1. Reduce the amount of time students spend on devices.
  2. Place greater reliance on supervised, in-class, paper-and-pencil, and oral exams.
  3. Make grading expectations school-wide and explicit by eliminating routine retakes and enforcing valid consequences for late work.
  4. Ensure that school-device firewalls work.
  5. Adopt stricter bans on cell phones and other personal devices.

We of course agree, but here are three additional observations.

First, device-delivered education runs the risk of diminishing the role of the teacher. In the hands of a less skilled instructor, technology can shift the teacher’s role from knowledgeable expert who sets high expectations and builds trusting relationships to a classroom monitor who watches students work on screens and tries to enforce on-task behavior. When technology endeavors to replace effective teaching rather than support it, districts and schools need to tap (or slam!) the brakes.

Second, this whole thing brings to mind the late Theodore Sizer’s much-lauded 1984 book, Horace’s Compromise, named for fictional high school teacher Horace Smith, who tacitly agrees not to push his students too hard if they agree to sit quietly and cause no trouble. Sizer summed it up as, “Give a little, and get along.” Today, Horace’s students would have screens to help them sit quietly, making the compromise even easier. In other words, today’s kids can be sitting in class and still be somewhere else entirely.

And that, in our view, is the deeper danger with overreliance on screens and AI, in combination with weaker expectations and easier grading. Students can “check out” without leaving the classroom. Over time, that means that precious few will develop the knowledge, concentration, and self-discipline they need to reach their full academic and cognitive potential in life and in service of society.

Third, the combination of AI-driven cheating, tech-enabled distraction, and equity-minded grade inflation is hollowing out the American high school experience. Today it’s beginning to seem more performative than substantive. Yes, high schools have always included some amount of hoop-jumping, box-checking, and authority-pleasing; that’s the nature of any large bureaucratic organization, and young people have to learn to deal with it. (One of us—guess who—facetiously calls it the “bull-shittification of high school!”) But that doesn’t mean we have to keep piling it on. If classes can be endured by zoning out on screens, assignments evaded through cheating, and high grades awarded without mastery, then we have to ask ourselves: What are we even doing here?!

If we listen to young Americans, we hear that the high school experience is not working as it should—and that the problems go deeper than tinkering around the edges. Screen-time limits and such might help, but only if paired with a major rethinking of the high school experience. Yes, that means going back to pencil-and-paper assignments, recalibrating what it takes to get an A, and putting the Chromebooks back in their carts. All that will help. But it also means asking our teenagers to do cognitive work that really matters to their futures, whether of the traditional college-prep variety or something more career-oriented.

In other words, we will only solve these problems by restoring the basic conditions for learning: attention, effort, honest work, and adults willing to hold adolescents to high expectations.

view
Graduate

What Massachusetts’s portrait of a learner gets right (and New York’s doesn’t)

Meredith Coffey, Ph.D.
9.10.2026
Flypaper

When I taught high school in Virginia in the early 2020s, I was only vaguely aware of the existence of something called “portrait of a graduate.” Whatever this portrait was, it didn’t seem to impact my daily work, so it didn’t capture my attention. On the other hand, I knew my IB courses and our state assessments backward and forward. Those shaped what we did in the classroom.

Since then, portraits of a graduate (or, sometimes, of a learner) have spread to at least 26 states, plus many more districts. The rationales vary—student disengagement, misalignment with evolving workforce demands, equity concerns—but the final product is typically a list of broad “competencies” that schools are meant to cultivate in each student. These range from the academic (“reason quantitatively”) to soft skills (“collaboration and teamwork”) to the warm and fuzzy (“embraces differences/diversity”).

I like to think schools were already doing the four to 15 items featured in each portrait. But as I experienced in Virginia, what actually affects students is not those specific items, but instead the practical requirements that change—or don’t—as a result of implementation.

As I’ve already written, I’m deeply skeptical of New York’s approach. To borrow from the immortal words of Cher Horowitz, the Empire State’s portrait is a “full-on Monet”: “It’s like the paintings, see? From far away, it’s OK, but up close, it’s a big old mess.” That is, seemingly unobjectionable competencies like “creative innovator” and “critical thinker” give way, upon inspection, to an apparent disregard for rigor, consistency, and transparency.

And unlike impressionist art, education policy can’t afford to brush over the details.

Fortunately, though, not every state portrait is trending Monet. To the contrary, the most recent portrait-of-a-learner proposal from Massachusetts is promising and could offer a model for other states heading in this direction.

Admittedly, the Bay State’s portrait puts forth its own hokey competencies, like “self-aware navigators.” But behind the jargon is a proposed system that specifies four sets of requirements for high school graduation: end-of-course (EOC) exams, a culminating experience, postsecondary planning, and, like 46 other states, required coursework.

The state EOC exam requirement is arguably where Massachusetts’s proposal differs most from New York’s. Two years ago, Massachusetts voters eliminated the state’s much-lauded MCAS test as a graduation requirement—much like the Board of Regents has done to New York’s erstwhile exit exams—but the Bay State hasn’t abandoned the concept of a consistent, externally validated measure of student learning. According to the plan, the new EOC assessments will be aligned with specific courses in English language arts, math, science, and potentially social studies, and they will be “designed, administered, and scored” by the state. Of course, the value of those exams will depend on how high Massachusetts sets the bar, and what the state does with the results.

Still, compare this to New York, where as-of-yet-undefined “assessments” are just one of many suggested options for gauging students’ graduation readiness, alongside performances, presentations, portfolios, and for all I know, baking soda volcanoes and shoebox dioramas—all to be designed and scored by the students’ own teachers. Even with a statewide rubric and the best of intentions, I can’t fathom how teachers could ensure consistency in scoring for “effective communicator” across a research paper on the Cold War, a dramatic recitation of a Shakespearean soliloquy, and a presentation on the works of Sabrina Carpenter.

With EOC assessments baked into the graduation requirement, Massachusetts will be far better equipped to identify where students and schools need more support, which is crucial for educational equity. And, as long as standards are set high enough, its proposed system will also ensure that all students are held to a high standard.

The exams aren’t the whole story, either. Even Massachusetts’s most flexible graduation requirements offer more consistency than anything in New York’s plans to date. Bay State students will need to complete a “culminating experience”: either a capstone project or a portfolio of assessments. Districts (not individual teachers) will define and score students’ culminating experiences based on a statewide rubric.

This is potentially a deft compromise: Stakeholders wanted students to demonstrate learning beyond traditional testing. The culminating experience allows some local discretion while ensuring consistency within districts. Most importantly, it comes in addition to—not instead of—statewide exam requirements that enable education leaders to compare results across districts, schools, and student subgroups. In short, Massachusetts hasn’t thrown the baby out with the bathwater; it’s found a way to honor the valid concern that a test can’t fully capture a student’s knowledge without effectively letting every school create its own set of graduation requirements.

Finally, the Bay State’s “postsecondary planning” recommendation includes several substantive components that address oft-cited concerns about students’ readiness for life after high school: demonstration of financial and digital literacy, federal and state financial aid application completion (or opt-out), and work-based learning experiences that may include internships, community service, and the like.

Of these, New York’s current proposal mentions only the potential for work-based learning, suggesting that districts could choose to “increase opportunities for career-connected learning.” It’s not clear whether any more substantive postsecondary preparation will become part of New York’s requirements.

Lest readers see New York’s haziness as excusable, since full implementation won’t occur until 2029, I’ll observe that Massachusetts has until 2031. That gives the Bay State a full five years to develop materials, train educators, and fine-tune the details. There’s just no excuse for New York to be building the plane while flying it when 860,000 high schoolers’ educations are at stake every year.

In sum, the aspirational nature of portraits of a graduate needn’t come at the expense of substantive graduation requirements—the stuff that actually shapes instruction and learning. States adopting portraits would do well to be a Massachusetts, not a Monet.

view
School backpack

Is this the post-homework era?

Alicia Anderson
9.10.2026
Flypaper

In Fordham’s new survey of American high school students and recent graduates, less than half believe their school has realistic AI policies that keep up with the times. Most students believe their peers use AI on schoolwork without permission (62 percent) and the majority (58 percent) indicate that homework is meaningless due to AI use on assignments. Are they right?

In an attempt to determine what’s lost when students outsource assignments to AI, researchers from Stockholm University and the University of Hong Kong analyzed administrative data from nearly 27,000 Chinese secondary school students over a 30-month period coinciding with the growth of publicly accessible sophisticated AI models. The data include homework scores and completion times, test scores, and self-reported student AI use from September 2022 through June 2025. The findings, described in a working paper, show a clear disruption to learning.

Between September 2022 and June 2025, self-reported student AI use rose from nearly zero to about 80 percent. Among users, 81 percent showed signs of outsourcing homework. Homework scores rose 18 percent in the first six months of students’ AI use, even as they spent much less time completing the assignments. Meanwhile, scores on their monthly exams fell 20 percent below the baseline results. The learning loss compounded, with AI-user scores on China’s high-stakes college and high school entrance exams falling by 18 and 24 percent, respectively, after two years. Learning loss was greatest for younger secondary school students, boys, and high achievers.

It’s a trend that extends beyond China. Newly released PISA results show the lowest reading and math scores on record among students in OECD nations. American students’ reading scores fell 14 points since the 2022 assessment, a period that overlaps with the expansion of widely available AI tools. Andreas Schleicher, Director for Education and Skills at the OECD, notes that students using AI “are more likely to report lower levels of intrinsic motivation for learning,” adding that those who believe hard work matters more than talent tend to perform better on PISA. There’s nothing hard about copying and pasting your problem set or essay prompt into ChatGPT.

AI-outsourced homework doesn’t just remove a tool that reinforces in-class lessons and lets students learn how to work through difficult tasks independently. The outsourcing also breaks a feedback loop that helps teachers, parents, and students work in partnership to ensure struggling students receive the support they need.

It was only possible to see how much students lost by outsourcing their work to AI in the Chinese secondary school study because the students were regularly assessed: closed-book exam results let researchers trace learning trends, including cross-subject trends that may be missed by individual teachers. A return to old-school testing like blue books and oral exams might help within individual classrooms—the Fordham report shows that over a quarter of U.S. students even use AI for help during quizzes and tests. However, the scale of potential learning loss makes this concern larger than any one classroom or school. States must maintain rigorous accountability systems that can reveal compounding knowledge and skill gaps before it’s too late for students to catch up.

For decades, homework assignments provided checkpoints between unit tests while building students’ capacity for sustained effort. Today, homework assignments are just as likely to mask deficiencies in skills and broader understanding. It’s irresponsible to ignore the reality of new technology and its effects on learning, particularly on independent assignments. Growing evidence about student AI use supports sounding an alarm about learning loss, though it’s not a death knell for school as we know it. Yet for traditional homework? Perhaps it should be. 

view
Sector mixing among US homeschoolers SR image

Examining education sector mixing within homeschool families

Jeff Murray
9.8.2026
Ohio Gadfly Daily

Homeschooling in the United States is often imagined as an all-or-nothing decision: Families who choose it do so full-time, for all their children, across their entire K–12 education. Recent findings from Johns Hopkins University’s Homeschool Research Lab revealed a more complex picture of students moving between educational settings (homeschool, public school, co-ops, etc.) at different points in their lives. But explanations for and descriptions of these switches were absent. A new report from the lab’s researchers remedies that.

Albert Cheng, Angela Watson, and Matthew Lee use data from three administrations of the National Household Education Surveys (NHES) to a nationally representative sample of U.S. households in 2012, 2016, and 2019.[1] Each household included provides information about schooling experiences, parent involvement in their child’s education, family life, and demographic characteristics for one randomly selected school-aged child in the household. While NHES defines a household as “homeschool” or “conventional school” based on the response for that single sampled child, the survey does actually ask about the educational mode of other school-age children in the home. The analysts exploit this additional data for their study. Households in which the sampled child had no siblings or only had siblings who were too young/too old to be enrolled in primary and secondary schooling were excluded. The final sample comprised 25,261 households.

First, the team provides summary statistics to illustrate the prevalence of what the they call “sector mixing”—that is, a family simultaneously having at least one child in homeschooling and at least one other child in a district or private school. Over all three waves of NHES data, an average of 2.5 percent of U.S. households with more than one school-aged child practiced sector mixing. This includes a majority (53 percent) of the multi-child households that NHES deemed “homeschoolers” via their single-sampled-child methodology. The remaining 47 percent of multi-child homeschoolers were indeed exclusively in that setting. Nearly all (97 percent) of the multi-child households deemed “conventional schoolers” were exclusively so—although that could include a public and a private school within one family, a different type of “mixing” than the analysts are looking at here. The percentage of conventional schooling families embracing homeschooling for one or more children rose between the 2012 and 2019 administrations of the NHES survey, from 1.6 percent to 2.8 percent.

Family size, parental education, and parental employment status had the largest impact on sector mixing. Keeping in mind that the overall rate of sector mixing is low (2.5 percent), even small changes in likelihood are significant. Every additional child increased the likelihood of a family practicing sector mixing by about 1 percentage point. White families were more likely to practice sector mixing than Black, Hispanic, and Asian/Pacific Islanders by roughly 1 percentage point; households with college-educated parents were more likely to practice sector mixing than their high-school-diploma-only peers. Households in which both parents are working for pay were 1.6 percentage points less likely to practice sector mixing than households in which one or neither parent is working for pay. Sector mixing declined, however, at the highest income levels, with the wealthiest families in the survey nearly 2 percentage points less likely to do so than the lowest-income families. Sector mixing was more common in the South and West, but there were no significant differences in mixing rates based on urban, suburban, or rural locations.

NHES homeschool families were asked to consider eight specific reasons[2] for homeschooling their child and to choose all that applied to them. The analysts found that reasons related to “household needs” (such as providing religious or moral instruction and wanting a non-traditional approach to education) led to far less likelihood of sector mixing (by 10 to 15 percentage points, compared to the full NHES sample), while reasons related to “child-level needs” (like illness or mental health concerns) led to a much higher likelihood of sector mixing in the household (16 to 19 percentage points).

The researchers believe that their estimates of sector mixing among U.S. families likely underreport the true numbers due to the fact that the NHES surveys are not designed to provide the full data required for proper calculation. Nevertheless, they conclude that the picture of “the variegated nature” of homeschooling their estimates paint—prevalence, motivation, demographics, etc.—is valuable. This is especially true of sector mixing between homeschooling and traditional public/private schools. More data are required, but the questions needing answered by those data are becoming more and more clear.

SOURCE: Albert Cheng, Angela Watson, and Matthew Lee, “An analysis of educational sector mixing among U.S. homeschooling families from three waves of the national household education survey,” Cambridge Journal of Education (August 2026).


[1] 2023 data were captured, but are not publicly available as yet.

[2] (1) concerns about school environment such as safety, drugs or negative peer pressure; (2) dissatisfaction with academic instruction in school; (3) desire to provide religious instruction; (4) desire to provide moral instruction; (5) the child has a long-term mental or physical health problem; (6) the child has a temporary illness that prevents him or her from going to school; (7) the child has a special need that the school cannot or will not meet; and (8) interest in a nontraditional approach to the child’s education.

view
Empty school desk

Fewer students, more dollars, and harder choices

Mike McShane
9.10.2026
Flypaper

At the beginning of the movie The Big Short, there is a title card with the epigram, “It ain’t what you don’t know that gets you into trouble. It’s what you know for sure that just ain’t so.” It attributes the quote to Mark Twain.

Ironically, there isn’t any proof that Twain actually said or wrote that.

But the sentiment of the aphorism is so, so true. Fully believing something that isn’t true can get you into serious trouble.

With a brilliant new paper in the prestigious journal Education Finance and Policy, Matt Lee and Ben Scafidi (friends of Informed Choice) take head-on one such myth—something that many people in education believe for sure that just ain’t so. It is the myth that declining student enrollment is linked to declines in per-pupil expenditures.

They look at enrollment changes and expenditures from 1998 to 2019. (They wisely choose this period to look at trends, before Covid disrupted enrollment patterns and the federal government helicopter-dropped billions of dollars into K–12 schools.) And what do they find? In the authors’ own words:

In our preferred estimates that control for changes in student characteristics, we find that districts with declining enrollment experienced significantly larger increases in total and current expenditures per pupil relative to districts with growing enrollment. These trends were present for the one-year, four-year, and 20-year enrollment changes under study. While magnitudes became attenuated in the longer time periods, there were still substantially larger increases in per-pupil expenditures over both four-year and 20-year changes in districts with enrollment declines. [Emphasis added.]

Yes, you read that right. While most people think that when school districts lose students, they also lose funding…that just ain’t so.

How could this be? The authors, again:

These advantages with respect to expenditures and resources were possible because declining districts saw state and especially local and federal revenue declines that were smaller, in absolute value, than their declines in enrollment—or they experienced increases in revenues as enrollment declined.

If you’re interested in all of the gory details as to how states cushion the balance sheets of districts with declining enrollments, Marty Lueken and James Shuls wrote a paper for EdChoice back in 2023 working through all of the ways in which school districts are “held harmless.” The primary mechanisms are declining enrollment provisions and funding guarantees. These policies allow districts to calculate enrollment for the purpose of state aid based on prior years when they had more students and guarantee minimum amounts of funding regardless of enrollment. Couple that with general funding increases that states enact legislatively, and you have a system where schools can get more money for serving fewer students.

To be fair, there are some good reasons to cushion district funding as enrollment declines. Schools have certain fixed costs, and it can be challenging to adjust those on the fly.

Now, I know what some of you are already thinking: “But private and charter schools have to make those adjustments every year, as does pretty much any other revenue-dependent enterprise, so why shouldn’t public schools?” That is a fair question. My response to that would be…that I don’t really have a good response. I actually agree with you. I was just trying to be reasonable and conciliatory. The truth is that some people see public schools as a fundamentally different type of entity than private or charter schools, which merits different treatment. I am not one of those people.

Anyway, maybe at least the school districts are putting the extra money to good use? The authors again:

This pattern translated into much larger increases in total staffing and teachers per 100 students in declining districts relative to growing districts. Regarding compensation for teachers and other employees, declining districts had no detectable advantage per the one-year and the 20-year time periods, while growing districts had a very modest advantage in compensation per employee over four-year periods. However, this compensation advantage for growing districts over four-year periods was not robust across alternative specifications.

So it does appear that districts are using this funding increase to hire more staff. They are not, however, using it to pay those people more.

This is a story of tradeoffs. When more money comes in, you can spend it on your existing staff and give them raises, or you can use that money to hire new staff. We can see what districts chose to do. Unfortunately, hiring more staff can exacerbate the funding strain of declining districts as more and more people need to be funded by a pool of fewer and fewer students.

As John Kristof pointed out earlier this week, enrollment declines are going to continue. Developing a way to manage the fiscal implications of those trends is only going to become more important in the future. The first step is coming to grips with reality.

Editor’s note: This was first published on the author’s Substack, Informed Choice.

view

Too much tech, too little learning? | Episode 1033 of The Education Gadfly Show

9.9.2026
Podcast
 

Brian Fitzpatrick, research manager at the Thomas B. Fordham Institute, joins Mike Petrilli and David Griffith to discuss his new report, High Tech, Low Standards: High School in the Age of Distraction. They examine how cell phones, school-issued devices, grade inflation, and AI are changing the high school experience, why banning phones alone may not be enough to solve the distraction problem, and what schools can do to refocus students on learning.

Then, on the Research Minute, Amber Northern reviews a new study on test-optional admissions at elite colleges. The findings suggest these policies may unintentionally disadvantage high-achieving students from disadvantaged backgrounds.

Recommended content:

  • High Tech, Low Standards: High School in the Age of Distraction —Brian R. Fitzpatrick, Thomas B. Fordham Institute
  • Can schools escape the digital delusion? | Episode 1026 of The Education Gadfly Show
  • Why education technologies disappoint —Adam Tyner, Thomas B. Fordham Institute
  • How Test-Optional Policies in College Admissions Disproportionately Harm High-Achieving Applicants from Disadvantaged Backgrounds —Bruce Sacerdote, Douglas O. Staiger, and Michele Tine, American Economic Association (September 2026)

Feedback Welcome: Have ideas for improving our show? We would love to hear them. Send them to [email protected]


Transcript

This transcript was generated with the assistance of AI and lightly edited for clarity and readability.

Introduction

Mike Petrilli [00:00]

Welcome to The Education Gadfly Show.

I’m your host, Mike Petrilli of the Thomas B. Fordham Institute.

This week, we’re joined by our own Brian Fitzpatrick to discuss his new report, High Tech, Low Standards: High School in the Age of Distraction. Just how much are cell phones, school-issued devices, and other technology distracting students from learning, and what should schools do about it?

Then on the Research Minute, Amber Northern reviews a study from Dartmouth examining whether test-optional college admissions policies at elite universities may actually disadvantage high-achieving students from disadvantaged backgrounds.

All that and more this week on The Education Gadfly Show.

Clip [00:43]

This is The Education Gadfly Show.

AI is undermining the high school experience? I’m shocked!

What does Gadfly say?

Mike Petrilli [00:54]

Hello, this is your host, Mike Petrilli of the Thomas B. Fordham Institute, here at The Education Gadfly Show and online at FordhamInstitute.org.

And now, please welcome back our special guest for this week, our very own research manager, Brian Fitzpatrick.

Brian Fitzpatrick

Thanks for having me, Mike.

Mike Petrilli

Yeah, welcome back, Brian.

Also joining us today, as always, my co-host, David Griffith.

David Griffith

Hey, Mike. Hey, Brian.

Mike Petrilli

Yeah, well, you know, Brian has sometimes been here to fill in for Amber on the Research Minute, but that is not why he’s here.

He’s here to report on a new Fordham report that he authored. It’s called High Tech, Low Standards: High School in the Age of Distraction. Let’s talk about it on Ed Reform Update.

Ed Reform Update: High Tech, Low Standards

Mike Petrilli [01:45]

All right, gang, I know I’m getting right to business today. No small talk for me, but it’s just because we have so much to unpack here on this shameless self-promotion version of the podcast.

Hey, this is, if I say so myself, a really super cool survey that we have designed and put in the field and got some really interesting responses to.

I’m sure I’ve said this before on the show, but I will repeat it, which is that when it comes to survey research, certainly in our field, but in general, I’m not a big fan of issue research when you ask, especially just sort of random voters or parents, hey, let me ask you about some complicated education policy topic you’ve never really thought about before and see what you think about some various forced choices.

And by the way, let me use some language and choose the wording so that you give the response I’m hoping you’ll give so I can use it in my advocacy. I don’t find that super helpful.

Not to say that tracking some opinions in education isn’t valuable. I think stuff that everybody can kind of understand and relate to, and maybe there’s a controversy, okay. But again, we know that a lot of these are push polls.

Here at Fordham, when we get the opportunity to put a survey out there, what we prefer to do is use it to ask people in our schools what the heck is going on. Because we have so little information about what is actually happening in America’s schools.

We see it through maybe our own kids’ school, and we see it through the lens of the media, the reporters who get out there and look in schools. But those are anecdotes, right?

So how do we know what’s actually happening?

Well, until people finally do what I’m asking and put videos or Alexas in every classroom so we can just watch and listen in and find out what’s happening, you know, the cameras. Once we put flat cameras in every classroom, I mean, I think that’ll be super. That is the way I’m going to sell it.

Until then, asking teachers or students what’s happening in their schools is a pretty cool way to find out what’s happening.

So in this case, we got to ask students as well as recent graduates. These are high school students, recent high school graduates. We worked with some great firms, Impact Research and Up One Insights, to ask a bunch of questions with a focus on technology, on AI, on grading standards, some things that we care a lot about.

And look, there have been a bunch of surveys lately, not too many focused on kids, but some. And we think this one, though, is, of course, the best that’s been out there, but also asks some questions that other people didn’t ask.

So with all that lead-in, let’s get started.

Brian, the first finding you had in here was that illicit tech use is rampant in America’s high schools. Tell us about that.

Brian Fitzpatrick [04:45]

Happy to, Mike.

So when we use the phrase illicit tech use, you can think of this as misuse of all different sorts.

So the key finding there is that about half of students confess to using social media daily in school. About half of kids message their friends daily, or at least daily. About a third play video games. A third, in addition, also watch YouTube videos in class at least daily. And then even 3 percent of students confess to online gambling at least daily, though we can all be grateful that number is so low.

Mike Petrilli

Yeah. Those are some big numbers for most of those.

Although I have to say, I was the one who wanted to ask about gambling because, yes, I hear from my sons that it’s rampant in their high school, that you look around and boys especially are gambling online. So I was a little disappointed only 3 percent would fess up to doing that at school. We’ll see if that number grows over time.

But okay, I don’t know if any of this is necessarily surprising, right? But this does mean they’re doing a lot of things they’re not supposed to be doing during school on devices.

And we should say here, in some cases, these are their own devices, right? Their own phones or, I don’t know, their MacBooks or something. And in some cases, these are the school’s devices, right? The Chromebooks assigned to them.

Brian Fitzpatrick

Yes. So that’s our third finding, that school-issued devices are a big driver in this sort of use.

Many students say, in fact, 60 percent of students say they are on a school-issued device for the majority of class time.

So just thinking through the actual logistics of watching a YouTube video while you’re not supposed to be watching a YouTube video, you kind of have to think through social media or texting. You can pull out your phone and kind of put it to the side where the teacher can’t see.

Watching a YouTube video, you’ve got to have noise. I don’t want to say it requires it, but you probably need headphones in.

So we do see all this evidence that it is split between personal devices and school-issued devices. And the prevalence of school-issued devices really is a big driver in this sort of misuse.

Mike Petrilli

All right. Yeah. Okay.

And this is something schools, of course, can do something about. They can ban the phones. They can ban these other devices.

And for the school-provided stuff, we can go back to having Chromebook carts or computer labs instead of having one-to-one devices where they walk around with their Chromebooks all the time and are allowed to just whip them out at any point and pretend that they’re doing schoolwork when they’re really not.

All right. Another finding: AI is undermining the high school experience. I’m shocked.

Brian Fitzpatrick [07:44]

Yeah. So perhaps none of these findings are the most shocking in the world, but I think that the size of some of these numbers really is shocking.

Students admit to using AI for all sorts of things, some not so bad, like helping to explain a difficult concept. But oftentimes they are using them to solve math problems for them. Half of students admit to doing that.

And I think the most glaring finding out of the questions we asked on AI use was that 26 percent, so one in four students, admitted to using AI to answer questions for them during exams and tests, which is really, you know, helping write a draft is one thing, but answering questions during a test is, to me, the most shocking finding in this whole report.

Mike Petrilli

Yeah. And again, they’re admitting this, right? And so you think maybe it’s even higher than that.

So if the schools are doing anything to try to keep this from happening, they think they’ve got firewalls up or something, it is not working. Right? Not working at all.

All right. And then finally, we ask, and we’ll explain why we think this is all related, about the grading. And the final finding is that weak grading standards make distraction and AI misuse worse. Can you explain that one too?

Brian Fitzpatrick [09:12]

Yes.

So we’re definitely seeing a lot of trends that point to very low grading standards. That includes many students saying that they, in practice, can turn in assignments as late as they would like and still get full credit.

You’re also seeing this trend where students can retake exams. A small number of students, 7 percent, say they have unlimited retakes. Thankfully, that’s relatively low. But only 19 percent of students say exam grades are final. And 19 is not a lot. So the other 81 percent say they have some sort of retake policy that allows them to recover from doing poorly on an exam.

And then writ large, you are just seeing that Fs and Ds have essentially disappeared, and Cs are rare at this point, even for students who wind up getting very low SAT and ACT scores.

So a substantial minority of students who did the bottom half of the ACT or SAT score distribution are still getting As. That number is 45 percent of students still getting mostly or all As, despite very low test scores.

Mike Petrilli

I mean, that part is shocking.

We are talking about students who have extremely low math and reading skills on these SAT or ACT tests that they probably tried hard on, and they’re getting As, right?

So what the heck is up with that? This is the A for effort, but certainly not A for achievement.

And yet, have we told that to parents? Do parents know that? That, hey, your kid is getting good grades, but they actually are, I don’t know, reading at a sixth- or seventh-grade level? I doubt parents know that. We know parents don’t know that from other surveys.

All right. Well, thank you, Brian.

Let me pitch it over to David here. David, you’ve been following this. You were involved in it along the way.

As we list some of the findings, I guess both Brian and I were saying, well, I don’t know how surprising this is. But what do you think? What’s the big picture? Why should people care about this and think that actually this is something that is new and important to pay attention to?

David Griffith [11:38]

Well, I think, first of all, something doesn’t have to be new to be important.

And I do think there are new things in here. I mean, we’re asking about a certain type of illicit tech use that can be linked to actual school-issued devices, I believe, in a way that is not necessarily present in other surveys.

There are other ins and outs that are interesting. The choice findings are interesting. We didn’t get to that. The amount of time that kids are spending on this stuff.

Big picture, though, I’m not sure what to say that I haven’t said already, Mike.

I mean, do we want school to be fake? Right?

Is the purpose of school to just send kids somewhere where they’ll be watched by adults and allowed to watch videos? Or do we actually want school to do what it’s traditionally done, which is teach them?

Because if we want that, then they cannot be watching videos during class.

Mike Petrilli

And by the way, if it’s a video about the founding of the country or something.

David Griffith

No, I mean, this is what’s so absurd about the whole conversation, right?

There’s not a study in the entire universe that shows you have to watch a video to learn about the founders. Like somehow we’ve become convinced that there’s some value added associated with learning on a screen, which is, when you say it out loud, insane.

What we all know is that there might be neutral effects, and there are probably going to be negative effects and loads and loads of distractions that we’ve just voluntarily introduced into the learning environment.

And I just don’t know. You can talk to me all day about how the controls are supposed to function and blah, blah, blah. But I don’t know why we would voluntarily introduce tools into the classroom that only fail to do damage when teachers use them exactly the right way.

That’s a crazy approach to education policy. And I don’t quite know how it happened, except that nobody really had good enough data to stop it from happening. And the problem was so diffuse that nobody really felt like it was their responsibility.

But this is crazy.

Kids do not need to be taught how to use computers, okay? This generation does not need to learn how to use computers. It knows how to use computers. It needs to learn how to read and write and do math. And it won’t do that if it’s watching YouTube videos.

Sorry.

Mike Petrilli

I love it. Middle-aged man yells at the moon.

Everything you said, I agree with, David, and I think is spot on.

It reminds me of what David Steiner, I’ve heard him say a couple of times, Johns Hopkins, former New York State Commissioner, a great guy, David Steiner, that he spent a lot of time in his childhood in the U.K. And he’s like, in the U.K., they don’t expect school to be fun. It’s supposed to be miserable. The problem with you Americans is that you think school is supposed to be fun and interesting.

And now, look, I understand that in the hands of gifted teachers, a lecture on the founding of the country can be fun and interesting, right? But the point is to learn, and learning takes work and effort.

And we’ve known since Horace’s Compromise, if not before, that there are a lot of schools out there that will be happy to do very little teaching, and students will be very happy to do very little learning, if they just don’t kind of harass one another. Right?

The kids just sit there and don’t act up and don’t cause a problem, and then the teacher won’t expect too much of them.

But this is now this problem on steroids.

I mean, and you said, why are we faking it? I’ve said before, this is the growing bullshitification of the American high school. There’s always been BS. There’s always been bullshit. But are we just going to do more and more of it?

We’re not even going to pretend that it’s about teaching and learning anymore. We’re going to give the kids fake grades. We’re going to let them cheat like crazy. We’re going to let them sit there doing God knows what on their screens and just pass the time.

Okay, so David and I are fired up about this.

Brian, can you get into high dudgeon about this as well?

Brian Fitzpatrick [15:52]

I mean, I don’t know that I could say any of those sentiments better myself.

I think that the idea David mentioned that, at best, if you execute it perfectly, education technology might not hurt kids is a very concise and I think accurate way to describe this.

There’s plenty of evidence that these, under perfect conditions, can be effective tools, yada, yada, yada.

They are wonderful tools for distraction and cheating. They are really, really good for those two things. And we shouldn’t be surprised when the K-12 education system doesn’t execute this perfectly, and kind of allowing the Trojan horse of Chromebooks into our schools went poorly.

I don’t know that that should surprise us.

Mike Petrilli

Yeah. And on the cheating and distraction, I loved it that we were able to tell when the high school students were taking our survey. Wasn’t it something like 20 percent of them were doing it during the school day when they were supposed to be listening to their teacher?

Brian Fitzpatrick

That is correct.

Yeah, we used the metadata, and we could, in fact, tell that one in five of our respondents were sitting in school when they were doing this.

Mike Petrilli

All right. Hey, last thing. You mentioned the choice bit.

Now, my understanding is that we have to be careful with some small sample sizes here, but we did try to see if there were any differences for students in private schools and/or charter schools than in traditional public schools on these various things like how much they’re using technology and the grading stuff.

So just tell us a bit about that, knowing that we should have some caution when interpreting it.

Brian Fitzpatrick [17:39]

So one thing we found is that it appears that charter and religious private schools have students sitting in front of screens a bit less.

Now we’re talking in order of magnitude of like 50 percent of students in those schools said they were on screens the majority of the day versus 60 percent in traditional public schools. That’s not an enormous difference, but it is a statistically significant one.

The bigger difference was on grading standards, where it looks like religious private schools are twice as likely to have a no-retake exam policy, whereas charter schools were even less likely than traditional public schools to have a zero-retakes policy.

So religious private schools really are the standout for not allowing students to retake exams.

Mike Petrilli

Okay, so the private religious schools are sort of tougher graders. Maybe charter schools not as tough.

Brian Fitzpatrick

Yeah.

Mike Petrilli

And then the screens, there’s some differential.

I mean, it’s always interesting to think, how would this play out in a marketplace? We worry from the higher ed experience that there are certain education consumers that would like to go to a school that doesn’t ask them to do much and gives them a credential and straight As. And we worry about that happening in the school choice world too.

On the tech side, it seems like there are a lot of parents out there that are gravitating toward not wanting too much technology in their schools. Maybe that’s too new, but it’ll be interesting to see if that, you would think then, the private schools and charter schools might be more responsive to that than the traditional public schools.

Brian Fitzpatrick

Agreed. Yes.

Mike Petrilli

And David?

David Griffith

I was just going to say I cannot think of a better use of school choice than as basically a force for allowing parents to push back against this sort of thing and escape from, frankly, a sort of entanglement that teachers and principals have found themselves in, where even if they want to, they can’t quit this stuff because the district has purchased the technology and blah, blah, blah.

From the perspective of those individual educators, I think that’s challenging. Right? This is why we have school choice. It’s so that people can escape that sort of nonsense and go to a school where they can be confident that their kid won’t be in front of a screen all day.

That’s what school choice is for.

Mike Petrilli

Yeah, no, I think this is something we want to keep watching because, look, I can imagine, I think there’s probably data, probably ten years ago, if you advertised one-to-one computers and a lot of cutting-edge technology, that might have been a selling point in a lot of places.

And now maybe it’s the flip side. And so we’ll see how that goes.

All right. We’re going to have to leave it there, gang.

Those of you listening, watching, please do check it out and let us know if you see anything else in the findings that you think we should be paying attention to.

Again, the study is High Tech, Low Standards: High School in the Age of Distraction.

Brian, thank you for bringing it to us.

Brian Fitzpatrick

Thanks so much for having me.

Mike Petrilli

All right. Now it’s time for everyone’s favorite, Amber’s Research Minute.

Research Minute: Test-optional admissions and disadvantaged students

Mike Petrilli [20:53]

Amber, welcome back to the show.

Amber Northern

Thank you, Mike.

Mike Petrilli

Yeah. So I have to mention something. I was thinking about you, David, when I saw this week, it was a Wall Street Journal article saying that Washington, D.C. and Seattle are outliers and that they are managing to keep families with young children more so than most of the other coastal cities. And the headline says something about, in part, because of their “decent schools.”

And I thought, wow. I mean, if somebody said that about Washington, D.C.’s schools twenty years ago, you’d say never. They were considered the worst in the country. And the fact that we just kind of take it for granted that, yeah, yeah, the schools are pretty good in D.C. You can find a pretty good school for your kid. I think it’s pretty remarkable.

David Griffith

It’s true, Mike.

I mean, I don’t want to oversell it. There is still a ton of educational inequality in D.C., but most people don’t really blame that on the schools at this point, to be honest.

The schools, the district and the charter side, have their act together. They’re grabbing the football and running down the field as fast as they can. And yeah, there are actually some pretty decent schools in D.C., and not just the private ones. There are some good public schools too.

Mike Petrilli

Thanks for trending positive.

Amber Northern

Yeah.

Mike Petrilli

So there you go. Now you just got to fix Richmond schools, Amber. How’s that going?

Amber Northern

I mean, “pretty decent” really strikes me as, we’re excited about that? Pretty decent?

Mike Petrilli

Versus like a complete disaster where everybody knew that, all right, maybe your kid stays in for elementary school, depending if you’re west of the park or maybe on Capitol Hill. Maybe there are a few places. Otherwise, you’ve got to go private or you’ve got to move to Maryland or Virginia.

Now people can stay. And, you know, David’s staying there. Matt Yglesias stayed there. You get all kinds of people. Same with...

Amber Northern

Yeah. All right. Yeah, that’s my job.

Mike Petrilli

No, you’re right, Amber. We should aim higher than that. But it’s progress. Progress.

All right. Speaking of progress, I don’t know. You got something to tell us about progress in education research?

Amber Northern [23:15]

We do.

I hope you guys remember this one. You sent this around because you thought it was interesting. I’d covered it like a year and maybe more. But it came up again because that was the working paper, and this is the published version. There are not a lot of differences, but hey, I’m going to report on it again because it’s a cool paper.

It’s a trio of Dartmouth economists, and they examined the effects of test-optional policies on elite college admissions, particularly for high-achieving applicants from disadvantaged backgrounds.

They’re looking at Dartmouth applicants from the test-required years, 2017-18, and then they look at the test-optional years, 2021-22. They took out the Covid years.

The cool methods advantage they’ve got here is access to what they call hidden scores. So these are SAT and ACT results that some applicants submitted to Dartmouth but later changed their minds and were asked then to withhold these scores from their files, which they were.

So admissions officers never saw the scores, but the researchers could.

And they got to do this clean comparison of outcomes for applicants with identical scores who didn’t versus did reveal their scores.

So they’ve got a natural experiment here, and they’re basically exploiting a policy change from test required to test optional.

So the study is defining less-advantaged students as first-generation, from a neighborhood below the 50th income percentile, and they’ve got to be from among the 20 percent of most challenged high schools.

We’re going to do descriptive findings first.

Applications jumped from 42,000 to 57,000 in the optional years, but the profile of the applicants stayed similar. So you still had 46 percent of applicants chose not to submit a score.

And then they talk a little bit about the SAT, that it explained 22 percent of the variation in first-year Dartmouth GPA, but high school GPA explained just 9 percent. And then when they added GPA to the SAT, it only contributed 3 percent more.

So their whole point was that basically the SAT provides admissions officers with a more consistent academic signal than high school GPA alone.

And then they found that the test predicted equally well across income groups. So they didn’t find evidence of bias that we sometimes hear about relative to income.

All right. The core finding, headline finding: Less-advantaged, high-performing students tend to lose out when they don’t report their scores.

So among students with the same actual SAT/ACT score, the less-advantaged kids submitted scores at similar rates. Basically, the harm didn’t come from, okay, I’m going to strategically decide I’m going to withhold my score. It was more like they didn’t actually have the right information to know that the score might help them.

So for example, for all these less-advantaged applicants who withheld their scores, the admission rates hovered around 5 percent, and they didn’t correlate at all with the hidden scores.

But when you talk about the high-achieving, less-advantaged kids, so these are the ones that had an SAT above 1420, submitting doubled their chances. Their admission odds went from 2.9 percent to 7.2 percent, about an increase of 4.3 percentage points.

And then a less-advantaged applicant with an even higher score of 1550, their admission probability rose by about 10 percentage points merely by submitting these hidden scores.

For what it’s worth, when I reported earlier a year and a half ago on the working paper, they had even a higher benefit of submitting scores. It was about triple. Now it’s double. So I’m guessing some peer reviewers caught something. But still, it’s notable.

And then when they looked at the better-off kids, they said, you know what, this dynamic is completely different. Even when the better-off kids withheld their scores, their admissions chances still rose with their underlying test performance.

So it basically was suggesting that these admissions officers could infer their ability through other signals that perhaps the applications of the disadvantaged kids didn’t have.

So maybe they were looking at the school reputation. Maybe they were looking at the types of course offerings, something. But submitting a score was less consequential. It just didn’t mean as much for the kids who were better off.

And then the authors say, quote, since elite institutions interpret scores in the context of a student’s background, meaning a high score from a challenged school signals more than the same score from a wealthy suburb, the availability of test scores appears to promote rather than hinder social mobility.

In my words, all that says is these test-optional policies may unintentionally disadvantage the kids who they’re meant to help.

Mike Petrilli [29:01]

I love it, Amber.

And this is a group of kids that we care a lot about here at Fordham, the high-achieving, low-income, or HALO, kids, as we sometimes call them.

And on the one hand, you can say, okay, we can solve this through better counseling. Somebody should tell these kids, if you have the option to withhold your test scores, don’t. If you’re getting above a 1450, that’s amazing. A 1550? Oh my God, you’re a genius. By all means, send those scores in.

Even better is doing what Dartmouth eventually did, which is to end the test-optional thing and require students to submit their scores.

I mean, it’s so hard to think about how this gaming happens.

So at the admissions office level, the suspicion was among folks on the right was that, well, this was just a way for college admissions offices to continue to practice affirmative action on race without having as much data to sort of demonstrate it.

On the other hand, there are also people who have said, and this is on the left, right, and center, that, well, look, these colleges, what they really want to do is make it easier to admit full-pay students. In other words, very wealthy students who maybe have mediocre test scores but a very full bank account. And they need those kids to make the finances work, even with these huge endowments.

But look, I think this is just another strong piece of evidence that we should get back to requiring the tests rather than being afraid of them.

That is the best way to identify those kids out there who are the hidden Einsteins, the HALO kids, the kids coming from tough areas that still have a good chance of succeeding at these elite institutions.

David, what else?

David Griffith [30:46]

Yeah, I mean, I think you mostly covered it.

There are so many different dimensions here that it’s a little hard to pull out one story. But the one I guess I would talk about is the one that you were saying there at the end, which is: Accurate information is ultimately a good way to fight bias.

Or at least to me, if there’s a single story here, that’s what it is.

You’ve got kids who are from disadvantaged high schools where the default expectation is that they’re not ready for an elite college. And, you know, you can yell and scream all you want. But at the end of the day, you understand where the college is coming from on that as they’re evaluating these kids.

If you’re going to require them to take tests and require test scores, ultimately, you are giving them a way to fight that perception, right? You’re giving the individual students a way to overcome that perception and distinguish themselves from the sort of stereotypical group averages.

And I think that’s a fairly general principle. I think in general, accurate information tends to promote outcomes that we would consider just, even if it doesn’t always get us all the way to the world that we want to live in, where everybody has equal opportunity.

I think in general, more information is good. It sort of helps individuals. And I think rather than kind of shooting the messenger, we should try to understand that he or she is providing a service.

So it seems like the tide is turning against test optional. And I feel like that’s a good thing.

Mike Petrilli

Yeah. And look, my understanding as I’ve studied this issue and now gone through it with one kid is, a lot of these elite schools are going to give a certain number of slots to a bunch of the elite high schools, especially the private schools, but also some of these high-flying public schools.

And you figure out pretty quickly that if you’re at one of those schools, or the parent of a child at one of those schools, the kids in that school are competing against each other. I mean, Dartmouth is going to only take a handful of kids from any given high school.

And so they’re going to try to determine who are the most qualified kids who also seem to indicate that they will say yes to Dartmouth if they get the offer. That’s the game.

It’s a completely different sort of tournament or game theory that’s going on for those high schools separately than saying, okay, then they reserve a bunch of other slots for the vast majority of high schools in the country. And how do they figure out how to fill those spots?

And I think what we’re learning here is that being able to look at test scores is super helpful and makes it likelier that you’re going to be able to identify some first-gen kids, some high-achieving, low-income kids.

We haven’t talked about race, Amber. Is it the case, as we’ve seen with some other studies, that when you actually say, okay, who are these high-achieving, low-income kids, they are often white students? Is that fair?

Amber Northern

It’s not what was reported. So I don’t want to put any words in these analysts’ mouths.

Mike Petrilli

Okay, they didn’t report race.

Amber Northern

They weren’t looking at race. Not that I saw.

Mike Petrilli

Oh, interesting.

Amber Northern

It may have been the appendix, Mike. I didn’t look.

Mike Petrilli

All right.

Well, I’m thinking of some other studies where there have been efforts. And I think there is evidence that it’s the lower-income white kids who, at least in the affirmative action days, lower-income white and high-achieving, that group of kids may have been harmed the most, as well as Asian kids, by the old-style affirmative action.

They were overlooked. They didn’t help the school with their targets in terms of race, and they weren’t able to pay, so they didn’t help in that way either.

And so it is interesting that some of these changes help maybe on the socioeconomic front. The colleges can be proud to say, hey, we’ve boosted the percentage of kids on Pell Grants and coming from low-income families and first-gen, whether or not it actually shifts the racial demographics.

Amber Northern

Makes sense.

Mike Petrilli

All righty. We will leave it there.

Thank you, Amber. You’re right. That was worth a return.

Amber Northern

That’s right. A replay.

Mike Petrilli

A replay.

All right. Hey, gang, that is all the time we’ve got for this week. So until next week.

David Griffith

I’m David Griffith.

Mike Petrilli

And I’m Mike Petrilli of the Thomas B. Fordham Institute, signing off.

The Education Gadfly Show is a production of the Thomas B. Fordham Institute, located in Washington, D.C. For more information, visit us online at FordhamInstitute.org.

Fordham Logo

© 2026 The Thomas B. Fordham Institute
Privacy Policy
Usage Agreement

National

P.O. Box 110
Burke, VA 22009

202.223.5452

[email protected]

Ohio

P.O. Box 82291
Columbus, OH 43202

614.223.1580

[email protected]

Sponsorship

130 West Second Street, Suite 410
Dayton, Ohio 45402

937.227.3368

[email protected]