Mobile Navigation

  • National
    • Policy
      • High Expectations
      • Quality Choices
      • Personalized Pathways
    • Research
    • Commentary
      • Gadfly Newsletter
      • Flypaper Blog
    • Events
    • Scholars Program
  • Ohio
    • Policy
      • Priorities
      • Media & Testimony
    • Research
    • Commentary
      • Ohio Education Gadfly Biweekly
      • Ohio Gadfly Daily
  • Charter Authorizing
    • Application
    • Sponsored Schools
    • Resources
  • About
    • Mission
    • Board
    • Staff
    • Career
Home
Home
Advancing Educational Excellence

Main Navigation

  • National
  • Ohio
  • Charter Authorizing
  • About

National Menu

  • Topics
    • Accountability & Testing
    • Advanced Education
    • Career & Technical Education
    • Charter Schools
    • Curriculum & Instruction
    • ESSA
    • Evidence-Based Learning
    • Facilities
    • Governance
    • Personalized Learning
    • Private School Choice
    • School Finance
    • Standards
    • Teachers & School Leaders
    • Think Again
  • Research
  • Commentary
    • Gadfly Newsletter
    • Flypaper Blog
    • Gadfly Podcast
  • Events
  • Scholars Program

The Education Gadfly Weekly

Sign Up to Receive Fordham Updates

We'll send you quality research, commentary, analysis, and news on the education issues you care about.
Thank you for signing up!
Please check your email to confirm the subscription.

The Education Gadfly Weekly: Beware the unintended consequences of state screen time limits

Volume 26, Number 16
4.23.2026
4.23.2026

The Education Gadfly Weekly: Beware the unintended consequences of state screen time limits

Volume 26, Number 16
view
Tablets
High Expectations

Beware the unintended consequences of school screen time limits

With school phone bans of various sorts now underway in 41 states and counting, debates on classroom screen time have shifted focus to the devices ostensibly being used for educational purposes: Chromebooks, iPads, and the like. In response to all the tech backlash, state policymakers are taking swift action, some of which is warranted, but much of which bears signs of legislative haste.

Meredith Coffey, Ph.D. 4.23.2026
NationalFlypaper

Beware the unintended consequences of school screen time limits

Meredith Coffey, Ph.D.
4.23.2026
Flypaper

Tony Bennett and the lost playbook of education reform

Dale Chu
4.23.2026
Flypaper

Why is Gen Z so anxious?

Jill Hoppe | Elainah Elkins
4.23.2026
Flypaper

Longer-term impacts of remote learning during the height of Covid

Jeff Murray
4.23.2026
Flypaper

Special education doesn’t just work—it reverses academic decline

Julia Hayes
4.23.2026
Flypaper

The “genome” of a great elementary school | Episode 1014 of The Education Gadfly Show

4.22.2026
Podcast
view
Classroom

Tony Bennett and the lost playbook of education reform

Dale Chu 4.23.2026
Flypaper
view
Anxious person

Why is Gen Z so anxious?

Jill Hoppe, Elainah Elkins 4.23.2026
Flypaper
view
School closed sign

Longer-term impacts of remote learning during the height of Covid

Jeff Murray 4.23.2026
Flypaper
view
Arrow

Special education doesn’t just work—it reverses academic decline

Julia Hayes 4.23.2026
Flypaper
view

The “genome” of a great elementary school | Episode 1014 of The Education Gadfly Show

Michael J. Petrilli, David Griffith, Ph.D., Amber M. Northern, Ph.D. 4.22.2026
Podcast
view
Tablets

Beware the unintended consequences of school screen time limits

Meredith Coffey, Ph.D.
4.23.2026
Flypaper

With school phone bans now underway in 41 states and counting, debates on classroom screen time have shifted focus to the devices ostensibly being used for educational purposes: Chromebooks, iPads, and the like. In response to all the tech backlash, state policymakers are taking swift action, some of which is warranted, but much of which bears signs of legislative haste.

While a recent West Virginia bill banning all K–3 “electronic devices” except for calculators didn’t make it out of committee, still moving forward are bans on K–5 “digital devices” in Kansas, South Carolina, and Tennessee. Their exceptions are limited to accommodations under IDEA (all three states), virtual schools (South Carolina and Tennessee), and state assessments (Tennessee only). Also for K–5, Missouri may soon mandate a maximum of 45 daily device minutes and Oklahoma one hour, both with exceptions only for IDEA. Kansas proposes time limits throughout the upper grades, too, with a 60-minute cap in middle school and a 90-minute cap in high school.

I’m no fan of unfettered screen time, but we should take these bills as a signal that the ed tech pendulum may be swinging back too far, too fast.

First, it’s unclear whether policymakers in these states have considered a swath of classroom realities. Many schools lack hard-copy versions of curricula and other materials. For example, evidence-based K–5 Amplify curricula—used in over 8,000 U.S. school districts for English language arts, math, and/or science—either encourage or require digital components. Where both print and digital versions of any curriculum are available, it’s typically cheaper to purchase digital versions. So will districts and schools be able to afford hard-copy versions? Will they be able to obtain materials soon enough to comply with the rapidly approaching effective dates (e.g., July 1, 2026, in Oklahoma and Tennessee)? Will they be able to adequately support teachers modifying their instructional methods so dramatically? Will states and districts have capacity to pivot to pen-and-paper screeners and assessments, and if they can’t, how will they equip students when they do encounter such digital tasks? (Or, as some reformers fear, will device bans become a means for undermining state testing?)

What’s more, arbitrarily limiting the quantity of screen time does absolutely nothing for the quality of the screen time. A nine-year-old playing Roblox at school is a problem, whether for 55 minutes or 65. On the other hand, a nine-year-old learning coding, online safety, and early research skills shouldn’t necessarily be subject to inflexible time limits.

It’s unclear how exactly states would plan to monitor or enforce these restrictions, anyway. Missouri’s bill includes school-level reporting requirements around student device-use minutes and digital and print products used. That’s pretty minimal, yet it’s the only such bill I’ve seen that offers anything akin to an accountability mechanism.

At first glance, new opt-out proposals from Iowa, Rhode Island, and Vermont might seem more measured, as they would merely permit caregivers to opt their children out of school device usage. As some Vermonters have noted, however, such a policy would almost assuredly lead to classrooms divided between device and non-device users. Would teachers really be able to support both groups simultaneously and effectively? Would districts and schools be able to obtain appropriate materials to support both groups? What are the implications for materials and instruction if parents opt in or out mid-year?

The situation isn’t hopeless; there are also some promising plans out there. Though I’m wary of Iowa’s and Rhode Island’s opt-out permissions, their legislation—along with Utah’s newly-passed law—reflect valuable steps toward improving the quality of school screen time, not simply restricting the quantity. Among the highlights from these three states are provisions on:

  • Computer science: Iowa and Utah both specify that computer science doesn’t count toward their device minute limits. Even better, Utah’s state board must adopt computer science standards, including AI standards. Such stipulations aim to ensure that limits on device time don’t come at the expense of essential digital literacy instruction from an early age.

  • Safety of devices: All three states have suggested more stringent requirements for the devices students are using, including guidelines around student privacy. Capping student device use at a certain number of minutes doesn’t keep students safe; ensuring personal data security, disabling cameras, and blocking social media will help.

  • Value of ed tech tools: Rhode Island and Utah both establish criteria for ed tech tools, such as alignment with curricula and evidence of effectiveness. And, in perhaps the first state policy of its kind, Rhode Island would require all ed tech tool providers to register with the state’s attorney general, much like other consumer service providers in many states. This move would help pave the way toward greater transparency and accountability.

Too much low-quality school screen time is a real problem for students’ academic growth, social development, and digital safety. But coarse limits and outright bans on devices risk too many unintended consequences. They may be at odds with required curricula. Mandates that emphasize quantity over quality don’t make screen time any more purposeful or safer. And all students deserve digital skills instruction from the early grades; not providing any will translate into students with fewer resources outside of school facing yet another disadvantage compared to peers.

Education advocates are right to call out excessive screen time at school, but state leaders should take a beat before forging ahead with one-size-fits-all policies. States could, for example, wait to see results from the districts implementing screen time restrictions, like those that LAUSD’s board passed just this week. The steps states take will shape millions of children’s early exposure to technology. Legislation should be informed, practical, and optimally designed to support all students—not rushed.

view
Classroom

Tony Bennett and the lost playbook of education reform

Dale Chu
4.23.2026
Flypaper

Fifteen years have passed since Indiana took home the Fordham Institute’s “Education Reform Idol” crown, a recognition earned through a sweeping set of reforms that included an overhaul of teacher evaluation, an expansion of school choice, and major changes to collective bargaining. It feels like a lifetime ago, back when bipartisan education reform still had real momentum. That era came back into sharp relief for me while reading a recent Johns Hopkins University interview with my former boss and longtime friend Tony Bennett, who led education in Indiana and later Florida. Conducted by Jonathan Plucker, their conversation finds Bennett candid and clear-eyed about both the successes and shortcomings of that period. What stands out most, looking back, isn’t just how much reform happened, but how it happened—and how different that approach looks from the way reform is pursued today.

It wasn’t just a different political moment. It was a different theory of change. Education reform today is often myopic in comparison, in the sense that it organizes improvement around discrete levers that are expected to produce results largely on their own. A new reading law becomes shorthand for reading improvement. Private school choice stands in for systemwide change. Math instruction is treated as the primary pathway to stronger outcomes. What gets lost is the degree to which these levers depend on broader conditions (e.g., standards, capacity, accountability, execution) for their effects to materialize. This is not a universal pattern, and there are important exceptions (more on that below), but it reflects a gradual shift from comprehensive reform to piecemeal initiatives.

In the early 2010s, Indiana’s pursuit of education reform was not organized around any single policy. As Bennett describes it, the approach was explicitly coordinated across several fronts:

Our strategy was to pass all [of our reform] bills at once. This would force our opponents to oppose all of them so we could paint them as being for nothing and against everything. I worked with both House and Senate Caucuses and agreed to attend their town hall meetings, which were being flooded by angry teachers, to answer questions and take the wrath. This, along with the bully pulpit of Governor Daniels, gave them the cover they needed to pass [everything].

That effort was anchored by Bennett’s “90-25-90” goals: 90 percent of students passing the state test, 25 percent earning advanced credit or credentials, and 90 percent graduating from high school ready for college or career without remediation. Together, they defined what success meant in concrete terms and made the desired outcomes clear to one and all. No state had achieved them, and that ambition became an organizing force for everything that followed.

With these reforms codified into law and 90-25-90 as the North Star, the work shifted quickly from aspiration to implementation. It was propelled by a close relationship between Bennett and Governor Mitch Daniels, with the governor’s clout helping to recruit top talent to Indianapolis. An underlying sense of urgency, rooted in an understanding that there was a limited window to put the pieces into place, kept momentum from dissipating. Indiana’s agenda was a comprehensive one in which policy, people, and political will reinforced one another. The resulting academic gains were not the product of any single policy shift, but of a deliberate push across multiple areas—an approach that, over time, would prove difficult to sustain.

Important counterexamples remain today. Mississippi’s recent literacy gains, for instance, are often attributed to the science of reading, but closer analyses reveal a larger, coordinated effort spanning high expectations, curriculum guidance, teacher preparation, accountability, and sustained implementation support. And in Texas, the state’s data-driven education commissioner has treated accountability as a tool for driving managerial decisions that produce results. What distinguishes effective reform is whether those signals are paired with a system that turns them into action, along with leadership commitment and follow-through.

Bennett’s reflections are clarifying. One of the most widely cited concepts from that period is what he describes as “tight–loose–tight”: tight on goals, loose on means, tight again on accountability. It is a deceptively simple framework that depends on discipline at every stage. Over time, however, that balance has been replaced by something closer to “loose–tight–loose”: loose agreement on goals, tight constraints on implementation, and laissez-faire oversight on top—though in areas like curriculum, states like Mississippi and Texas have moved in the opposite direction, toward greater specificity and guidance. But an even deeper concern lies in how systems behave in practice. As Bennett notes:

[There were so many] times…when we asked districts, schools, and leaders to provide us specific and clear “red tape” that we could remove to make their jobs easier. We literally asked that question every year, and without fail, we not only got no real answers, but we also received reasons we should not remove that red tape.

Even when given the opportunity to reduce unnecessary constraints, practitioners chose to defend them rather than eliminate them.

This gets at the core tension in efforts to “return education to the states,” which assume that shifting authority downward will automatically improve outcomes. But systems shaped by decades of externally imposed rules, procedures, and oversight do not become more effective simply because that oversight is removed. Many reform efforts underdeliver because they rely on discrete levers rather than a comprehensive approach and assume that devolution alone will solve for execution.

Indiana’s reform idol victory feels today like an artifact of a bygone era, one that is unlikely to return anytime soon. Even so, one of the more counterintuitive reflections from Bennett is that the surface conditions for reform may be more favorable today than they were 15 years ago, particularly in red states. Choice enjoys broader public support, literacy policy is on stronger footing, and the level of personal vitriol directed at state chiefs appears to have diminished. Yet that improvement in climate has not translated into stronger academic performance. The explanation lies less in the atmospherics than in how reform is put together. Among the lessons from Bennett’s tenure, the most important for reformers today is that lasting improvement depends less on individual reforms than on whether they are part of a coherent whole. The challenge, as Bennett’s experience suggests, is sustaining that coherence over time.

view
Anxious person

Why is Gen Z so anxious?

Jill Hoppe | Elainah Elkins
4.23.2026
Flypaper

Editor’s note: This is the first in a three-part series written by Elainah Elkins and Jill Hoppe, born in 1999 and 2000, respectively. There is growing discourse surrounding Gen Z, but the voices of Gen Zers themselves are often missing from the conversation. This is their response.

Do you remember New Year’s Eve 2000, when people weren’t sure if the world was going to end? We don’t. We’ve heard the stories, of course, but Elainah was too young to remember, and Jill wasn’t even born until August of that year. We are part of Generation Z, more commonly known as Gen Z, defined as those born between 1997 and 2012.

Nearly every day, we see a new headline criticizing what is “wrong” with Gen Z. “Gen Z is dating less. The result is one of the most unprepared workforces,” “Gen Z has ‘workplace anxiety’. Here’s what employers need to do,” and “Gen Z is the loneliest generation. Here’s what can help.” The message is consistent: Something about our generation is off.

Of course, this kind of narrative is not new. Every generation has been critiqued by the one before it—Gen Xers were labeled as slackers and millennials were viewed as entitled. Though the phrase “kids these days” has persisted forever, the intensity of these critiques feels different now, and data confirm that Gen Z’s work ethic is vastly different than the generations before it.

While some of the critiques about Gen Z feel exaggerated, others are somewhat grounded in reality. Most tend to fall into three broad categories: we struggle with mental health and interpersonal connection, we are overdependent on technology, and we are unprepared for the workforce.

But these critiques rarely ask a more important question: Why?

To understand Gen Z, you have to look at the systems and experiences that shaped us, including school. As members of the older end of this cohort, we recognize that our experiences may differ from those of younger Gen Zers, especially those just now entering high school. Still, we believe that our personal reflections will help illuminate the broader trends many young adults have experienced.

This post will focus on the first of these claims, the struggle with mental health and connection, and explore how and why Gen Zers came to be this way.

Test-taking culture contributed to an anxious learning environment

The signing of No Child Left Behind (NCLB) in 2002 marked a turning point in U.S. education. Driven by concerns over widening achievement gaps and fears that the country was falling behind globally, NCLB expanded the federal government’s role in education and ushered in an era of accountability and standardized testing.

By the time we entered elementary school in the late 2000s, this approach was deeply embedded in day-to-day classroom life. Jill’s experience with the New England Common Assessment Program (NECAP) and Elainah’s experience with Virginia’s Standards of Learning (SOLs) reflect how widespread and integral testing had become. Like many students of our generation, we began taking standardized tests around age eight, in a peak NCLB culture when performance on those exams was often treated as the primary measure of success.

Though we grew up in different states, our recollections of standardized testing share striking similarities. Regardless of how confident we felt about our test performance, schools drastically increased the stakes by entirely transforming classrooms and policies for test day. Desks were spaced evenly apart and makeshift dividers made from folders and binders created an environment reminiscent of a voting booth. Students waited in line at the pencil sharpener to ensure their two (in case one broke) No. 2 pencils were perfectly prepared. Even bathroom breaks were tightly controlled, requiring a teacher to escort us to prevent any possibility of cheating. You also weren’t allowed to ask for help of any sort, including asking for help sounding out a word you might not know.

Most teachers spent the entire year discussing the end-of-year test. There was no learning that didn’t reflect something that we’d be tested on, and it was instilled that whatever we learned was for the sake of performing well on the end of year test. In fact, after the passage of NCLB, 44 percent of school administrators confessed to cutting physical education and recess to focus on test prep. To be clear, the tests themselves weren’t the issue so much as the high-stakes test-taking culture. The culture communicated, implicitly and explicitly, that performance on the test was what mattered most.

Research from the NCLB era supports this experience. In one of the first studies specifically examining elementary students’ responses to high-stakes testing under NCLB, researchers found that children reported significantly higher levels of anxiety during standardized tests than during typical classroom assessments, including both emotional stress and physical symptoms like nervousness and tension. Moreover, a 2019 study found that, on average, students had 15 percent more cortisol (a hormonal indicator of stress) in their systems during the homeroom period before a standardized test than on days with no high-stakes testing. A significant amount of anecdotal evidence from scholars and former teachers and administrators confirms these experiences, as well.

Growing up in this education environment likely contributed to a stronger sense of perfectionism for many of us, fueled by stress, anxiety, and a heightened awareness of evaluation. While these traits are not unique to Gen Z, the systems we experienced may have reinforced them in ways that shaped how we approach risk, failure, and uncertainty.

School aren’t safe

Schools were not only a place that came with academic pressure, as concerns about school safety became an ever-present part of Gen Z’s educational experience.

The Columbine High School shooting in 1999, in which 12 students and one teacher were killed, marked a turning point in how Americans understood school safety, signaling that schools were no longer immune from gun violence. More than a decade later, when we were 12 and 13, the Sandy Hook Elementary School shooting, where 20 young children and six educators were killed, underscored this reality, bringing the fear of school violence into even the earliest years of education.

In the years since these pivotal tragedies, gun violence has become an increasingly visible backdrop of our upbringing. We grew up in schools where lockdown drills became routine: doors locked, blinds drawn, students huddled together in corners or by cubbies. We learned where to go, how to stay silent, and how to respond, often before we were old enough to fully understand why these precautions were necessary. In this context, it should not be difficult to understand a contributing factor to why we are “so anxious,” and multiple studies confirm this. Gen Z is the first generation to grow up with the constant looming possibility of gun violence as a defining feature of education.

The pandemic disrupted socializing

We must also acknowledge the impact of the Covid-19 pandemic on Gen Z’s mental health and ability to connect. How it affected Gen Z can vary significantly across different ages, but whether it was during college (as for us) or middle school, Covid disrupted education for nearly all Gen Zers.

The shift to remote learning and virtual interaction fundamentally changed how young people build relationships—with peers, teachers, and institutions. For many, connection became mediated through screens, making it harder to form social bonds and a sense of belonging that schools and universities typically provide. At the same time, rates of anxiety, depression, and other mental health challenges rose sharply, as isolation, uncertainty, and disruption took their toll on developing brains.

These experiences also drastically altered how students show up to school. In many cases, this has translated into higher rates of chronic absenteeism, not simply as a matter of logistics, but as a reflection of deeper disengagement. When students feel disconnected, overwhelmed, or unsupported, showing up, both physically or mentally, becomes that much harder.

* * *

So where do we go from here? If Gen Z’s challenges are, in part, a product of the systems we moved through, then schools have an opportunity—and a responsibility—to respond differently moving forward. That does not mean abandoning accountability, rigor, or high expectations, but it does mean rethinking how those priorities show up in students’ daily experiences.

First, schools should consider the role of assessments. While end-of-year tests and other assessments remain necessary, how teachers and schools talk about these tests to students and integrate them into their classrooms can change. While standardized scores do not typically carry direct consequences for students until high school, the tests did carry consequences for schools, districts and teachers. School ratings, public report cards, state interventions, and teacher evaluations and effectiveness are often all tied to test scores. When everything feels high-stakes, it often trickles down to the students, who learn to equate their worth with performance. Prioritizing growth is a key way to reduce the implications these tests have on the system. Revision, feedback, engagement, and learning for the sake of learning can also help rebuild a culture where learning is the main goal. Students need opportunities to take risks without fear that a single assessment will define them.

Second, school safety requires outside policy intervention, but schools can make small efforts to help their students. For example, access to school-based mental health professionals can help ensure students receive support consistently, rather than only in moments of crisis. At the same time, schools should actively include student voices in decisions about safety policies and practices, including rethinking how drills might be impacting student mental health. Finally, educators and school staff must feel equipped and supported with the training and resources needed not only to respond to emergencies, but to recognize warning signs.

Lastly, connection has to be treated as foundational, not some sort of “extra.” The disruption of the pandemic made clear how essential relationships are to learning. Re-engagement efforts, especially in response to chronic absenteeism, must go beyond compliance. If disengagement is rooted in disconnection, then solutions have to focus on rebuilding trust and community. Many schools have already begun to tackle this, engaging in creative efforts like creating tasks force that do home visits, or providing gas cards or other incentives to encourage attendance. Solutions should also include considering how to get students involved in extracurricular activities, especially prior to high school. 

None of this is simple, and none of it is quick. But if we want to better understand Gen Z—and support the generations coming after us—we have to move beyond asking what’s “wrong” with students and start examining what they’ve been asked to navigate. The path forward begins there.

Next in this series we will turn to two other forces shaping our generation: the role of technology in how we learn and interact and the growing disconnect between how we were educated and what the workforce expects.


view
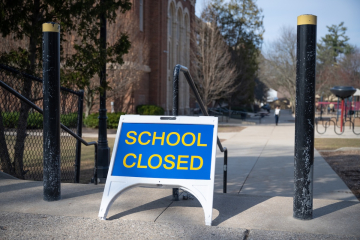
School closed sign

Longer-term impacts of remote learning during the height of Covid

Jeff Murray
4.23.2026
Flypaper

It’s been six years since the Covid-19 pandemic began disrupting education, and a varying number of years since schools returned to “normal,” but data charting the numerous negative impacts on students keep coming. Two recently-published reports separately focus on attendance and math achievement.

First up is Jeremy Singer, a researcher from the University of Michigan-Flint, looking at post-pandemic student attendance trends as a function of how much remote learning a student experienced during Covid disruptions. Absenteeism increased during the two most-impacted Covid years, and overall, remains higher today than in pre-Covid years.

Singer uses data from Michigan covering every public school in the state during the 2020–21 school year. Schools were required to report their current learning modality (fully in-person, fully online, or a mix/option of the two) to the state every month. Singer created a measure of remote learning duration to which more than 992,000 students were exposed in 2020–21 and tracked their attendance from the 2017–18 through the 2023–24 school years—a total of more than 5,100,000 observations. He then tested the differential impact of remote learning exposure via both difference-in-differences and instrumental variable analyses. Neither set of findings is causal because exposure to remote learning was not random (and was often an affirmative parental choice), but they correlate strongly with each other.

The topline finding is that the longer students experienced remote learning in their schools, the worse their post-pandemic attendance was when compared to pre-pandemic patterns. Yet the impacts were not linear. Compared to students who were never provided with remote-only learning in 2020–21, students provided with remote-only learning for one, two, or three months had no statistically-significant decline in attendance post-pandemic; those with remote-only learning for four, five, or six months subsequently missed a few additional days of school; and those with remote-only learning for seven, eight, or nine months missed substantially more. Consistent with other data, negative impacts were strongest for Michigan students in 2021–22 and 2022–23, although they were still seen at a statically-significant level well into the 2023–24 school year among those with the most exposure to remote-only learning.

Given these findings—and the fact that more than 80 percent of Michigan students were in the low-exposure category—current absenteeism woes in the state can’t be neatly pinned on Covid-era remote learning. And generalizability beyond the Michigan context is also unclear. In fact, Singer suggests that his findings might say as much about the quality of the “cure” (absenteeism-mitigation strategies implemented in the wake of shocking early data) as they do about the strength of the “disease” of remote learning itself.

And what of academic outcomes impacted by Covid-era instructional modality changes? A pair of researchers from the University of Western Ontario examine the ways in which math course-taking among high schoolers in Massachusetts changed in 2020–21, including the extent of exposure to remote learning.

Their dataset comprises more than 327,500 unique students who were in grades 9 or 10 in the 2016–17 through 2019–20 school years, and who transitioned into grades 10 or 11 in 2017–18 through 2020–21—a total of more than half a million student-year records. The choice of grades is deliberate to (a) avoid the first year of high school, often a tricky transition generally; and (b) maximize the evidence of students’ progression (or not) through a typical high school course sequence from basic math to Algebra I and II to geometry to pre-calculus and beyond. Data from the Massachusetts Department of Elementary and Secondary Education comprised a detailed transcript for each student, including math classes attended, completion (or not), and academic performance therein. Instructional modality changes during the 2020–21 school year were tracked similarly to the Singer study above, using the Bay State’s contemporaneous school survey data.

The researchers find that overall rates of advancement for students (that is, taking a higher-level math course in one year compared to the prior one) decreased during the 2020–21 school year, with stronger negative impacts seen among students who spent a greater share of the year in remote-only instruction mode.

Students in grade 10 in 2019–20 slightly decreased the rate at which they advanced in math and markedly increased the rate of repeating their grade 9 math class, as compared to pre-pandemic trends. In 2020–21, these patterns were even stronger. Just 65 percent of students who spent all or nearly all of the school year in remote instruction took a higher-level math course in grade 10 than in grade 9. Those high-exposure grade 10 students were much more likely than their in-person peers to take a course below their grade level (meaning Algebra I or lower), to receive lower marks in whatever math course they took, and to fail or withdraw from a math course. Students in grade 11 showed a similar pattern of impacts. Economically disadvantaged, Black, and Hispanic students fared worse across the board than their White and Asian peers. The researchers ran additional multilevel logistic regression models to attempt to account for some student- and school-level factors. While, the randomness of exposure to remote learning does not allow their efforts to produce causal findings, all analyses showed similar patterns.

The math report concludes by pointing out that halted progress during a course sequence—for any reason—tends to stop students from building upon math knowledge, rendering future progress unlikely or at least very difficult. That’s a particularly chilling prospect given that the Massachusetts students in question long ago left high school, many with the assistance of lowered graduation requirements implemented during Covid, making whatever damage has been done to their math learning solely their problem to deal with.

The attendance report does not discuss differential impacts based on grade level, but the same holds true regardless: Whatever damage was done by students’ exposure to remote learning in 2020–21 (and indeed whatever benefit of mitigation they may have experienced afterward), all of it was cemented in when they graduated. For Covid-impacted students who have not yet graduated, their schools owe it to them to learn from the continuing stream of data documenting harm and to triple down to alleviate it in whatever time remains—focusing solidly on those kids who experienced the most remote-only learning.

SOURCES: Jeremy Singer, “Remote Learning in 2020-21 and Student Attendance Since the COVID-19 Pandemic,” EdWorkingPaper, Annenberg Institute at Brown University (January 2026); and Patrick Denice and Shahar Dangur-Levy, “Math coursetaking trajectories in high school during the COVID-19 disruptions to schooling,” EdWorkingPaper, Annenberg Institute at Brown University (March 2026).

view
Arrow

Special education doesn’t just work—it reverses academic decline

Julia Hayes
4.23.2026
Flypaper

Approximately 7.5 million U.S. students receive special education services in public schools—more than one in seven pupils nationwide. Its services cost roughly twice as much per pupil as general education and account for about one-third of federal appropriations for elementary and secondary education. Despite its scale, there has long been uncertainty about special education’s causal impact on student outcomes due to selection bias and methodological challenges. A new working paper from Boston University’s Wheelock Center (2026) helps fill this gap by applying rigorous causal methods to longitudinal administrative data to examine the impact of special education classification on student learning and educational progress.

The researchers used data on public school students in grades 3–8 from three states: Massachusetts, Indiana, and Connecticut. The analysis focuses on students first classified in grades 3–8 and primarily examines common disability categories such as specific learning disabilities, other health impairments, emotional disturbance, and speech or language impairments, rather than students with the most significant cognitive disabilities. The Indiana data spanned the 2011–12 through 2017–18 school years; the Connecticut data spanned the 2013–14 through 2019–20 school years; and the Massachusetts data spanned the 2007–08 through 2017–18 school years. Each data system used unique student identifiers to track students over time, and student demographic characteristics such as race/ethnicity, gender, and free or reduced-price lunch eligibility were observed in each state. The researchers employed an event-study design, comparing students to themselves before and after their special education classification, supplemented by a difference-in-differences approach that leveraged variation in the timing of classification.

The study revealed several notable findings. Most importantly, across all three states, students’ achievement trajectories declined prior to special education classification and rose sharply after they began receiving special education services. Gains in standardized math and English language arts test scores reached approximately 0.2 to 0.4 standard deviations within three years, suggesting substantial effects on learning. These effects were similar across disability types and student demographics. Taken together, this pattern suggests that special education services do not merely support students at a fixed level of performance, but instead help reverse ongoing academic decline.

Additionally, student gains did not occur all at once but increased over multiple years. This gradual pattern was consistent with sustained improvements in underlying skill development rather than short-term test score gains. The findings indicate that special education enhances the productivity of instruction over time, not just short-term performance.

The researchers also found that the benefits of these services were broad and not driven by testing accommodations. While critics have argued that accommodations create unfair advantages for high test scores, the evidence suggests otherwise. In Massachusetts—where data on testing accommodations are available—the researchers controlled for supports such as read-aloud and calculator use and found that the estimated gains remained nearly unchanged. This indicates that students demonstrated real improvements in learning, not just higher scores due to testing supports.

Importantly, the study’s methodological approach yielded more credible estimates than prior research by better accounting for pre-existing declines in student achievement. Traditional methods underestimated the relationship between these, potentially understating the effects of special education. By accounting for these trends in using the event-study design, the researchers were able to isolate the causal impact of special education services and show meaningful gains following classification.

Overall, these findings suggest that special education can produce meaningful learning gains when instruction and supports are tailored to students’ needs. However, because the study focuses on students identified in grades 3–8, the results may not generalize to students identified earlier. And while the analysis demonstrates substantial learning gains, it does not examine the costs relative to these benefits, leaving open questions about the return on investment. As a working paper, the findings would benefit from further peer review and replication, given mixed evidence in prior research.

From a policy perspective, the results suggest the importance of accurate and timely identification, expanded access to high-quality services, and more consistent service delivery so that qualifying students can benefit from these supports. At the same time, policymakers should recognize ongoing concerns about both over- and under-identification across student groups, including the possibility that some students who could benefit from services are not being identified.

SOURCE: Stephanie Coffey, Joshua Goodman, Amy Ellen Schwartz, Leanna Stiefel, Marcus A. Winters, and Yunee H. Yoon, “Special Education Substantially Improves Learning: Evidence from Three States,” Boston University, Wheelock Educational Policy Center (2026).

view

The “genome” of a great elementary school | Episode 1014 of The Education Gadfly Show

4.22.2026
Podcast
 

On this week’s solo episode, Mike Petrilli explores a big question: What would it look like to define an evidence-based model for American elementary schools—and could AI help us get there? Drawing on his long view of school reform, he considers what most schools have in common, where they fall short, and whether a clearer, research-backed playbook could improve outcomes at scale.

This is a work-in-progress idea, and Mike wants your feedback. Share your thoughts at mpetrilli [at] fordhaminstitute [dot]org.

Then on the Research Minute, Amber Northern examines new evidence on special education, finding that after students are identified for services, their achievement rebounds significantly—suggesting that individualized supports may boost learning more than previously understood.

Recommended content: 

  • Both/and on test scores & school inspections —Michael J. Petrilli, SCHOOLED
  • Follow the Science to School: Evidence-based Practices for Elementary Education— Michael J. Petrilli, Kathleen Carroll, and Barbara Davidson
  • An ode to elementary schools —Michael J. Petrilli, Thomas B. Fordham Institute
  • Special education doesn’t just work—it reverses academic decline —Julia Hayes, Thomas B. Fordham Institute
  • Special Education Substantially Improves Learning: Evidence from Three States —Stephanie G. Coffey, Joshua Goodman, Amy Ellen Schwartz, Leanna Stiefel, Marcus A. Winters and Yunee H. Yoon, NBER (2026)

Feedback Welcome: Have ideas for improving our show? We would love to hear them. Send them to [email protected]

Fordham Logo

© 2026 The Thomas B. Fordham Institute
Privacy Policy
Usage Agreement

National

P.O. Box 110
Burke, VA 22009

202.223.5452

[email protected]

Ohio

P.O. Box 82291
Columbus, OH 43202

614.223.1580

[email protected]

Sponsorship

130 West Second Street, Suite 410
Dayton, Ohio 45402

937.227.3368

[email protected]