
I read Mike Petrilli’s very interesting article “How to narrow the excellence gap in early elementary school” in Fordham’s June 2 Education Gadfly Weekly. He observes that “...many more Black and low-income students are achieving at high levels in kindergarten, especially in reading, than in later years. This indicates that something is causing the excellence gap to widen in the early years of elementary school. (Other achievement gaps tend to grow during these early years, as well.)”
I have been studying the achievement gap for many years using various data sources, beginning with the Coleman Report data in the mid-sixties and more recently with a number of statewide databases. In my experience, and from the data I have examined, the Black-White achievement gap remains fairly constant from third grade through the end of middle school (eighth grade). The gap issue is less clear for the high school grades, since most statewide achievement testing programs do not test all of the high school years.
The charts below show achievement scores for two states, one in the Border South for the year 2012 and one in the South for the years 1999 to 2005. For the Border South state in figures 1–3, achievement scores are designed to reflect academic growth between grades three and eight. This state also has achievement scores for first grade and eleventh grade, but they are not calibrated to show growth (relative to grade three to eight scores). For the South state in Figure 4, tests are normed to equal the same mean and standard deviation for each grade three to eight.
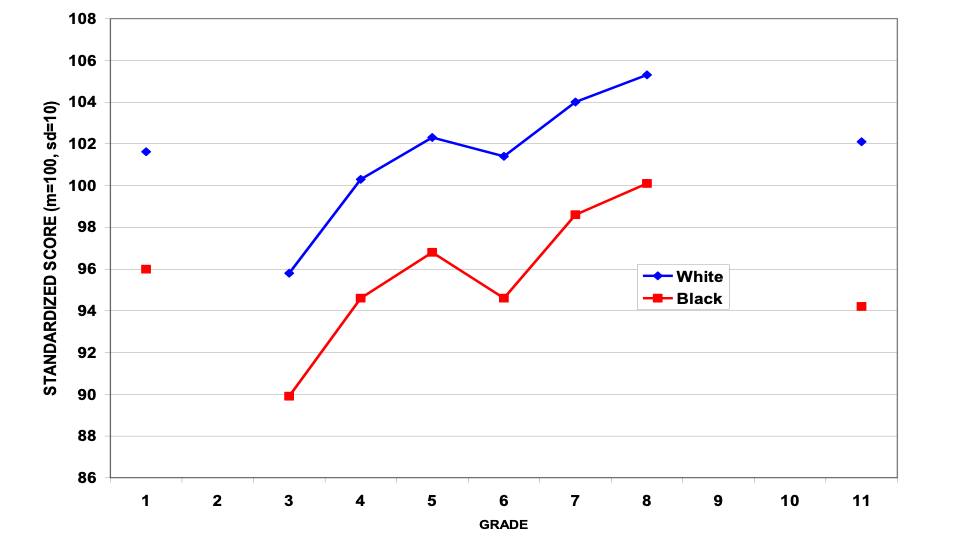
Figure 1 shows mean reading scores for grades one, three to eight, and eleven. The scores have been standardized to have a mean of 100 and standard deviation of 10. The Black-White reading gap is about 0.6 SD’s in grade one, and it is very close to 0.6 in grades three through grade eight. The gap widens somewhat to 0.8 in eleventh grade.
Figure 1. Statewide reading scores for Black and White students, 2012
The Petrilli article was focused on “excellence,” and his examples refer to the highest scoring category on NAEP, which is “Advanced.” Although state achievement testing can use different terminology, in this state they use the same four levels as NAEP—Advanced, Proficient, Basic, and Below Basic—for all tested grades except first grade. Figure 2 shows the percent scoring “Advanced” in reading proficiency on the state reading exam for grades three to eight and grade eleven. The gap starts out at 24 percentage points in grade three, widens slightly to 27 points in grades four to six, then narrows slightly to 25 points in grades seven and eight. In grade eleven, the excellence gap narrows significantly to 19, which is a positive result.
Figure 2. Statewide percentage of Advanced proficiency for Black and White students, 2012
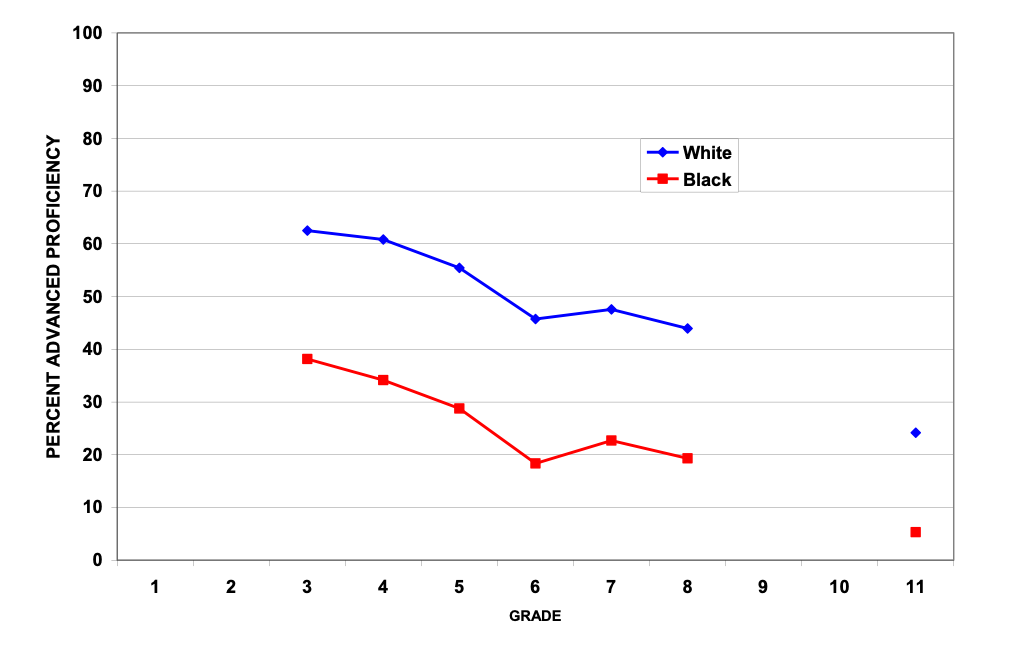
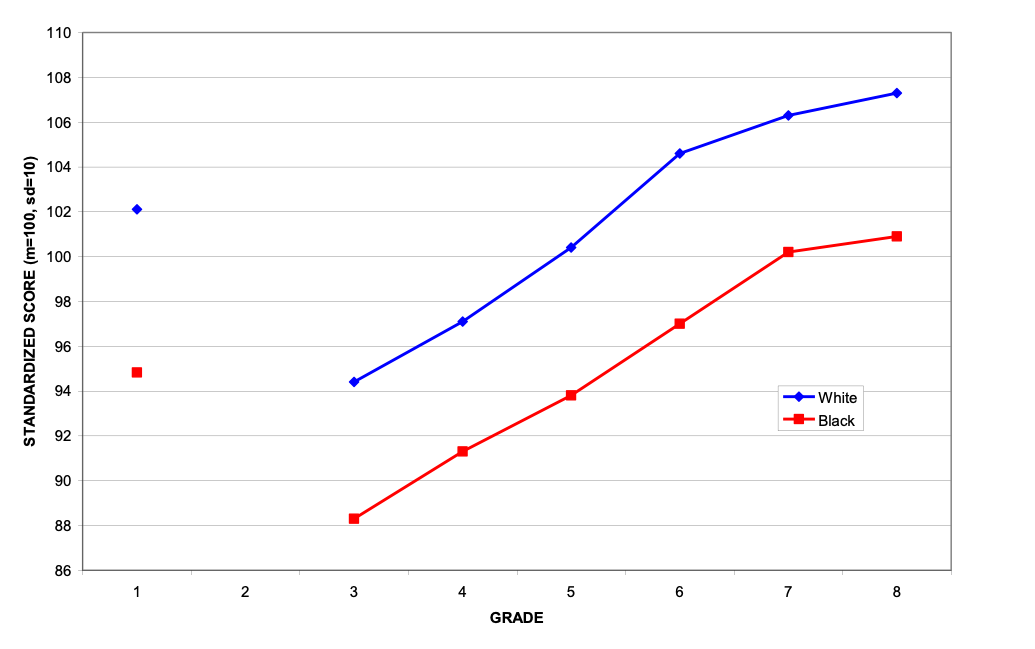
Figure 3 shows the gap for average math achievement for grade one and grades three to eight in the Border South state. Again, we see a relatively constant gap of 0.7 SD’s for grade one and approximately 0.6 for grades three to eight, although it does widen to nearly 0.8 for grade six. A single math achievement score is not available for high school grades because math courses diverge into separate subject matters, such as algebra, geometry, and trigonometry.
Figure 3. Statewide math scores for Black and White students, 2012
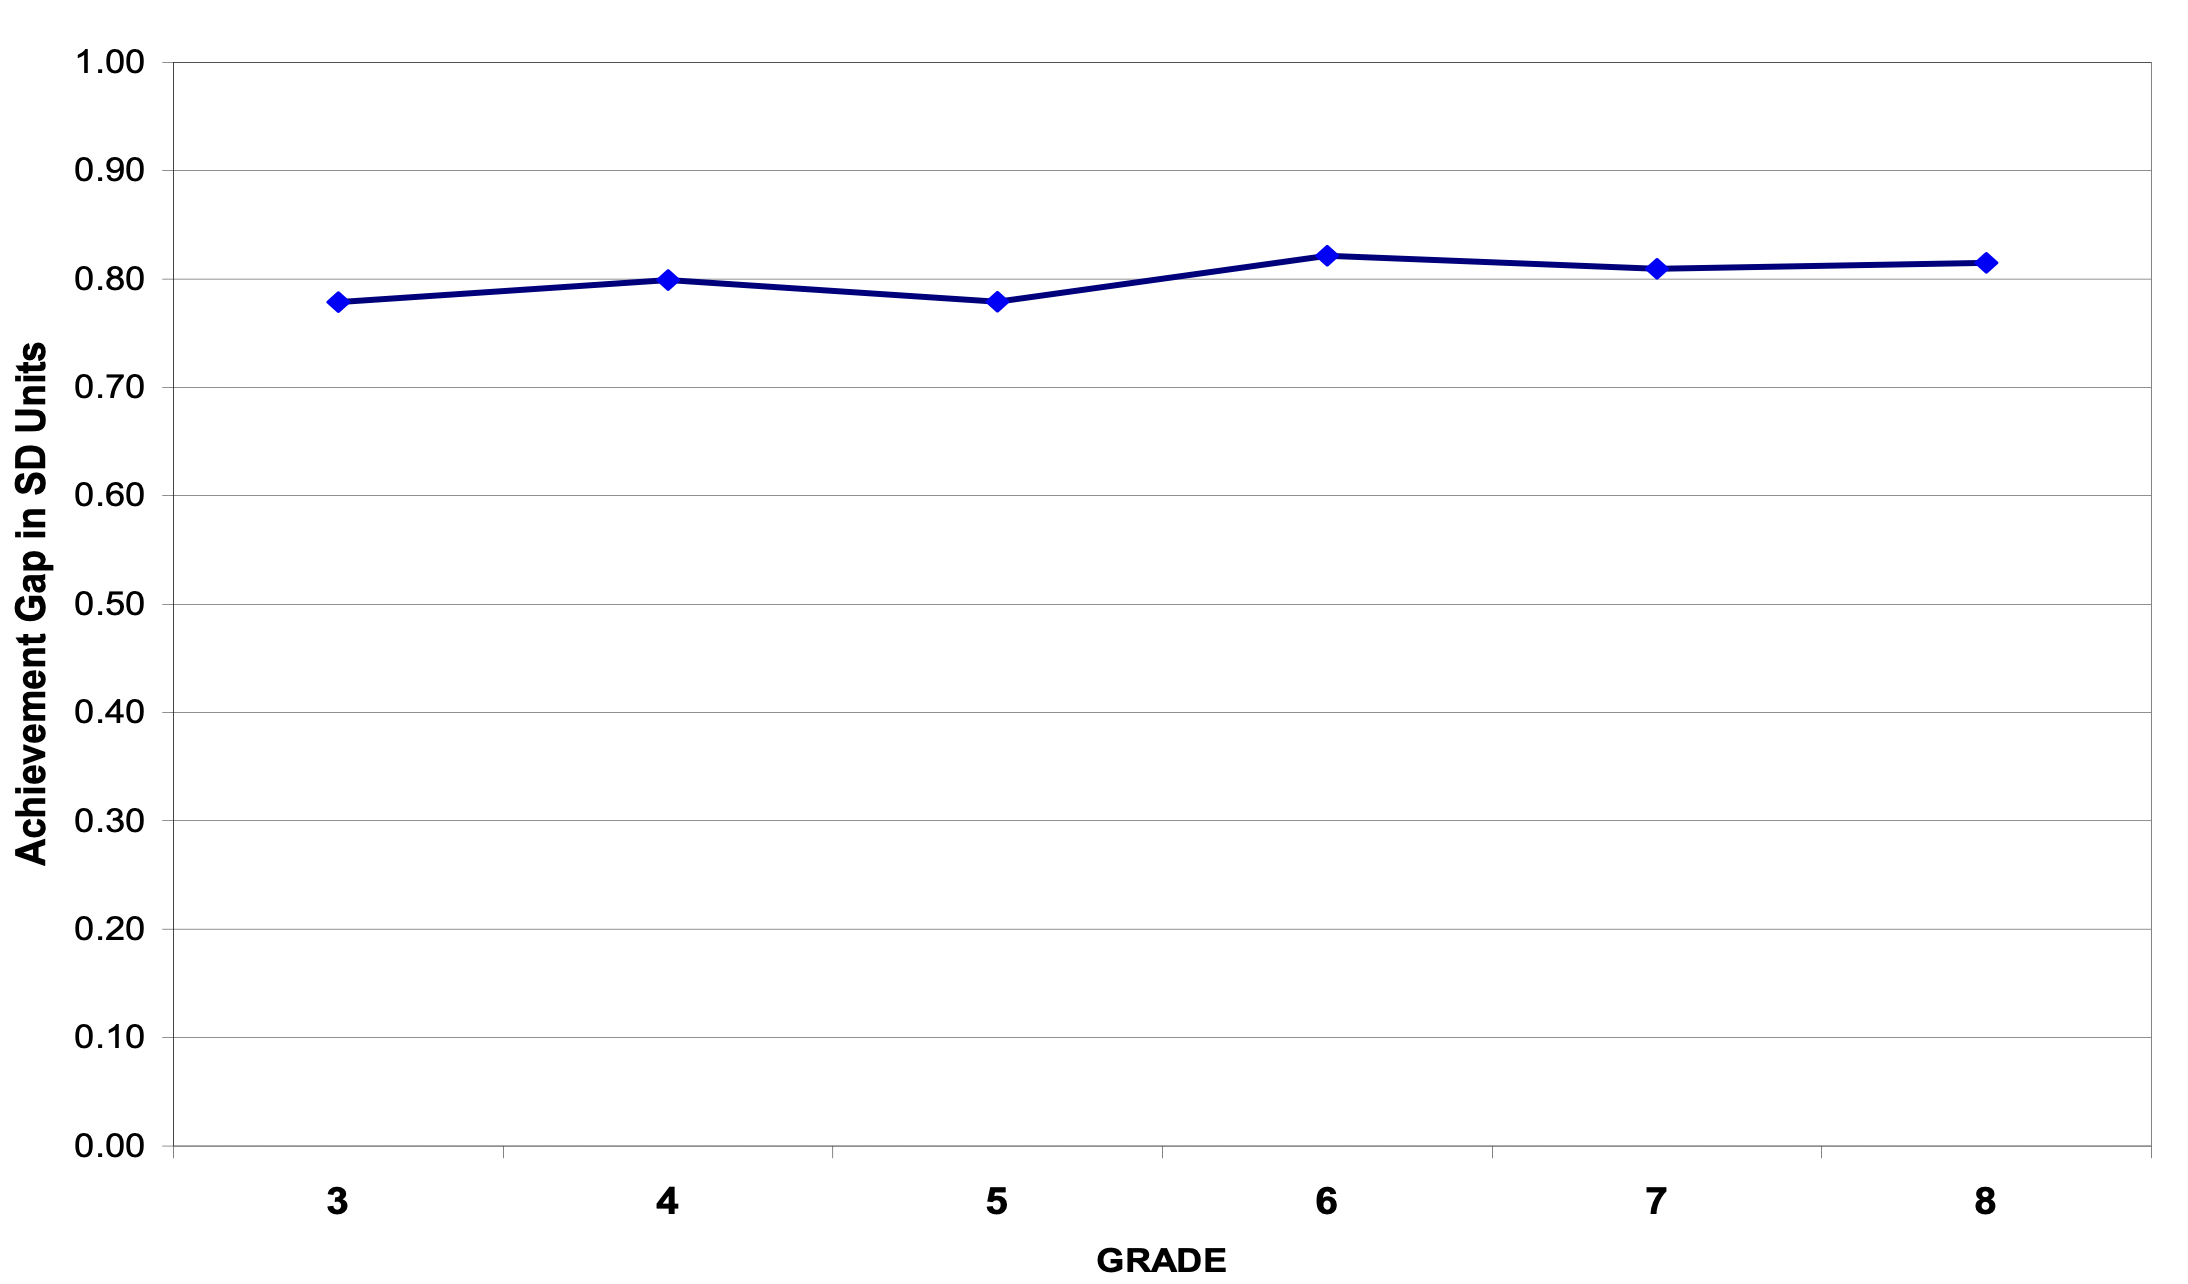
Finally, Figure 4 shows the statewide math achievement gap for Black and White students in a large southern state. Here the gap is a little larger, averaging about 0.8 standard deviations for all grades, but it varies only slightly from one grade to the next. The smaller variation may be due to the fact that these data follow the same cohort as the cohort ages from grade three to grade eight.
Figure 4. Statewide math scores for Black and White students, 1999 grade thee to 2005 grade eight
At least in these two states, achievement gaps do not change appreciably over the school years. On the one hand, this is good news for those concerned about schools making the achievement gap worse. On the other hand, it does not appear to shrink, either, which should motivate policy leaders to find methods that can help close the gap. Since many different school reforms have not had much impact on achievement gaps, successful policies may well have to take place before schooling starts, since the gap exists before children start school.