
Editor’s note: This is part two in a series of posts on school discipline disparities. For part one, see “Let’s talk about discipline and disparate impact (again).”
Let’s consider a thought experiment: If discipline disparities really were driven primarily by bias and systemic racism, we would expect to see the largest disparities in states with the most regressive racial attitudes.
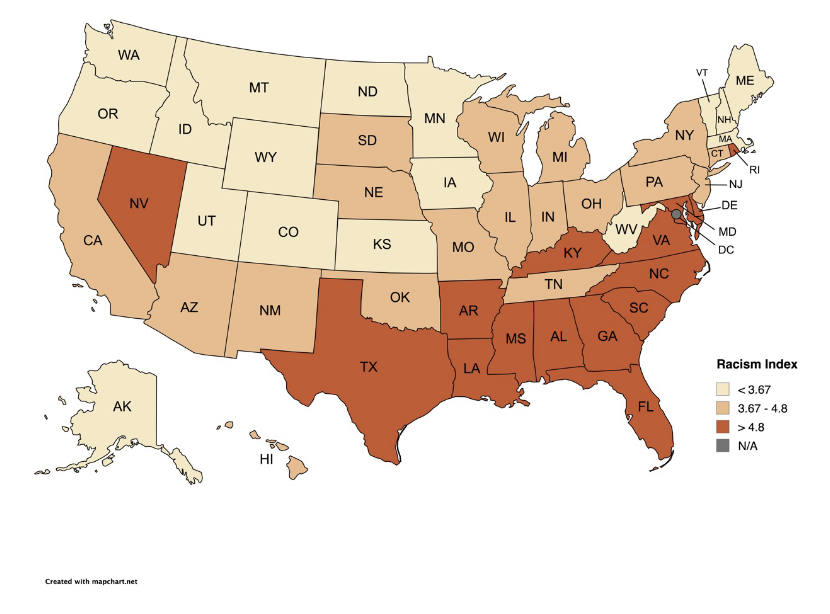
Take a look at this map, displaying a “racism” index by state (scroll down to see the state-by-state numbers). You might quibble with the underlying methodology, but to anyone with a modicum of U.S. history under their belt, the map should have some face validity, with states below the Mason-Dixon line generally scoring worse than those in the North, and much of the Midwest somewhere in between.
Now let’s add a map showing, by state, the magnitude of racial discipline disparities (the number of Black students suspended for every one White student suspended, based on OCR data). We would expect to again see the Deep South post sky-high numbers, and the North look great, right?

Uh oh.
What we see instead is a total mishmash. Almost none of the “most racist” states have the worst discipline disparities, while some of the more “racially enlightened” ones (including Minnesota, Utah, and Iowa) do.
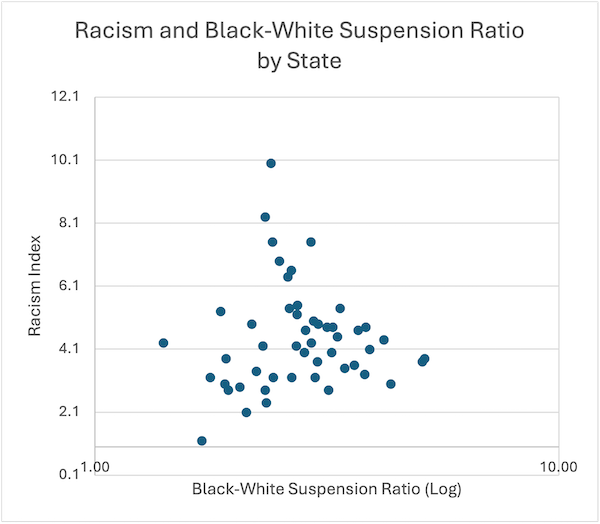
Indeed, if we plot these values on a chart, we find no relationship whatsoever.
Ok. Now let’s look at an alternative hypothesis—my hypothesis—that it’s not racism that’s predominantly driving racial discipline disparities, but socioeconomics. Let’s look, side by side, at states’ discipline disparities along with their “poverty disparities”—how many Black children are living in poverty for every one White child living in poverty. States with high poverty disparities are those where the Black population tends to be much poorer than the White population; those with low poverty disparities are those where the Black and White populations are economically more similar.
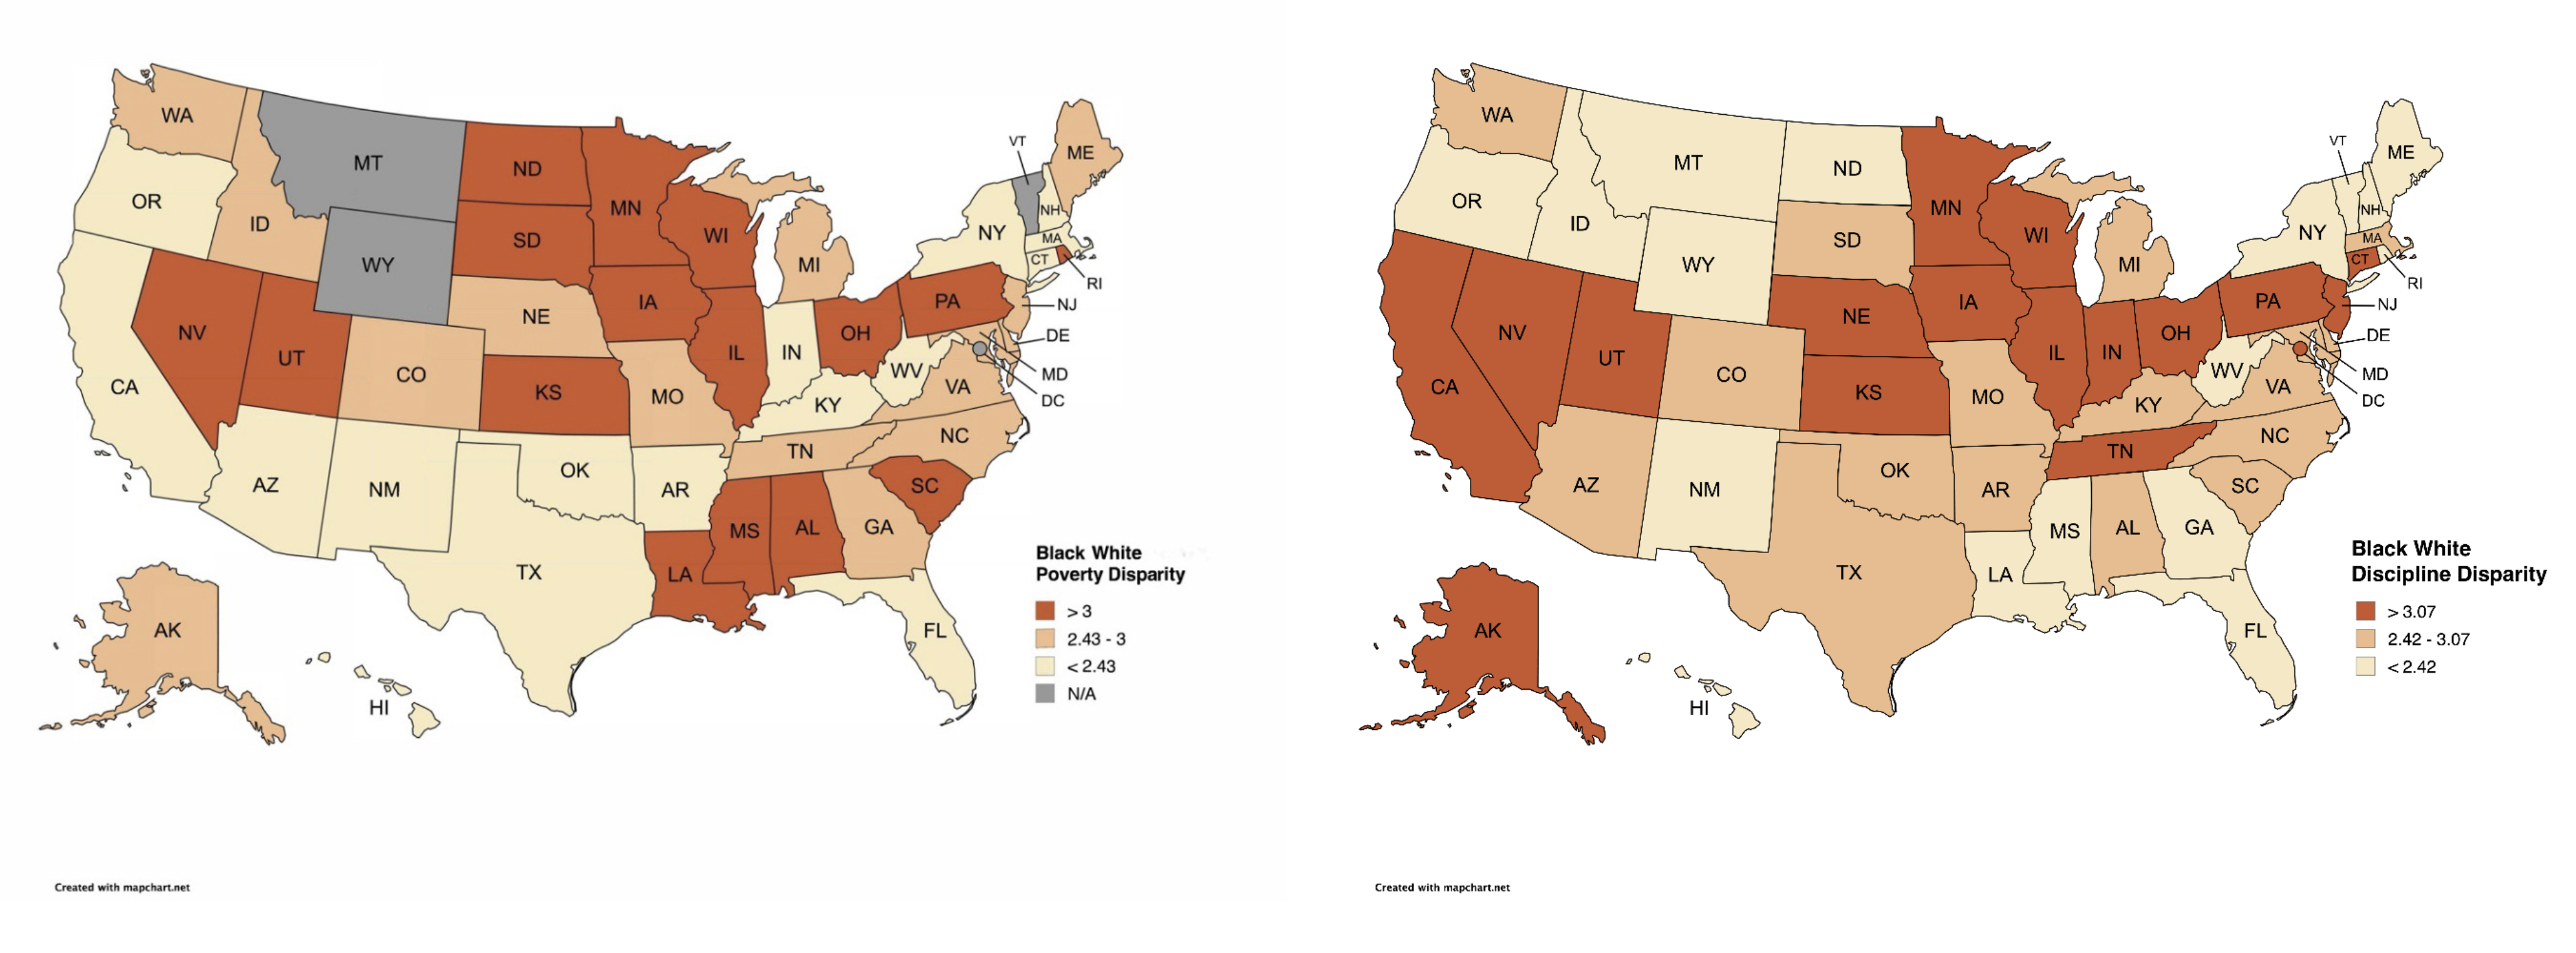
These maps look a lot more similar. I count nine states that score high for both discipline disparities and poverty disparities, including Pennsylvania, Ohio, Illinois, Wisconsin, Minnesota, Utah, and Nevada. These are states where White students tend to be middle class or affluent, and Black students are disproportionately poor. And it’s that difference that largely explains their large discipline disparities. (And their large racial achievement gaps, too.)
Let’s see how this looks on a chart. Here there’s a strong positive relationship between states’ poverty disparities and their discipline disparities.
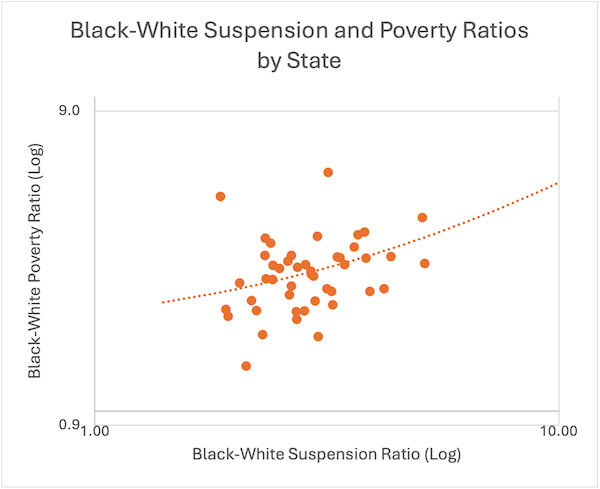
It’s certainly not a perfect correlation. Other factors are at play, likely including bias and discrimination. But that’s on the margins rather than at the center of the story.
Racism is a factor in discipline disparities, but a small one.
As I mentioned in my earlier post, it’s super hard to study misbehavior in school, because we seldom have any information about the behavior itself, only schools’ response to it. But a clever study out of Louisiana got around this problem by focusing on a small but telling subset of incidents. Namely: fights that featured both White and Black students. And they found, alas, that Black students received somewhat harsher punishments than White students for the same incident:
For fights involving one White student and one Black student, Black students receive slightly longer suspensions than white students. The difference is about one additional suspension day for every 20 fights. This disparity is evident even after accounting for students’ prior discipline records, background characteristics, and school attended.
So yes, racial bias and discrimination happen.
But note this finding: the suspensions that Black students receive are only “slightly” longer than the ones White students get. Yet the same study shows Black students getting suspended at twice the rate as White students—a huge difference. The reason is that Black students misbehaved at much higher rates. According to the study, more than three times as many Black students got into fights at school as White students. That’s the major factor driving the discipline disparity.
Here’s the bottom line: if we want to reduce Black (and White!) suspensions, we should focus on how to get kids to stop getting into fights and other forms of trouble at school. The Trump Administration’s recent actions on discipline and disparate impact should move us closer to that goal.
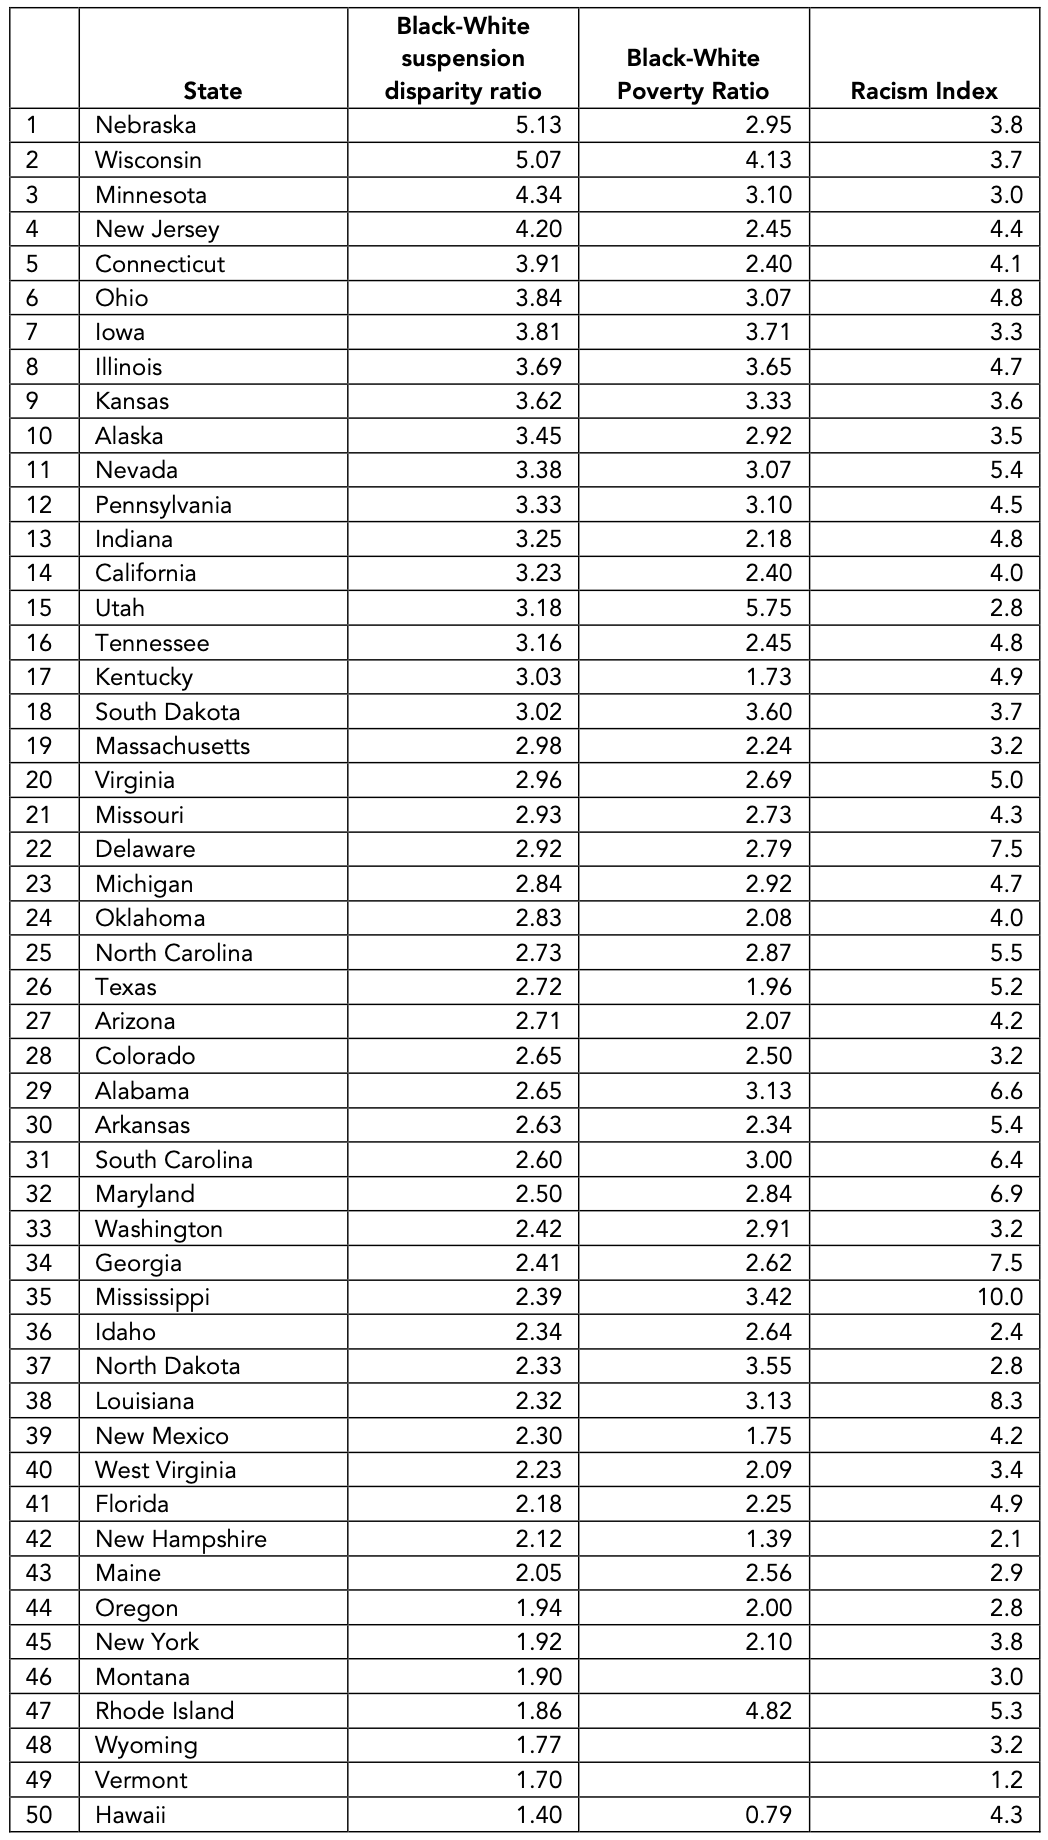
Data sources:
- Black-White suspension disparity ratios via U.S. Department of Education – Office for Civil Rights
- Black-White poverty ratio via U.S. Census Bureau
- Racism Index via Datapandas.org