

School Choice
Ohio’s EdChoice scholarship program improved college outcomes
As private school scholarship (voucher) programs sweep the nation, debate over their impacts on students remains heated.
As private school scholarship (voucher) programs sweep the nation, debate over their impacts on students remains heated.

As private school scholarship (voucher) programs sweep the nation, debate over their impacts on students remains heated. Critics routinely claim they have negative effects, while advocates call the programs a win-win for students attending both public and private schools. To inform these debates, researchers have spent countless hours studying the “competitive effects” of choice programs—the impacts of private schools on public school performance—as well as “participant effects,” or the direct effect of these programs on scholarship students.
Into this milieu, nearly a decade ago, the Fordham Institute published an in-depth look at Ohio’s private-school scholarship known as EdChoice. The analysis, which focused on its earliest years, yielded mixed results. On the one hand, the program led to a slight uptick in public schools’ performance by putting healthy competitive pressure on them to improve. On the other hand, however, the study uncovered negative impacts on scholarship students’ state test scores.
While expressing concern about the participant findings, my colleague Chad Aldis and I wrote in the report foreword, “The present report breaks important new ground, but it is by no means the final word on EdChoice. We still have much to learn, including whether vouchers impact non-testing outcomes such as postsecondary success.”
We urged caution, as we suspected that private schools might put students on stronger long-term trajectories that wouldn’t be captured by short-term impacts on test scores. Perhaps private schools strengthen student character and other non-cognitive skills—things that could increase students’ likelihood of attending college but not necessarily show up on a test. It’s also possible that private schools had curricula less connected to state assessments than public schools. Loose alignment—not learning losses that bear on postsecondary success—may have driven the disappointing results. Lastly, the study, for methodological reasons, focused on subsample of students attending (or who would have otherwise attended) public schools right around the scholarship eligibility margin. Perhaps something was missed when the analysis was restricted in this way.
Without research on the long-run outcomes of EdChoice students, all this remained speculation. That is, until this week. A new Urban Institute report provides hard evidence about the program’s longer-run impacts. The analysis was conducted by Matthew Chingos, David Figlio and Krzysztof Karbownik, the latter two of whom undertook the prior EdChoice study. The participant effects are, indeed, much better than what we observe using state test data and with what appears to be a larger sample of students.
To carry out this study, the analysts track the college enrollment and completion rates of students who participated in EdChoice between 2008 and 2014. To create apples-to-apples comparisons, they compare scholarship students to very similar pupils attending public schools (based on demographic variables and achievement on state tests). The postsecondary data cover in- and out-of-state colleges, as well as two- and four-year institutions. The study includes 6,243 and 1,650 EdChoice participants in the college enrollment and completion analyses, respectively.
Key results are as follows.
Figure 1: College enrollment and completion rates, EdChoice participants versus similar public school students

In terms of impacts by specific student groups, the study finds the college-enrollment boost was stronger for Black students and males participating in EdChoice. But no group differences were discovered for college completion. While deemed “suggestive evidence” by the study authors, students who participated in EdChoice for at least four years registered stronger college-going and completion rates than those who stayed in the program for shorter durations.
In addition to gauging long-term participant effects, the report also revisits the competitive effects of EdChoice—this time on public school students’ college outcomes. Here, the results are consistent with prior research on EdChoice, showing modest, positive impacts on public schools. When comparing students attending very similar public schools—some exposed to greater private school competition via EdChoice and others not—the analysts find that the program led to a 3 percentage point increase in public school students’ college enrollment and a 6 percentage point bump in bachelor’s degree attainment.
When viewed through the lens of state test scores, recent studies about private school programs’ effectiveness have yielded disappointing results. Yet a next generation of research on postsecondary outcomes—this one from Ohio, plus studies from Florida and Milwaukee—paints a more promising picture about the longer-term benefits of private school choice. Yes, we still have much to learn about private-school programs, including how they can be designed to maximize benefits for students and families. But for now, let’s chalk one up for the theory that choice programs are a win-win all around.
[1] No results were reported that cover associate degree attainment.

Chronic absenteeism is a significant problem in Ohio. During the most recent school year, 25 percent of students were chronically absent statewide. That means a fourth of Ohio’s public school population missed at least 10 percent of instructional time. And all that missed time adds up. Students who have never been chronically absent are six times more likely to read on grade level by the end of third grade and nine times more likely to graduate from high school on time. Being chronically absent, meanwhile, can negatively impact both academic and social-emotional development.
The good news is that most policymakers recognize the importance of regular attendance. In fact, Ohio has a history of leveraging state policy to address absenteeism that predates the pandemic-caused spike in numbers. House Bill 410, which lawmakers passed in 2016, overhauled the state’s absence intervention framework and required schools to work with families to address root causes of absenteeism. In 2017, state leaders went a step further and incorporated chronic absenteeism into state report cards. There was an ultimately unsuccessful effort in 2023 to water down data accuracy and transparency by making it easier for students to miss school for “legitimate” reasons. And later that year, a report published by the Ohio Attendance Taskforce found that HB 410 needed some tweaks, as it established a “prescriptive, legalistic, and reactive response” to absenteeism. The taskforce, which included school and business leaders as well as representatives from juvenile court, recommended several changes.
Governor DeWine acknowledged those recommendations in his recent state budget proposal and suggested repealing some requirements. The House maintained the majority of his changes. But it also added a requirement for public schools to report via EMIS the causes of student absences by (extremely specific) categories. Absences are already reported to the state as excused or unexcused. But the revised bill outlines an extensive list of potential causes that also must be tracked, including “various illness categories,” medical appointments, extracurricular activities, student exchange programs, agricultural organization activities, family travel, foster care activities, lack of transportation, and “additional categories identified through best practices review.”
At first glance, tracking absence causes seems like a good idea. Although plenty of Ohio schools have a chronic absenteeism problem, the reasons behind that problem vary greatly. A student who routinely misses class for medical appointments, for example, requires much different support than a group of students who frequently miss their first period class due to a late bus. Data that pinpoint precisely why students are missing school would help administrators, teachers, and even state policymakers intervene in effective and targeted ways.
But how schools obtain and use those data matters. And when it comes to the House’s proposal, there are two significant problems that should make the Senate wary of embracing it.
First, it could significantly increase the administrative burden on schools. Analysis of DeWine’s budget indicated that schools have reported dedicating “a significant amount of staff hours and resources” to implement HB 410. The changes DeWine proposed were designed to lessen that administrative burden. But by adding a data tracking provision, the House has undercut that effort.
Consider Table 1 below, which identifies the chronic absenteeism rates at Ohio’s five largest districts. Even with conservative estimates—assuming every student who was chronically absent missed exactly 10 percent of instructional time, or eighteen days in a 180-day school year—the number of absences that staff will be required to track is astronomical. And that’s just for students who were chronically absent. Tens of thousands of additional students also missed class time, they just didn’t miss enough to meet the chronic absenteeism threshold. Under the House’s proposal, schools would have to track the underlying reason for all of those absences, too. That means that even districts with low chronic absenteeism rates, like Olentangy, could face a significant administrative burden.
Table 1. Enrollment and chronic absenteeism data in Ohio’s five largest districts, 2023–24

For those who don’t work in schools, it might be difficult to understand how much effort implementing this proposal could require. In an ideal world, parents would provide a cause for each of their child’s absences without having to be asked by school staff. But as any current teacher or administrator can tell you, that’s not always how it works. And while many schools already request an explanation when students are late or absent, that doesn’t mean they get one.
To implement this proposal effectively, someone will need to be responsible for reaching out to families. And getting in touch can be tricky when parents are working during school hours. It’s likely that many phone calls and emails won’t be returned until the following day—and by then, additional absence causes will need to be tracked. It’s also likely that some phone calls and emails will never be returned at all. What are schools supposed to do if they can’t track down a reason or if families refuse to offer one? How many times must they reach out to families before they can identify an absence cause as “unknown”?
The second reason why Senate lawmakers should be wary of the House proposal is because of how the data might be used. In 2023, when lawmakers proposed watering down data accuracy and transparency, the list of absences they sought to identify as legitimate was eerily similar to the list of causes currently included in the House’s budget. And there is some speculation that tracking these data would allow lawmakers to argue (yet again) that some absences shouldn’t “count” toward chronic absenteeism calculations on state report cards.
The problem is that, as the Department of Education and Workforce has pointed out, missing too much school has “detrimental effects on a student’s learning trajectory” regardless of whether an absence is excused, unexcused, or “legitimate.” There are plenty of valid reasons for students to miss school. But a valid reason for an absence doesn’t change the fact that it’s still an absence. When kids miss school, they miss instructional time, and that can have short- and long-term academic consequences. If Ohio counts only some absences toward its chronic absenteeism measure, rates will certainly appear to improve. But appearance isn’t reality. The problem still won’t be solved, and kids will pay the price.
Ohio policymakers deserve credit for their willingness to refine chronic absenteeism policies, especially in response to feedback from schools regarding administrative burden. But the provision added by the House that requires schools to track absence causes undercuts those efforts. Moreover, it sets the table for another misguided effort to water down transparency and accuracy. Chronic absenteeism is a significant and persistent problem that Ohio must address. But it should be done by getting kids to and keeping them in school and not by drowning schools in data tracking.

Ohio is in the thick of another biennial budget season. The governor has rolled out his proposal, the House has passed its version, and now it’s the Senate’s turn to take the wheel. In the coming weeks, we should expect a familiar chorus from the usual suspects in the public-school establishment decrying the funding formula as “unconstitutional.” It’s as predictable as April showers and summer mosquitos.
This refrain surfaces like clockwork whenever the state adjusts the funding formula, particularly in ways the establishment claims “underfund” public schools. It’s not rooted in legal arguments but in political strategy—a way to stir up urgency, push for more dollars, and paint anyone proposing reform as an enemy of public education. But that claim doesn’t hold up anymore. The DeRolph decision, which declared Ohio’s system unconstitutional, was issued more than twenty years ago. And Ohio has come a long way since.
In the years since DeRolph v. State (1997–2002), Ohio has enacted not one, not two, not three, but four major overhauls (one during each gubernatorial administration) of its school funding system. The current model is fundamentally different than the one the Ohio Supreme Court found lacking two decades ago.
For starters, Ohio’s present system is designed to be progressive and targeted. Districts with weaker property tax bases—typically lower-income communities that were emphasized in DeRolph—receive more state aid per pupil than their wealthier peers. That’s not conjecture; it’s how the funding formula is designed. Ohio’s high-poverty districts receive significantly more taxpayer support (see page 18) per pupil than affluent ones. In 2019, the poorest 20 percent of districts spent nearly $15,000 per pupil, compared to just over $12,000 in the wealthiest quintile. These are not signs of a state shirking its constitutional duty—they’re clear indicators of a system working to support schools that need dollars most.
Then there’s facilities. Since DeRolph, the state has invested more than $12 billion in constructing and renovating school buildings, with a clear emphasis on high-need districts. Travel across the Buckeye State and you’ll find a plethora of newly built schools dotting the landscape. Many of these facilities only exist because of considerable state support. Providing modern learning environments in Ohio’s most economically challenged areas isn’t just good policy—it’s the constitutionally mandated “thorough and efficient” education the Court envisioned.
The public school establishment often points to the growth of school choice as irrefutable proof that Ohio is undermining its commitment to public education. But as a 2020 Fordham analysis shows, school choice has not eroded district funding. In fact, per-pupil spending in Ohio’s major urban districts (see pages 23–26)—those most impacted by the competitive aspects of school choice—has increased in inflation-adjusted dollars, not declined, since the expansion of charter schools and vouchers.
Moreover, it should be noted that Ohio’s choice programs don’t even operate on a level playing field. Charter schools and voucher students receive significantly less taxpayer support than their district counterparts. In cities like Cleveland, the gap between district and average charter funding exceeds $8,000 per pupil. The discrepancy is even bigger when looking at funding for Cleveland Scholarship students. That’s not “draining” traditional public schools—it’s subsidizing them, since local property tax dollars remain in district coffers even when students leave for schools of choice.
Still, the claim persists. “Unconstitutional!” they cry. Yet no one files a lawsuit on the funding formula itself. Why? Because deep down, the critics know the case wouldn’t survive a courtroom. Their argument is more press release than legal brief—designed to shift political winds, not win judicial battles.
That’s not to say everything is perfect. The current funding model still relies too much on temporary phase-ins, guarantees, and inefficient allocations like DPIA. But let’s have that debate honestly—based on facts, tradeoffs, and real needs—not on reheated grievances from a case that predates smartphones and YouTube.
Ohio has proven time and again that it supports its public schools. So as the Senate gets to work on its version of the budget, let’s stop pretending we’re still stuck in the DeRolph era. Ohio’s school funding system may not be flawless. But unconstitutional? That dog won’t hunt.

It’s state budget season, which means Ohioans are being inundated with an abundance of confusing numbers. Most have dollar signs attached. But here are a few that don’t, courtesy of Ohio’s results on the 2024 National Assessment of Educational Progress (NAEP).
These numbers are grim. They suggest that tens of thousands of students march annually from grade to grade and receive diplomas without mastering the literacy and numeracy skills they need to succeed in college or the workforce. The pandemic certainly exacerbated the issue. But achievement was declining long before Covid, and if policymakers don’t act, these bleak numbers are likely to grow even worse.
Identifying struggling students as early as possible and providing them with support and intervention before they fall further behind is critical to ensuring that all students exit high school ready for their next step. But Ohio's current early-identification policies are too feeble to get the job done. For example, state law requires schools to administer a diagnostic reading assessment to all students in grades K–3. The Department of Education and Workforce (DEW) has developed an assessment for this purpose. But schools aren’t required to use it. Instead, they’re free to choose from more than a dozen screeners, some of which don’t effectively identify struggling readers (more on this below). Meanwhile, schools aren’t expected to screen children in grades K–3 for math deficiencies at all. DEW is required to develop math diagnostics for grades one and two, but districts aren’t required to use them.
To boost student achievement, Ohio needs to strengthen its early identification efforts. Governor DeWine took an important first step in his budget proposal by calling on DEW to adopt diagnostic assessments in both reading and math for each grade K–3. Under his plan, public schools would be required to administer these screeners beginning in the 2026–27 school year.
But then, inexplicably, the House removed these provisions from its version of the budget. It also eliminated the state’s long-running and extremely informative Kindergarten Readiness Assessment (KRA), which public schools have used for years to gauge children’s school readiness across four areas, including literacy and math. With universal diagnostics and the KRA gone, Ohio wouldn’t just fail to move forward—it would move backward.
Now it’s up to the Senate to tackle Ohio’s academic crisis. There are three reasons that lawmakers in the upper chamber should act decisively to restore DeWine’s proposed universal diagnostics and the KRA.
First, doing so would ensure more accurate early identification of struggling students. As noted above, districts may now use more than a dozen different state-approved diagnostics in reading. Local officials claim that such flexibility is necessary for the sake of their teachers and students. But some of these exams aren’t effectively identifying struggling readers.
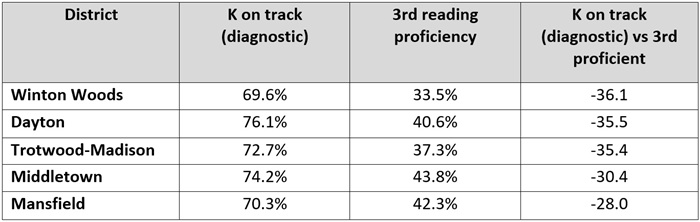
Table 1 illustrates serious discrepancies in early literacy data among some Ohio districts. Dayton Public Schools, for example, identified 76 percent of its kindergartners as “on track” in reading based on its self-selected diagnostic. But only 40 percent of third graders were proficient in reading on the state exam. In Winton Woods, the district diagnostic identified more than two-thirds of kindergarteners as on track. But in third grade, only one-third were proficient on the state exam. And in Trotwood-Madison, the district diagnostic also identified more than two-thirds of kindergarteners as on track, but only 37 percent of third graders achieved proficiency on the state test. It’s true that the kindergarten and third grade results reflect two separate cohorts of students. But historical data show similarly large disparities, which suggests a consistent mismatch between on-track identification and third-grade proficiency—an inconsistency that is likely rooted in a low-rigor kindergarten diagnostic.
Table 1. Districts with large discrepancies in kindergarten on-track rates (fall) and third grade reading proficiency rates, 2023–24.
Second, more accurate identification would help ensure that struggling students receive extra support. When students are identified by a diagnostic as “off track” in reading, state law requires schools to work with parents to create a reading improvement and monitoring plan (RIMP). These plans outline the instructional services that students must receive based on their unique reading difficulties, with the goal of helping them improve. Students who are identified as on track, meanwhile, are exempt from the RIMP and parental notification requirements.
When districts identify large percentages of students as on track, they significantly reduce the number of RIMPs they must create and the extra services they must provide. And if all those students were genuinely on track, that would be fine. But as Table 1 demonstrates, large portions of students who were supposedly on track in kindergarten aren’t reading proficiently by third grade. These students should have received intensive services to help them improve their reading skills. Their parents should have been notified that they were reading below grade level. But because they were identified as on track by the district diagnostic, neither of those things happened.
The third reason the Senate should adopt a universal diagnostics proposal is because Ohio desperately needs to improve its numeracy outcomes along with reading. Unlike literacy, where Ohio’s robust policy ensures that at least some struggling students are identified, there is no state-level expectation for schools to identify and support students who are struggling in math. One would hope that schools are doing it anyway, since it’s good practice. And in some places, that’s likely true. But Ohio’s lackluster achievement in math suggests that there are plenty of schools that aren’t identifying and intervening with students.
Ohio’s disappointing NAEP results prove that we’re failing our lowest-performing students. To better serve them, the state must establish a robust early identification and intervention policy. A universal screening requirement would ensure that every academically struggling student in Ohio is identified. And that identification—along with the instructional support that should follow—could mean the difference between catching up with peers and slipping through the cracks.

K–12 student enrollment nationwide has been declining since in 2019, with traditional school districts bearing the brunt of both a baby bust and a surge in non-district options, public and private. This is clearly evident in Los Angeles Unified School District (LAUSD), where you can add negative reactions to Covid school closures and out-migration of families from the city to the list of baleful influences on enrollment in recent years. LAUSD’s elementary schools alone have experienced a 46 percent decline in enrollment from their peak in 2001. While all of this may sound like a clarion call for right-sizing—consolidating students in the best buildings, closing and selling the oldest and least-used, merging academic and extracurricular offerings—that’s not what happened, as a new report lays out in sad detail.
The report comes from Available to All, a nonprofit watchdog dedicated to making sure that public schools live up to their “open to all” mantra. They looked at all LAUSD elementary schools (both district-operated buildings and district-affiliated charters) which were open at the start of the 2024–25 school year and serving grades 2–5, but excluded schools that covered higher grades as well, such as K–8 or K–12 models. Although the majority of elementary schools in Los Angeles are considered magnets that can admit students who reside anywhere in the city, most also operate attendance zones and prioritize admission to students residing in their zones. The same is true for many L.A. charter schools and is the crux of the problem as identified by the researchers. Any elementary school operating with an “exclusionary” attendance zone (in the report’s preferred parlance) was included. The analysis looks at capacity (defined as the highest enrollment previously recorded, although this measure could be problematic), current enrollment, student demographics, and academic performance (defined by percentage of students testing proficient in English for their grade level).
Of the 456 elementary schools included in the sample, almost half (255 buildings) have seen enrollment declines of 50 percent or more since their peak occupancy. In fifty-six of those, the decline has been 70 percent or more. It should be noted that some schools’ “peak enrollment” likely included overcrowded classrooms and/or modular units in the parking lot, which means that some fraction of “peak” is actually better for students. However, as the researchers note, it is the only publicly-available data on maximum capacity in LAUSD buildings and they do attempt to adjust for the possibility of previous overcrowding as best they can. Far less equivocal: Thirty-four buildings have fewer than 200 students enrolled for this current school year. Twenty-nine of these are operating at less than 50 percent of peak, with twelve hovering closer to 25 percent.
On the achievement side, only thirty-nine schools in the sample record English proficiency of 70 percent or more for their students. In these thirty-nine schools, 45 percent of the students are white, while the district’s other 417 schools are only 7 percent white. In fact, twenty-one of these thirty-nine schools are majority white, while only eleven of the district’s hundreds of other schools are majority white.
The thirty-nine highest-performing elementary schools have also bucked the trend of plummeting enrollment, showing a decline of just 5 percent from peak enrollment through 2019 and an additional 8 percent since the pandemic. But they have definitely lost students over time, to the tune of nearly 6,900.
Putting all this together, we get the picture of a lot of empty desks throughout LAUSD, including both the lowest- and the highest-performing elementary buildings. Since all of these schools are designated as magnets—open to families outside the attendance zone—enrollment declines could present the perfect opportunity for families to secure seats for their children in coveted, high-flying schools. But that’s not what the data show. According to the analysts’ estimates—sympathetic to the “peak might be overcrowded” argument—the thirty-nine best-performing schools have room for at least 4,300 more students, but are reporting only fifty-eight seats available for students outside their attendance zones. That’s just 1 percent. And, no surprise, those attendance zones today mirror the race- and income-excluding redlining maps from the 1930s. Things are no better at the district-affiliated charter schools. Analysts called every school, asking about seats for out-of-zone first and fourth grade students. Every school but one reported no available seats—unless students lived in the attendance zone—despite the analysts’ estimate of at least 2,589 empty seats in total based on historical enrollment data. The report suggests that the persistence of these blatant exclusionary tactics could be another reason why Angelenos have been abandoning LAUSD schools in recent years.
The report recommends a set of five reforms to address these longstanding problems. They include allowing families to cross attendance zones if they live within five miles of a given school, publicly reporting buildings’ true maximum capacity, and creating an independent appeals process for any exclusionary denial of enrollment. At least one of them—listing all available seats as open to students from outside the attendance zone—is already required by California law but is largely ignored by schools, so hopes should probably not be high that any of the others will come about either.
One suggestion unfortunately not brought forward in the report: automatic closure for schools whose enrollment falls below a specific threshold (with or without connection to academic quality). LAUSD superintendent Alberto Carvalho is clearly not champing at the bit to do so, having settled a support staff strike in 2023 with a promise to increase hiring, preparing to negotiate with teachers who are also demanding more staff, and saying in a recent interview with The 74 in response to the Available to All report that, “The savings [from closures] are not what people think,” because “students still have to go somewhere” and be served by staff. This new report, showing that LAUSD’s old-timey attendance zones continue to benefit wealthy and white families even in the face of impending enrollment collapse, will likely make no difference. Unless forced to right-size its footprint by outside forces, district leaders clearly intend to keep all their buildings open with full staff rosters and ever-shrinking enrollments…until the students or the money run out. Whichever comes first.
SOURCE: Available to All, “Crisis in the Schoolhouse” (April 2025).

Pandemic-era disruptions to education resulted in an unprecedented influx of federal funds to K–12 schools, some of which was used to address lost student learning. Summer school, one-to-one technology, academic enrichment, and virtual resources were among the myriad remedies deployed, but none was thought to hold more promise than tutoring. Studies indicate far less positive impact than hoped for from tutoring, particularly for those students who fell furthest behind. What happened? A new report from the journal Educational Researcher digs into one charter network’s implementation efforts and finds evidence that could explain the problem.
A trio of California-based researchers partnered with Aspire Public Schools, a large network of charter schools in the state with locations in the Bay Area, the Central Valley, and Los Angeles. At the start of the spring semester of 2021, all 7,000 Aspire middle and high school students received personal electronic devices and free access to an unnamed on-demand virtual tutoring platform covering content in core academic subjects. The service was available 24/7, but the research team doesn’t delve into details on when students used it other than to say they are aware of instances where it was incorporated into classroom time. In other words, this is not a study of embedded versus non-embedded tutoring.
The researchers examined student usage of the platform in that initial semester and tested the efficacy of targeted messaging to incentivize that use. To test the latter, they randomly assigned student households to a control group or to one of three treatment arms involving communications to students only, to parents only, or to both students and parents together. The researchers designed and disseminated the communication pieces using several different styles and tones; employing print (flyers and mailers), email, and text message; and utilizing various approaches such as reminders, appeals to social norms, accountability, and valuing of the academic subject. These were separate from whatever outreach individual schools or teachers were providing, which were received by all students and were not tracked as part of the experiment.
In the control group, only 19 percent of students ever accessed the platform during the semester and engaged in a tutoring session. Those control group students who did access it attended, on average, 4.3 tutoring sessions and exchanged 146.05 messages with a tutor. But the average control group student—when including those who never accessed the platform—participated in a mere 0.80 sessions and exchanged twenty-seven messages with a tutor via the platform. Ninth grade students and students with higher prior course performance were most likely to participate, and several individual schools clocked substantially higher take-up rates.
Did targeted messaging boost participation? Results varied depending on who received the communications, whether only the student, only the parent, or both parent and student. Students who only received messaging directly used the tutoring platform at about the same rate as their control group peers. Students whose parents received messaging were 5.7 percentage points more likely to access the tutoring platform than the control group. However, neither the number of sessions attended nor number of messages exchanged with tutors differed significantly from their control group peers. In other words, targeting parents alone seemed to induce a one-time sign-on but not students’ continued usage of the platform. The most effective communication approach engaged both student and parent. Such students were 8.6 percentage points more likely to use the platform. Additionally, they attended 1.4 sessions, on average, and exchanged 64.6 messages with tutors, both of which represent statistically significant increases over control group peers—even if those numbers are still very low.
The researchers make some effort to connect participation in tutoring with learning gains, but their outcomes are limited to course grades, and they therefore considered the small positive impact as merely “suggestive evidence.” There are no data provided on how much the charter network spent to implement this tutoring service, but whatever it was, the bang for that buck was clearly just a whimper. Despite the promise of tutoring, Aspire students reaped nearly no benefit from it—like many other students nationwide.
Ultimately, the researchers focus on the opt-in nature of the tutoring program as the primary reason for low overall usage and the fact that lower-performing students—those who need academic supports the most—were least likely to access it. “Helping the students who need it most will require a coordinated effort between educators and families to provide students with embedded, personalized learning opportunities,” they offer. Translation: Recovering lost learning can’t be optional, and all adults must be on board with requiring additional work to get it done. To which we could add, at five years and counting, time is quickly running out.
SOURCE: Carly D. Robinson, Biraj Bisht, and Susanna Loeb, “The Inequity of Opt-in Educational Resources and an Intervention to increase Equitable Access,” Educational Researcher (April 2025).

Career-technical planning districts (CTPDs) are responsible for planning and providing career-technical education (CTE) in elementary and secondary schools. Ohio has ninety CTPDs; forty-nine of them are led by JVSDs (see below), while forty-one are either comprehensive CTPDs (a single school district that provides its own CTE programs) or compacts (groups of districts that share responsibility for providing CTE without creating a JVSD). Every school district and public charter school is a member of a CTPD.[1]
Charter and STEM schools are tuition-free public schools that operate independent of traditional districts. They receive federal and state taxpayer funding, but with few exceptions (in Cleveland) receive no local tax support. In FY24, Ohio had 336 charters—also known as “community schools”—and eight independently run STEM schools.
The fiscal year (FY) of the State of Ohio and local districts runs from July 1 through June 30. FY24, for instance, refers to the period from July 1, 2023, through June 30, 2024 (corresponding to the 2023–24 school year).
Industry-recognized credentials (IRCs) signify one’s acquisition of certain knowledge and skills. In FY25, DEW approved 596 IRCs across fifteen career fields. Each IRC is assigned a point value, from one to twelve, and students can meet certain components of Ohio’s graduation requirements when they earn at least twelve points in a single career field.
Innovative Workforce Incentive Program (IWIP) provides additional state funding to schools when students earn IRCs in specific high-priority career fields (e.g., engineering, health care, IT, and manufacturing). In FY25, 194 IRCs are eligible for IWIP funding.
Joint vocational school districts (JVSDs) provide CTE for students from multiple member school districts in a region. Just like traditional districts, JVSDs are funded through federal, state, and local taxpayer dollars. There are forty-nine JVSDs in Ohio.[2]
Ohio Department of Education and Workforce (DEW) is the state agency that implements most of Ohio’s K–12 education laws. It was formerly known as the Ohio Department of Education (ODE).
The Ohio Eight urban districts are Akron, Canton, Cincinnati, Cleveland, Columbus, Dayton, Toledo, and Youngstown. All eight districts are “comprehensive” CTPDs and provide their own CTE programs.
Work-based learning (WBL) refers to career-development experiences that occur in real workplace settings or simulated environments at an educational institution. Internships and apprenticeships are examples of WBL.
Over the past decade, career and technical education (CTE) has garnered renewed attention in Ohio. In his 2014 State of the State address, former Governor John Kasich urged a stronger focus in this area: “How did we ever lose our way on vocational education? Why did we put it down? … I want to see this kind of high-quality experience in both jobs and learning.”[3] Nearly a decade later, his successor, Governor Mike DeWine, pledged to invest more heavily in CTE during his 2023 State of the State address.
“So often, the teachers would tell us that more kids want to take (career-technical) courses, but there are waitlists because there simply aren’t enough open spots. In other cases, they told us they don’t have the most modern, up-to-date equipment needed to teach certain courses. …
To reach more students and to provide better training for twenty-first century jobs, our budget will invest $300 million of one-time funding for capital improvements and equipment for career tech education.”[4]
As promised, Governor DeWine included this hefty investment in his budget proposal, and the General Assembly approved the expenditure via the FYs 2024–25 state budget bill. Yet there’s much more to CTE funding than this initiative. Ohio has multiple programs—some of recent origin—dedicated to CTE and workforce development. This report provides an overview of the various funding streams that support CTE in K–12 schools.[5] It documents how much Ohio public schools spend on CTE overall and describes the various mechanisms that drive these dollars to schools. Though not a comprehensive analysis of Ohio’s CTE policies, we discuss strengths and weaknesses of the funding elements and recommend six policy improvements that would further leverage the system to strengthen CTE.
Beginning with total spending—which includes dollars from state, local, and federal tax revenues—public schools statewide expended $718 million in FY23 to support 75,812 full-time equivalent (FTE) students participating in CTE.[6] As a percentage of total statewide spending on education ($26 billion in FY23), CTE spending represents 3 percent of total statewide K–12 expenditures.
Turning to funding mechanics, we focus on the main state and federal programs dedicated to CTE, which are as follows:
Figure 1: Breakdown of CTE categorical add-on funding, FY24

Whether through the categorical funding system or standalone programs such as IWIP and employer incentives, Ohio is making progress building a CTE system that prepares an increasing number of young people for the jobs of tomorrow. Yet more can be done, and the report offers several policy recommendations for state lawmakers. Briefly, they are as follows (more detail is found at the end of the relevant section of the paper). Note, that as this report goes to press, several of these recommendations are addressed in some form in the state’s operating budget bill (House Bill 96), which will be finalized in July.[7]
A rigorous CTE system is a benefit to all Ohio. Employers can hire more highly skilled workers, and students are better positioned to take advantage of rewarding job opportunities. All Ohioans enjoy the fruits of a more prosperous economy. By strengthening its funding policies, more Ohio students will have opportunities to participate in high-quality career technical education.
How much is spent overall on CTE in Ohio? To answer this question, we dig into the state’s expenditure data, which report the amounts spent specifically on CTE.[8] These expenses capture regular day-to-day spending on CTE courses and programs, but exclude spending on core academic instruction, supplemental services such as special education or tutoring, administration, and capital outlay. The amounts spent on CTE reflect dollars generated from state and federal sources, as well as local taxpayer funds, which are raised primarily through property taxes.
As Figure 2 indicates, Ohio public schools spent $718 million on CTE in FY23. The delivery of these programs and services can be done by JVSDs—regional entities that specialize in CTE—as well as traditional school districts and public charter and STEM schools that operate their own career-tech programs. JVSDs spent a majority of these funds: $415 million, or 58 percent of total statewide CTE spending. Traditional school districts spent $290 million, or 40 percent, while public charter and STEM schools spent the remaining 2 percent.
Figure 2: CTE spending by sector, FY23

As might be expected, the spending totals by sector follow enrollment patterns. Table 1 shows that 51 percent of CTE students—counted on a full-time equivalent (FTE) basis (see box below for more)—attended a JVSD, while 35 percent participated in a program at a traditional district. Although charter and STEM schools served 14 percent of CTE students, they spent a relatively small portion of the overall amount (2 percent). This reflects the type of CTE programs that charters provide: As discussed in the categorical funding section below, charters are more likely to provide CTE courses that are funded at lower levels.
Table 1: CTE spending by sector, FY23

Funding K–12 education overall is a joint effort between the state and local districts, with some additional aid from the federal government. This shared funding model applies to CTE as well. The state and local districts provide the majority of funds for CTE programs, while federal programs contribute modest sums to supplement. Even though local taxpayer dollars provide a sizeable portion of CTE funding, they are not allocated through specific formulas or grants. Thus, this section focuses on state funding mechanisms for CTE; a brief overview of federal programs follows.
Table 2 presents an overview of the state’s CTE-specific funding initiatives. The largest funding stream is the CTE categorical add-on, which provides almost a quarter-billion dollars per year to public schools. The state also provides funding—albeit smaller amounts—for several programs that have narrower purposes. These include initiatives that support the attainment of in-demand IRCs (IWIP), promote career awareness and exploration, and offer employers incentives to provide students work-based learning opportunities. Taken together, the state spends approximately $260 million on “regular” CTE-specific funding.[12] Two special programs—which may turn out to be one-time initiatives—are listed at the bottom of the table. They have driven additional resources to schools seeking to expand their capacity to provide high-quality CTE.
Table 2: An overview of dedicated state funding for CTE

The state funding formula provides a “base” per-pupil amount for all students, and it also includes categorical “add-on” elements that drive additional dollars to schools that serve pupils from certain backgrounds or who participate in specific programs such as CTE. These funds—sometimes referred to as “weighted student funding”—help schools cover the extra costs of providing a more specialized education.
The current structure of the CTE add-on was first implemented during the Kasich administration. The model includes weights tied to the base CTE funding amount, and are linked to five categories of CTE programming. This framework was kept intact during Ohio’s recent transition to a new school-funding formula, known as the Cupp-Patterson or Fair School Funding plan, which was first implemented in FY22.
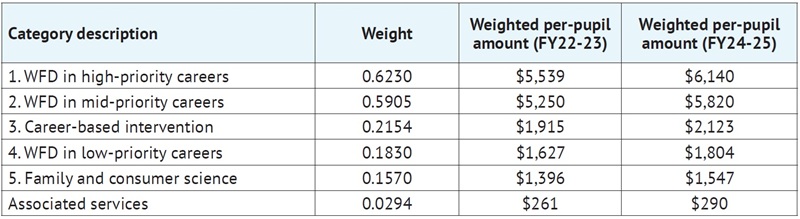
The table below displays the CTE categories and their associated weights (left two columns). The highest-funded category is workforce development in high-priority[13] career fields outlined in statute and listed in the box above. As the far-right column indicates, the additional amount for category one is $6,140 per FTE pupil (0.6230 x $9,856 CTE base per pupil). The next-highest funded category is workforce development in mid-priority careers, followed by career-based intervention programs,[14] workforce development in low-priority careers, and family and consumer science programs.[15] Finally, the state includes an “associated services” element within this system, which provides dollars for CTE administration and oversight. The table also shows that the CTE categorical funding amounts have risen since FY22, driven by the increase in the CTE base per-pupil amount during this period (not due to a change in weights).
Table 3: Categorical add-on funding for CTE
JVSDs, traditional districts, and public charter/STEM schools are all eligible to receive CTE categorical funding. In the case of JVSDs and traditional districts, the “state share percentage” is applied to their weighted funding amounts. This mechanism, which also applies to several other formula components, is used to direct more state aid to districts with less capacity to raise local funds. A low-wealth JVSD or traditional district, for instance, might receive 80 percent of the “full” weighted CTE funding amounts, while a high-wealth district might receive 20 percent. Because charter and STEM schools do not have local taxing authority, and with one small exception (in Cleveland) do not actually receive any local dollars,[16] the state share percentage is not applied to their CTE categorical funding.
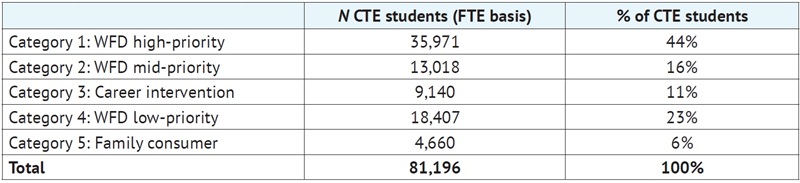
How much actually flows through the categorical add-on? Figure 3 shows that $218.1 million was sent to JVSDs, districts, and charter/STEM schools in FY24. Reflecting the weighted funding system and course-taking patterns, the bulk of these funds were allocated based on student participation in workforce development programs in high-priority careers ($126 million, or 58 percent of the total CTE categorical). The next-largest portion was workforce development in mid-priority career fields ($42 million, or 19 percent), while the remaining dollars were allocated based on participation in the other categories. As Table 4 indicates, three in five CTE students participate in category 1 and 2 programs. That, in conjunction with the weighted funding structure, resulted in 77 percent of the overall CTE add-on being allocated based on participation in category 1 and 2 programs.
Figure 3: Overall CTE categorical add-on funding by category, FY24
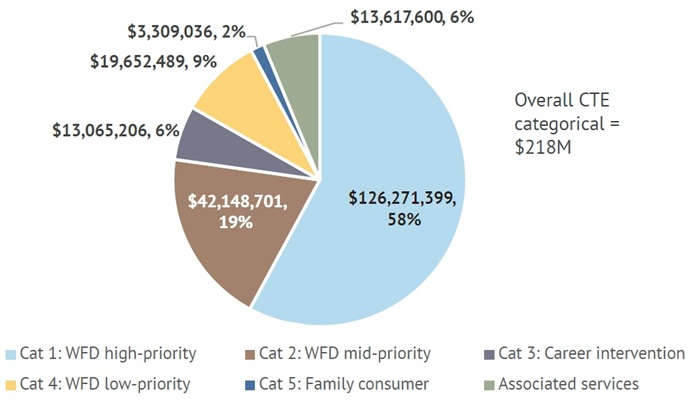
Table 4: Student participation in each CTE category, FY24
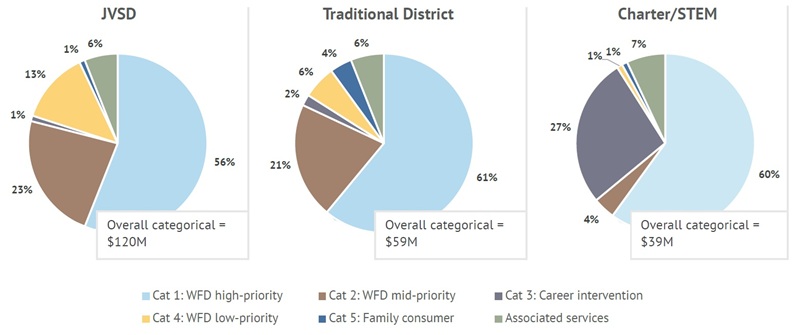
The next figure displays the distribution of categorical funds by category and sector. Given their larger share of CTE enrollment, JVSDs received the largest portion of the categorical dollars ($120 million), while traditional districts and charter/STEM schools received smaller amounts ($59 and $39 million, respectively). Funding by category for JVSDs and traditional districts was generally similar, with the workforce development in high- and mid-priority careers representing about 80 percent of their total categorical. However, the breakdown for charter/STEM schools is different. More than a quarter of their CTE funds were tied to career-intervention programs (category three), while just 1 to 2 percent of JVSD and traditional district categorical funding was based on that category. The higher share of career intervention funding may reflect the fact that dropout-recovery charters—which serve adolescents who are significantly off-track—enroll most CTE charter students.
Figure 4: CTE categorical add-on funding by category and sector, FY24
Ohio puts significant restrictions on how schools may use CTE categorical funds. Under state law, schools cannot spend more than 25 percent of these funds on personnel such as CTE instructor salaries and benefits. Instead, the vast majority of these funds must be used on specific items outlined in statute, such as curriculum, instructional materials, equipment and supplies, professional development, and work-based learning experiences.[17] While it makes sense to limit use of these funds to CTE programs, as the law currently does, the additional restriction related to salaries could make it more difficult for schools to attract and retain the instructional workforce needed to provide high-quality programs across multiple career fields.
Recommendations
The categorical add-on element of the funding formula provides the bulk of state funding for CTE. Importantly, the weighted funding structure encourages schools to provide coursework in high-priority career fields, and the course-taking patterns show that most CTE students are indeed taking courses in those areas. To further improve the categorical funding component, we recommend the following:
Innovative Workforce Incentive Program (IWIP) and IRC test-fee reimbursements
Industry credentials signify the attainment of certain skills and can give young people an edge as they enter the workforce. In recent years, Ohio policymakers have encouraged schools to offer programs that lead to IRCs by making credentials a pathway to high school graduation and including IRC attainment in the state’s accountability system.[18] Another way that Ohio incentivizes IRCs is through the IWIP program and exam fee reimbursements.
IWIP focuses squarely on IRCs in high-demand careers. As such, the state has developed a more select list of IWIP credentials compared to the broader list of IRCs the state approves for graduation purposes. Under this program, schools receive reimbursements of up to $1,250 per credential when students earn selective IRCs in eight designated career fields.[19] JVSDs, traditional districts, and charter/STEM schools are all eligible to receive reimbursements. IWIP is funded via a budgetary earmark, so there is a fixed amount of funding—$10.5 million in FY24—to reimburse schools. If the number of credentials earned times the maximum reimbursement rate exceeds the allocation, the per-credential reimbursement is reduced. This occurred in FY24, when schools received just $550 per credential.
In FY24, students earned 19,175 IRCs in 105 different reimbursable credentials. The ten most frequently earned IRCs are displayed in Table 5 below. At the top are the NCCER Core, a construction credential, which 2,244 students earned, and the STNA certification.
Table 5: IWIP funding by credential, FY24
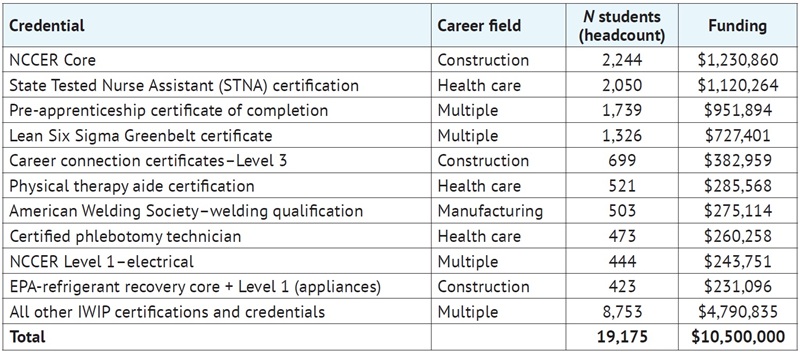
Table 6 shows that about two in three students earned IWIP credentials at a JVSD, a noticeably higher proportion compared to the percentage of CTE students attending JVSDs (51 percent; see Table 1).[20] On the other hand, traditional districts had a lower share of IWIP-attaining students relative to their CTE enrollment statewide (27 percent versus 35 percent of enrollment). Charter and STEM schools represented an even smaller proportion of IWIP earners (5 percent versus 14 percent of CTE enrollment). When looking more closely at traditional district IWIP attainment, we find that the Ohio Eight urban districts—all of which provide their own CTE programs[21]—had just 1,030 students earn IWIP credentials.[22] With a combined high school enrollment of just under 40,000 students (grades 9–12), this means that two in every one hundred Ohio Eight district high-schoolers earned IWIP credentials last year. This suggests significant room to grow high-quality CTE programs that lead to IWIP credentials in Ohio’s urban districts and charter schools. Yet as the discussion below on the state’s capacity-building efforts indicates (see below), Ohio Eight districts and charter schools received very little of those funds.
Table 6: IWIP funding by sector, FY24

In addition to IWIP, the state also encourages IRC attainment by providing reimbursements to schools that subsidize the costs of credentialing exams. In FY24, Ohio allocated $5.5 million for this program, which covered the cost of 114,211 credentials, including both IWIP and non-IWIP credentials.[23] The five most common credentials reimbursed were CPR First Aid (17,691); OHSA 10-Hour Training (15,403); RISE Up Retail Industry Fundamentals (10,981); RISE Up Customer Service and Sales (9,709); and Leadership Excellence (4,228). None of these appear on the more selective IWIP credentials list.
IWIP is an important state initiative, as it incentivizes schools to provide high-quality CTE that leads to credentials in high-demand career fields such as construction, manufacturing, and health care. State lawmakers should continue to support this program by providing adequate reimbursements and supporting its growth particularly in high-poverty urban schools. Policymakers, however, should eliminate test-fee reimbursements to ensure the state is not incentivizing lower-level credentialing programs. Specifically, we recommend the following in the area of IRCs:
Career awareness and exploration funds
Beginning in FY22, the state began providing a per-student amount—based on all K–12 students—that supports career awareness and exploration in elementary, middle, and high schools. The initial amount was just $2.50 per pupil and rose to $7.50 and $10 per pupil in FY24 and FY25, respectively. The dollars are paid to the lead district of a CTPD, not directly to a district or charter school, and the CTPD is supposed to provide programs to member districts and schools.[24] Total allocation for the career awareness and exploration program was $12.2 million in FY24 and was funded via an earmark within a larger CTE “enhancements” appropriation in the state budget. The rest of the enhancement dollars ($8 million) are used to support several smaller CTE programs, such as career-based intervention in juvenile correctional facilities, summer agricultural programs, and programs for students interested in the restaurant and computer science industries.[25]
Recommendation
Introducing students to career opportunities can stir interest in acquiring particular skills, motivate them to succeed academically, and help them better plan for their futures. Career exploration comes in many forms, including dedicated coursework, job shadowing, career counseling, and job-related project-based learning. Ohio wisely sets aside funds to support these types of initiatives, and it allows schools to use the dollars in a reasonably flexible way. However, little is known about how CTPDs actually allocate these funds to member schools, nor which specific programs the funds support. To shine light on this initiative, we recommend the following:
Work-based learning programs
Valuable technical training and career development can also happen outside of the classroom. To encourage more employer-led training, Ohio has launched work-based learning initiatives for high school students. Total annual investments for these programs are a modest $5.5 million per year.[26]
Recommendation
Work-based learning can provide the technical training and work experience that cannot be easily gained in a classroom. State policymakers should continue to support valuable workplace experiences for high school students, and we recommend the following:
CTE capacity-building initiatives
In the state’s FY 2024 and 2025 budget, lawmakers approved $300 million to help schools establish or scale in-demand IRC programs, particularly those that lead to credentials eligible for IWIP funding or support careers on Ohio’s “Top Jobs” list.[32] Of the total allocation, $100 million was set aside to help schools upgrade their CTE equipment (“Equipment Grant”) and $200 million was allotted to help schools expand or renovate the facilities used to provide CTE (“Construction Grant”). While future General Assemblies may choose to continue these initiatives, they were enacted as “one-time funding,”[33] and the construction program was funded with support from temporary federal COVID relief dollars.[34]
Table 7: CTE Equipment Grants awarded in 2024

While no specific recommendation on these initiatives is offered, as discussed earlier, just a small fraction of high school students attending urban district and charter schools attain IWIP credentials. One reason for the low attainment is that their schools may not offer the programming needed to support students seeking to earn them. Yet very little—just $3.5 million—of the $300 million capacity-building investment was allocated to Ohio Eight districts and charter schools. On the district side, only Canton and Columbus received an equipment grant, while just four Ohio Eight charters did so. No Ohio Eight districts or charters were awarded a construction grant. While it’s not clear whether this reflects schools not applying for grants or their applications being less competitive, the need to grow high-quality CTE programs that serve urban students remains (see above for a recommendation on that issue).
This section briefly summarizes federal initiatives that support CTE and workforce development programs for Ohio’s secondary students. The main federal law that governs and funds CTE is known as the Carl D. Perkins Career and Technical Education Act, the most recent iteration of which is commonly known as Perkins V. The other relevant federal legislation is the Workforce Investment Opportunity Act (WIOA). While mainly focusing on adult programs, WIOA has elements that support career development for young people, particularly disadvantaged youth.
Perkins V
At a national level, Perkins V provides approximately $1.5 billion per year for CTE programs in secondary schools and institutions of higher education. States distribute the bulk of Perkins funds—at least 85 percent—to schools and institutions that provide CTE programming. The remaining portion is set aside for state-level programs and administration. Under Perkins V, states must develop a statewide CTE plan, establish CTE “programs of study”—i.e., course sequences that lead to credentials—and create an accountability framework to gauge quality.
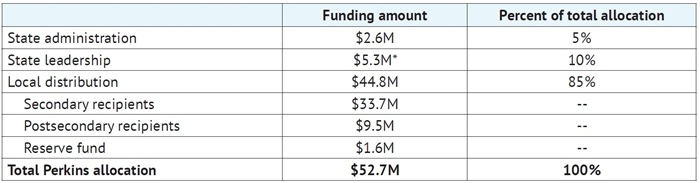
Ohio received $52.7 million though Perkins V in FY24.[39] As the table below indicates, a majority of these funds—about three fifths—is allocated directly to secondary schools that provide CTE, while the rest supports CTE in post-secondary institutions as well as state activities and administration. Federal law establishes the formula used to distribute Perkins dollars to local schools. This formula takes into account Census data on a district’s five-to-seventeen-year-old population, along with the number of children in that age range who are at or below the federal poverty level.[40] Perkins V also allows states to create a small reserve fund that can be used flexibly. Ohio spends these dollars via the Equity for Each grant,[41] a $1.6 million competitive grant aimed at helping special student groups access CTE programs.
Table 8: Breakdown of Ohio’s Perkins V allocations, FY24
Workforce Innovation and Opportunity Act (WIOA)
Most recently amended in 2014, WIOA is the nation’s primary workforce development legislation. While it mostly supports adults, it includes some funding for youth career development. The “youth activities” section of WIOA includes resources for at-risk youth—generally ages 16–24—who have dropped out of school or have another risk factor (e.g., pregnant or homeless). Just over one-third of Ohio’s total WIOA allocation goes toward youth development programs ($37.5 million in FY23).[42] A large majority of these funds is allocated to local workforce development boards, of which Ohio has twenty,[43] and are generally awarded by competitive grants to local youth-service organizations.[44] WIOA also supports the longstanding Job Corps program, which provides employment supports for disadvantaged youth ages 16–24.[45] The program is directly administered by the U.S. Department of Labor, and Ohio is home to Job Corps sites in Cincinnati, Cleveland, and Dayton. Nationally, $1.76 billion was spent in FY23 to operate 121 Job Corps centers across the nation.[46] While no site-based spending data was located, if one assumes each center spends the same amount, the three Ohio-based locations would have spent $44 million on career training for young people.
Creating a system that effectively readies 1.6 million public school students for the jobs of the future is a big lift. One piece in the puzzle is a funding system that incentivizes schools to provide the high-quality CTE and workforce training that put young people on pathways to rewarding careers. Thanks to the work of state leaders, Ohio is moving in this direction. By concentrating dollars to support quality CTE in high-demand career fields—and removing incentives for lower-level CTE—the state will make CTE work better for Ohio businesses, schools, and students.
I thank my colleagues at the Thomas B. Fordham Institute—particularly Mike Petrilli, Chester E. Finn, Jr., Chad L. Aldis, and Jessica Poiner—for their insightful feedback during the drafting process. I also wish to thank Cassandra Palsgrove of Ohio Excels, who reviewed an earlier draft of this report. Special thanks to Kathi Kizirnis for copy editing the document, and to Andy Kittles for laying out the report. Thanks also to my Fordham colleague Jeff Murray, who assisted with report distribution.
—Aaron Churchill
[1] For more about CTPDs, see ORC 3317.023 and Ohio Department of Education and Workforce, Ohio Perkins V Plan, 2024, p. 27.
[2] For more about JVSDs, see Ohio School Boards Association, Understanding Joint Vocational School Districts, 2020.
[3] Governor John Kasich, “State of the State Address—2014,” February 14, 2014, Medina Performing Arts Center, Medina, Ohio, 1:16:39.
[4] Governor Mike DeWine, “Governor DeWine’s 2023 State of the State Address,” January 31, 2023, Columbus, Ohio.
[5] CTE and workforce training at post-secondary institutions are not the focus of this report. CTE governance and accountability, as well as student participation and outcomes, are also not covered in this paper. For a primer on governance and delivery models, see Jessica Poiner, Ohio’s Career-Technical Education Landscape: An overview of CTE at the high school level, Columbus, Ohio, Thomas B. Fordham Institute, 2024. Forthcoming Fordham research will delve into participation and outcomes.
[6] The FTE method counts students taking one or two CTE courses during a year as “part-time” students (e.g., 0.25 FTEs). A more detailed discussion is found in the sidebar titled “A note on CTE enrollment” which is located in the “Total spending on CTE” section, navigable on the right side of this page.
[7] As of the writing of this report’s final draft, HB96 (as-introduced) is the most recent version of the budget.
[8] This level of expenditure data was obtained via request to Ohio Department of Education and Workforce. For more about the CTE spending categories, which are officially called “vocational instruction” expenditures, see Ohio Auditor of State, Uniform School Accounting System Manual, Columbus, Ohio, last revised 2023, (pp. 90–96).
[9] This method yields 259,149 students enrolled in CTE in FY23 (this count excludes some forms of CTE, such as students taking a family and consumer science or career intervention course). For more, see Ohio Department of Education and Workforce, Enrollment Technical Documentation, Traditional District and School, Dropout Prevention and Recovery, and CTPD Report Cards, 2023–2024 School Year.
[10] Another way of explaining it is that ten students taking one CTE course equals 1.0 FTE. For more about the methodology, see Ohio Department of Education and Workforce, Level 2 Report Explanation: CTE FTE Reports, last revised January 2024.
[11] A report by the national group Advance CTE examines states’ CTE expenditures on an FTE basis. See Advance CTE, The State of Career Technical Education: An Analysis of State Secondary CTE Funding Models, 2023.
[12] The difference in the total CTE expenditures discussed in the prior section ($718 million) versus the aggregate state-only funding amount reported here ($260 million) is explained by the use of local tax revenues to fund CTE, federal CTE funding, and schools’ use of general “base” state formula aid to support CTE. The $300 million in capacity-building investments would not have shown up in schools’ expenditures during FY23.
[13] Though not an official term, I use the terms “high-, mid-, and low-priority” as shorthand to describe the career fields in each funding category.
[14] More detail about career-based intervention is available at Ohio Department of Education, “Career-Based Intervention,” last accessed January 23, 2025.
[15] More detail about family and consumer science courses is available at Ohio Department of Education and Workforce, “Family and Consumer Sciences,” last accessed January 23, 2025.
[16] Eleven charter schools in Cleveland currently receive a portion of local taxpayer funds; Cleveland Metropolitan School District, “CMSD and Charter School Partnership,” last accessed January 23, 2025.
[18] For more about how IRCs factor into graduation requirements, see Ohio Department of Workforce, “Graduation requirements,” last accessed January 23, 2025. Schools receive state ratings based on graduation rates, and IRC attainment rates are reported on the state’s post-secondary readiness dimension of the report card (currently named “College, Career, Military, and Workforce Readiness”). For more, see Ohio Department of Education and Workforce, “Report Card Resources,” last accessed January 23, 2025.
[19] The career fields represented in the IWIP program are construction, engineering, education, health, law, IT, manufacturing, and transportation. All IWIP credentials have point values of at least six out of twelve possible points in Ohio’s IRC points system. For the current list, see Ohio Department of Education and Workforce, “2024–2025 Innovative Workforce Incentive Program Qualifying Industry-Recognized Credentials.” For the full list of IRCs and information about the IRC points system, see Ohio Department of Education and Workforce, “Industry-Recognized Credentials,” last accessed January 23, 2025.
[20] IWIP reimbursement data are posted on the Ohio Department of Education and Workforce’s school funding websites (Excel files titled “IWIP Payment”). Click here for traditional district information; click here for JVSD information; and click here for charter/STEM school information.
[21] All of the Ohio Eight districts are “comprehensive” CTPDs, which means they provide their own CTE programs for students (they are not members of a JVSD or “compact” CTPD).
[22] A significant portion of this total is represented by 407 Dayton Public Schools students who earned the Lean Six Sigma Greenbelt IWIP credential.
[23] Students must pass the credentialing assessment for their school to receive reimbursement.
[24] Initially, these funds were paid directly to districts and schools. However, legislators revised the statute to require the payment to be made to a CTPD. See Ohio Revised Code 3317.014(E/H).
[25] Ohio Legislative Service Commission, Greenbook: LBO Analysis of Enacted Budget, Department of Education and Workforce, August 2023, p. 35.
[26] Another work-based learning initiative is TechCred, which provides reimbursements to businesses whose employees earn a technology-based credential. While high school students can participate in TechCred, the program likely serves primarily adult workers. The state allocated $25.2 million for TechCred in FY24. For more about the program, see State of Ohio, “TechCred,” last accessed January 23, 2025.
[27] Ohio Controlling Board Requests (August 7, 2023) and ibid. November 13, 2023.
[28] Ohio Governor’s Office of Workforce Transformation, Annual Report, 2023, p. 11.
[29] Ohio Senate Bill 166 of the 134th General Assembly.
[31] Ohio Department of Taxation, Tax Expenditure Report: The State of Ohio Executive Budget for Fiscal Years 2024-2025, January 2023, p. 53.
[32] Ohio Governor’s Office of Workforce Transformation, “Ohio’s Top Jobs List,” last accessed January 23, 2025.
[33] Governor Mike DeWine, “Governor DeWine’s 2023 State of the State Address,” Columbus, Ohio.
[34] Ohio Facilities Construction Commission, “Ohio’s Career Technical Construction Program,” last accessed January 23, 2025. It’s unclear whether the Equipment Grant was funded through Covid-relief.
[35] Ohio Department of Education and Workforce, Career Technical Education Equipment Grant Program, Program Awardees.
[36] Ohio Department of Education and Workforce, Career Technical Education Equipment Grant Program, Round Two Program Awards.
[37] Ohio Facilities Construction Commission and Ohio Governor’s Office of Workforce Transformation, Career Technical Construction Program: Project Summary as of 11/2/2023.
[38] Traditional districts have access to the Classroom Facilities Assistance Program. The state administers a parallel construction grant program specifically for JVSDs.
[39] U.S. Department of Education, “Perkins Collaborative Resource Network,” last accessed January 23, 2025.
[40] Congressional Research Service, Strengthening Career and Technical Education for the 21st Century Act (Perkins V): A Primer, April 2022, pp. 7–8.
[41] Ohio Department of Education and Workforce, “Announcing latest Equity for Each grant awardees,” last accessed January 23, 2025.
[42] Ohio Legislative Service Commission, Greenbook: LBO Analysis of Enacted Budget, Department of Job and Family Services, August 2023, p. 32.
[43] Ohio Department of Job and Family Services, Workforce Innovation and Opportunity Act (WIOA)–Local Workforce System, October 2024.
[44] Congressional Research Service, The Workforce Innovation and Opportunity Act and the One-Stop Delivery System, September 2022, p. 22.
[45] Congressional Research Service, Job Corps: A Primer, August 2022.
[46] U.S. Department of Labor, FY2025 Department of Labor, Budget in Brief, p. 15.