
Last week, the U.S. Department of Education released data from the 2024 round of the National Assessment of Educational Progress (NAEP). “The news,” as one federal official put it, “is not good.” Grim indeed, as reading scores nationally continued a decade-long slide. Math results ticked up, but that’s compared to the rock-bottom scores registered just after the pandemic. Despite the billions spent by the federal government for academic recovery, math and reading achievement nationwide are still significantly below pre-pandemic levels.
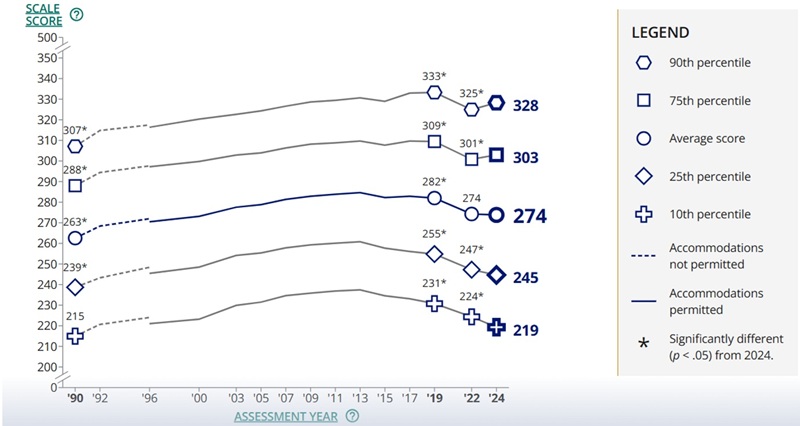
If this weren’t troubling enough, NAEP also reveals an alarming deterioration in the math and reading skills among the nation’s lowest-performing students. Consider the chart below. The top two lines show the scores of high-achieving students—those scoring at the 90th and 75th percentiles on NAEP. While their scores dipped during the pandemic, they have started to recover since then. However, scores of low-achieving students—at the 25th and 10th percentiles—not only fell during the pandemic but continued to decline in 2024. Looking more closely at the figure, we actually see that low-achieving students’ scores have steadily declined since 2013. This has occurred after a decade-plus of solid progress during the 1990s and early 2000s. (Chad Aldeman has a piece showing this trend more plainly.)
Figure 1: National scores on NAEP by achievement percentile, eighth grade math
The results have been widely covered in national publications, and have set off alarm bells among national policy wonks. But is Ohio suffering from the same ailment as the rest of the nation? The answer—unfortunately—is yes. In terms of overall student performance, Ohio’s results tracked closely with the dismal national patterns. And as the following charts show, the achievement of Ohio’s lowest-performing students has also worsened over the past decade.
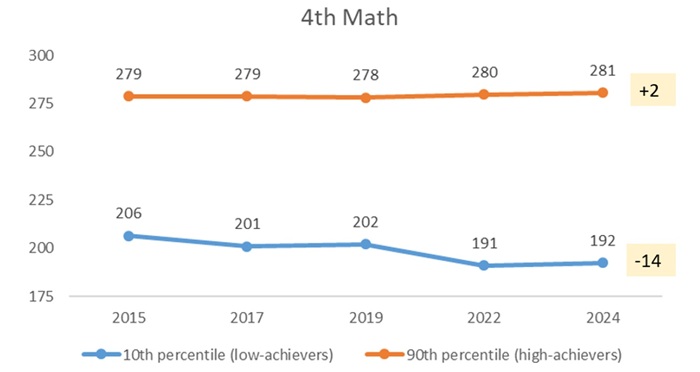
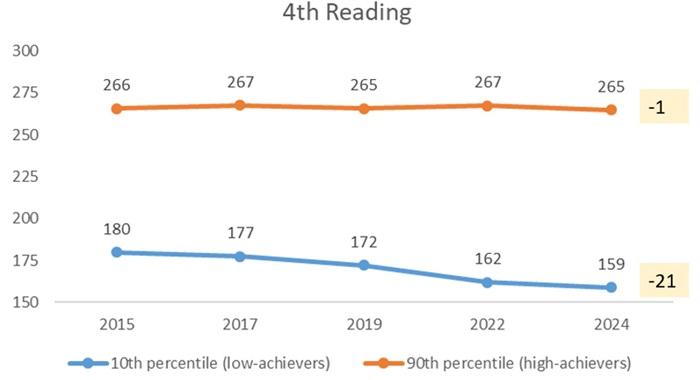
Starting in fourth grade, we see that the scores of Ohio’s highest-achieving students remained remarkably steady from 2015 to 2024. However, students at the bottom 10 percent in math suffered a fourteen-point loss during this period. To put that decline into some context, analysts view a ten-point change as roughly equivalent to a grade level. An even more startling trend emerges in reading, with low-achieving students’ scores plummeting twenty-one points over the past decade. This again stands in stark contrast to the one-point loss for high-achievers.
Figure 2: Ohio scores on NAEP by achievement percentile, fourth grade math and reading
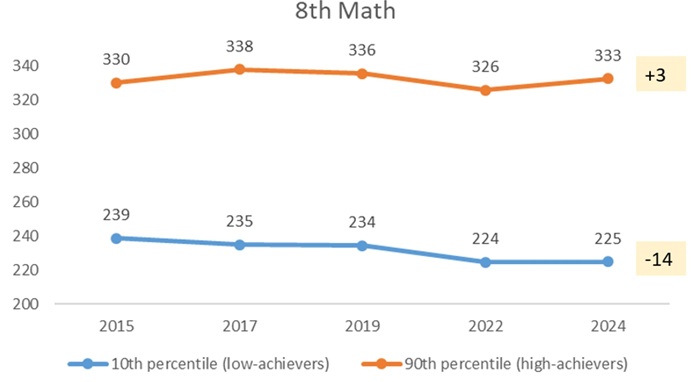
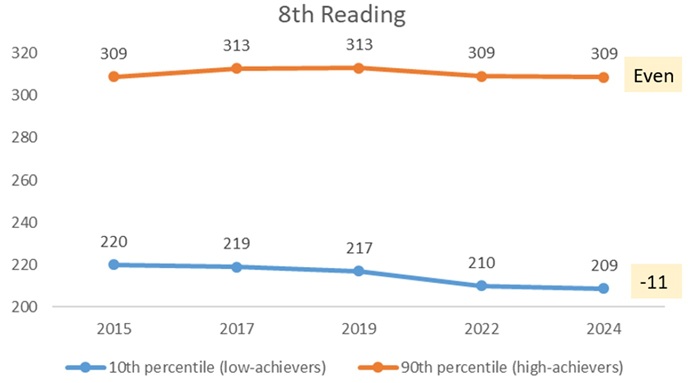
A similar story emerges in eighth grade. The scores of Ohio’s lowest-performing students declined fourteen and eleven points in math and reading, respectively, even as their high-achieving counterparts’ scores have held steady.
Figure 3: Ohio scores on NAEP by achievement percentile, eighth grade math and reading
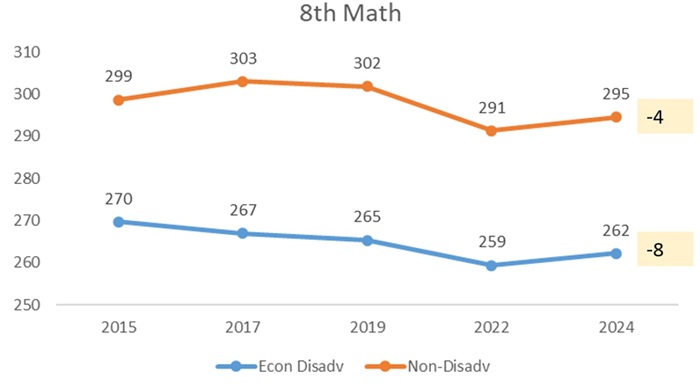
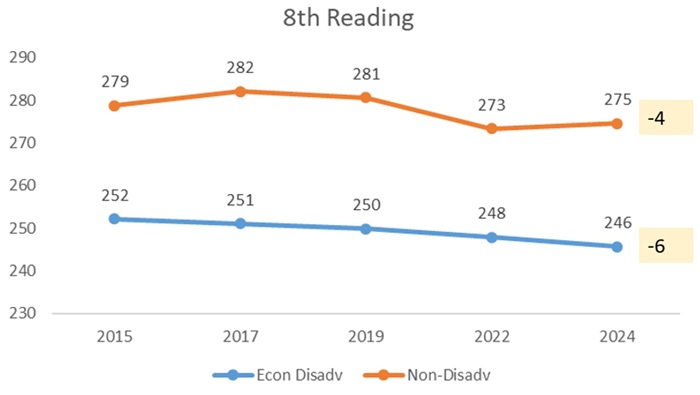
We don’t know which students exactly are represented in the bottom 10 percent in achievement. But given persistent achievement gaps based on socio-economic status, it’s likely that low-income students are overrepresented (though there are surely non-disadvantaged students in that decile). What do the trends look like for Ohio’s economically disadvantaged students? Figures 4 and 5 indicate that they have lost slightly more ground than their non-disadvantaged peers on all four NAEP exams from 2015 to 2024. In fourth grade reading, for instance, economically disadvantaged students lost nine points while their non-disadvantaged peers lost seven. To be sure, the declines for low-income students are not nearly as severe as for the lowest-performing students, likely reflecting the fact that economically disadvantaged students are represented across the entire achievement spectrum. Nevertheless, Ohio’s achievement gaps based on low-income status have somewhat widened over the past decade.
Figure 4: Ohio scores on NAEP by economically disadvantaged status, fourth grade math and reading
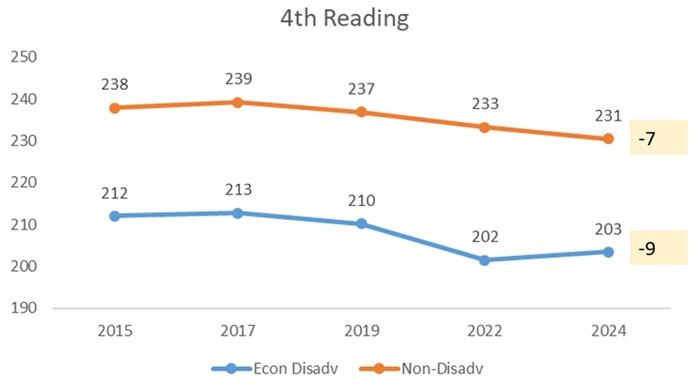
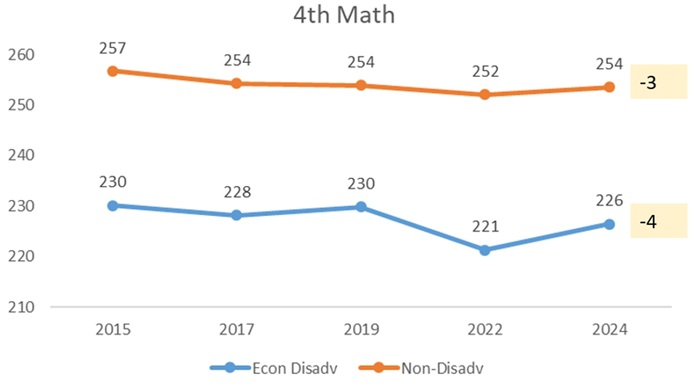
Figure 5: Ohio scores on NAEP by economically disadvantaged status, eighth grade math and reading
* * *
What is clear from these data is that struggling students today aren’t faring as well as in the past, and that unacceptably wide achievement gaps are growing. What’s less clear is why exactly this is happening. Increasing screen time, a shift in focus away from academics, the disproportionate impacts of the pandemic, soaring absenteeism, and softening accountability are all likely culprits. Whatever the case may be, the direction that state leaders go from here will impact the lives of thousands of Ohio students. Will they stick their heads in the sand and pretend like these academic troubles don’t exist? Or will they answer the call—as policymakers elsewhere have done—and turn the tide on the sinking achievement of Ohio’s most at-risk students?