Mobile Navigation

  • National
    • Policy
      • High Expectations
      • Quality Choices
      • Personalized Pathways
    • Research
    • Commentary
      • Gadfly Newsletter
      • Flypaper Blog
    • Events
    • Scholars Program
  • Ohio
    • Policy
      • Priorities
      • Media & Testimony
    • Research
    • Commentary
      • Ohio Education Gadfly Biweekly
      • Ohio Gadfly Daily
  • Charter Authorizing
    • Application
    • Sponsored Schools
    • Resources
  • About
    • Mission
    • Board
    • Staff
    • Career
Home
Home
Advancing Educational Excellence

Main Navigation

  • National
  • Ohio
  • Charter Authorizing
  • About

Ohio Menu

  • Topics
    • Accountability & Testing
    • Advanced Education
    • Career & Technical Education
    • Charter Schools
    • Curriculum & Instruction
    • ESSA
    • Evidence-Based Learning
    • Governance
    • Personalized Learning
    • Private School Choice
    • School Finance
    • Standards
    • Teachers & School Leaders
  • Research
  • Policy
  • Commentary
    • Ohio Gadfly Newsletter
    • Ohio Gadfly Blog
    • Events

The Education Gadfly Weekly

Sign Up to Receive Fordham Updates

We'll send you quality research, commentary, analysis, and news on the education issues you care about.
Thank you for signing up!
Please check your email to confirm the subscription.

Ohio Education Gadfly Biweekly--Volume 13, Number 6

Volume 13, Number 6
3.15.2019
3.15.2019

Ohio Education Gadfly Biweekly--Volume 13, Number 6

Volume 13, Number 6
view
School Funding

Highlights from Governor DeWine’s K–12 education budget

On Friday, Ohio Governor Mike DeWine released his state budget proposals for fiscal years 2020–21. While we await the detailed policy language that will come when his budget is put into bill form in the General Assembly, his outline doesn’t offer much in the way of surprises.

Aaron Churchill 3.15.2019
OhioOhio Gadfly Daily

Highlights from Governor DeWine’s K–12 education budget

Aaron Churchill
3.15.2019
Ohio Gadfly Daily

ADCs aren't perfect, but they prove that accountability pressure works

Jessica Poiner
3.12.2019
Ohio Gadfly Daily

A sobering reality: A look at the districts where the highest percentage of students used alternative pathways to graduate

Jessica Poiner
3.11.2019
Ohio Gadfly Daily

A Fair Chance: Simple steps to strengthen and diversify the teacher workforce

Jessica Poiner
3.18.2019
Ohio Gadfly Daily

The truth about transportation troubles

Jeff Murray
3.13.2019
Flypaper

Four things to look for in Governor DeWine’s education budget

Aaron Churchill
3.8.2019
Ohio Gadfly Daily

Tackling Ohio’s toughest education challenges: Develop teacher residencies

Ohio Education Gadfly
3.4.2019
Ohio Gadfly Daily

Tackling Ohio’s toughest education challenges: Incentivize schools to help students earn high-value industry credentials

Ohio Education Gadfly
3.8.2019
Ohio Gadfly Daily
view

ADCs aren't perfect, but they prove that accountability pressure works

Jessica Poiner 3.12.2019
Ohio Gadfly Daily
view

A sobering reality: A look at the districts where the highest percentage of students used alternative pathways to graduate

Jessica Poiner 3.11.2019
Ohio Gadfly Daily
view

A Fair Chance: Simple steps to strengthen and diversify the teacher workforce

Jessica Poiner 3.18.2019
Ohio Gadfly Daily
view

The truth about transportation troubles

Jeff Murray 3.13.2019
Flypaper
view

Four things to look for in Governor DeWine’s education budget

Aaron Churchill 3.8.2019
Ohio Gadfly Daily
view

Tackling Ohio’s toughest education challenges: Develop teacher residencies

Ohio Education Gadfly 3.4.2019
Ohio Gadfly Daily
view

Tackling Ohio’s toughest education challenges: Incentivize schools to help students earn high-value industry credentials

Ohio Education Gadfly 3.8.2019
Ohio Gadfly Daily
view

Highlights from Governor DeWine’s K–12 education budget

Aaron Churchill
3.15.2019
Ohio Gadfly Daily

On Friday, Ohio Governor Mike DeWine released his state budget proposals for fiscal years 2020–21. While we await the detailed policy language that will come when his budget is put into bill form in the General Assembly, his outline doesn’t offer much in the way of surprises. For some that will come as a relief, for others disappointment.

First thing’s first: Governor DeWine didn’t propose an overhaul of the school funding formula—the mechanism used to allocate state money to districts—which is likely a good thing, as he’s been in office barely two months. His budget proposes reasonable though modest increases in K–12 outlays. Overall, the administration recommends expenditures on primary-secondary education totaling $11.7 and $11.8 billion over the next biennium, a 3.2 percent increase over this year’s estimated $11.3 billion. These totals include federal funds administered by the state education agency, such as Title I and IDEA, but exclude local taxpayer dollars dedicated to education. When considering state-only general revenue funds, spending on K–12 education rises by 3.9 percent in FY 2020 relative to 2019.

That’s the big picture, but several commendable proposals are also worth highlighting. Let’s look at four of them.

Additional resources for high-poverty schools. In his State of the State address, Governor DeWine pledged more state money to support the needs of disadvantaged students. His budget delivers on that promise by recommending an extra $250 million per year in state funding that would be allocated to schools (including districts, charters, and career-tech centers) based on U.S. Census poverty estimates.  Since there is no current formula component that drives money to schools based on census data, this would likely entail the creation of a new formula element. His proposal indicates that certain uses of these new funds will be “encouraged”—things like wraparound services or tutoring—but we’ll have to wait for the actual budget bill language to see whether there are any requirements around spending these dollars.

Continuing the expansion of the income-based EdChoice scholarship. Starting in 2013–14, Ohio launched a private-school scholarship program open to any low-income student in the state. It has been phased in gradually, one grade at a time, with incoming kindergartners eligible in the first year. Students in grades K–5 are now eligible, and during the 2017–18 school year almost 10,000 youngsters availed themselves of these opportunities. To his credit, Governor DeWine opted to continue the implementation of income-based EdChoice, and his budget allows eligible sixth and seventh graders to access scholarships over the next two years.

Incentivizing the attainment of industry-recognized credentials. As of 2017–18, less than 5 percent of Ohio students left high school with valuable industry credentials that can open doors to rewarding, good-paying careers. Recognizing the need to boost the technical capabilities of more Ohio graduates, the DeWine budget calls for $25 million per year in new spending dedicated to in-demand industry credentials for high school students. His proposal doesn’t offer great detail about how the program will work, but it’s great news that new resources would be available for schools that are successful in helping young people earn credentials.

New funding for quality charter schools. Here at Fordham we have carefully documented the alarming funding shortfalls facing the state’s public charter schools. Over fiscal years 2015–17, urban charters received a staggering $253 million less per year than nearby school districts. Disparities of this size have resulted in an inhospitable environment for even the best and most effective charters to expand and serve more students in dire need of an excellent education. To help bridge this gap, Governor DeWine has proposed an additional $30 million per year for top-performing charters. While we believe that all brick-and-mortar charters should be funded equitably, this injection of new resources will hopefully kick-start the development of new, quality charter schools after years of stagnant growth. Hats off to Governor DeWine for recognizing the positive impact of great charter schools, especially for needy children. And here’s hoping that the legislature concurs.

***

Kudos to Governor DeWine and his team for their work crafting the executive budget. It contains several exciting initiatives well-deserving of our support. If schools can leverage these new, targeted resources in the right ways, Ohio students stand to benefit.

view

ADCs aren't perfect, but they prove that accountability pressure works

Jessica Poiner
3.12.2019
Ohio Gadfly Daily

In an article published on March 5, Bill Bush of the Columbus Dispatch wrote that Columbus City Schools plans to target key areas of their state report card where “modest gains could push grades up” and “help avoid state takeover.”

For those unfamiliar with what “state takeover” means in Ohio, the phrase refers to Academic Distress Commissions (ADCs)—a mechanism in state law for intervening in low-performing school districts that was first put into law in 2005 and significantly strengthened in 2015. Since the updated policy took effect, there has been no shortage of drama. That’s largely because the law includes provisions that lessen the power of the local school board, empower an ADC-appointed CEO, and offer opportunities for expanded school choice—policies that are anathema to those who prioritize the status quo above all else. Political infighting has dominated the turnaround efforts in both Youngstown and Lorain, the two districts that have been under the auspices of an ADC after decades—yes, decades—of poor academic performance. Meanwhile, districts that are teetering on the brink of state control are suing, complaining, and objecting like their lives depend on it. And in many ways they do. ADC control changes which adults get to call the shots.    

There are some valid questions being raised about how to improve the current ADC model. The Ohio Department of Education’s hands-off approach hasn’t worked well thus far. The department’s involvement has been limited to the state superintendent appointing three members of the ADC and the commission chair. That’s vastly different from the strategy of states like Massachusetts, where turnaround efforts have been more successful. Having two governing bodies—the local school board and the ADC—in place and at odds isn’t helping, and neither is the lack of rigorous, empirical research into what’s happening on the ground. Any sort of nuanced debate about what’s happening and how to improve it has gotten lost amidst media theatrics and adults squabbling over power. So, too, has the reason why ADCs were created in the first place: Students deserve to attend high-quality schools, and the state has an obligation to intervene when students aren’t being served well.

Which brings us back to the article from the Dispatch. It’s noted that one of Superintendent Talisa Dixon’s strategies for boosting Columbus City Schools’ overall grade is to focus on the five-year graduation rate. Specifically, the district will “zero in on providing additional support to 125 students who should have graduated last year, but repeated twelfth grade and can still graduate this summer.” Comments from the district’s chief accountability officer, Machelle Kline, offer additional context: “Some students need credits. Some students just need tests. Some students need internship hours. We have one kid who’s completely done, just doesn’t have their internship hours. Can you imagine how silly that is?”

It is silly. It’s silly that these 125 students are about to be inundated with support just because they’re the district’s last hope for avoiding a takeover. Where was the guidance, remediation, and intervention these students needed during their first twelve years in the system? If Columbus City Schools wasn’t in danger of being taken over by the state, would the district still be “zeroing in” on these students to make sure they graduate?

Similar questions can be asked of other districts that are hurtling toward an ADC designation and have responded by ramping up their efforts (finally) to serve kids better. In Dayton, the focus has been on high-quality professional development for its teachers. In Trotwood-Madison, the district proactively implemented aspects of an ADC-style turnaround plan and successfully staved off an academic distress designation by boosting just a few measures on their state report card. Would these efforts have occurred with the same urgency and intensity if the threat of accountability wasn’t looming? Or would districts have bemoaned their low scores in public, philosophized about the fairness of their rating, and then continued on with business as usual?

Warts and all, the ADC process is succeeding in prodding districts like Columbus City Schools, Trotwood-Madison, and others to do what’s right by kids, and that’s what school accountability policies are all about. They’re designed to incentivize districts to carefully consider data on student outcomes and then improve for the sake of kids.

It’s okay to disagree about the nuts and bolts of ADCs. There can and should be a debate about the method of intervention. But there should be no question about the necessity of accountability mechanisms that encourage struggling districts to improve. Students in those places deserve the very best and nothing less.  

view

A sobering reality: A look at the districts where the highest percentage of students used alternative pathways to graduate

Jessica Poiner
3.11.2019
Ohio Gadfly Daily

One of the defining characteristics of Ohio’s graduation debate is a lack of data. Back in 2017, when the State Board of Education first suggested weakening graduation requirements, its recommendations were made without clear and detailed data indicating a need for such sweeping changes. Even worse, the alternatives they endorsed included non-academic measures such as work or community service experience and 93 percent attendance during senior year. When these weakened alternatives were made into law for the class of 2018, it marked the first time in twenty-five years that Ohio students could earn a diploma without demonstrating some level of objective academic competence. 

Almost a year and a half later—six months after the class of 2018 walked across the stage—the Ohio legislature passed a bill that extended the weakened requirements to the classes of 2019 and 2020. At the time of the vote, the public still didn’t know how many students in the class of 2018 used the alternative pathways to graduate. It wasn’t until the December state board meeting—a few days after the legislature approved the extension—that data about students using the alternative graduation pathways were released. This delay was unfortunate, as it could have informed the debate and may have ultimately swayed some votes.

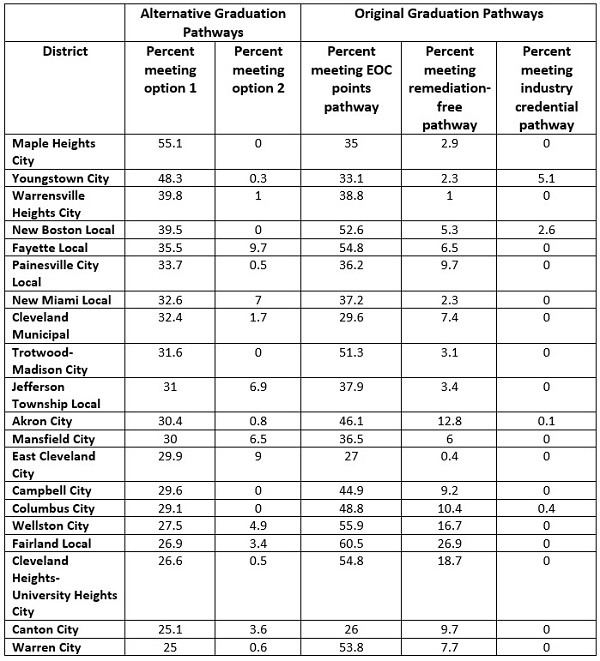
These data show the percentage of students in each district who graduated by meeting one of the original three pathways—end of course (EOC) exam points, remediation-free ACT or SAT scores, or industry-recognized credentials—or one of two additional pathways that were labelled “Option 1” and “Option 2.” Option 2 was limited to students in career-technical programs, but option 1 included the weakened alternative measures and was available to all students.

The table below lists the twenty districts with the highest percentage of students using option 1 to graduate in 2018. It also includes the percentage of students using option 2 and each of the three original pathways. It’s important to note that among the original pathways, some students met multiple ones and thus are included in more than one column. For instance, a student who met both the EOC and remediation-free requirements would be included in both statistics. The percentages listed for options 1 and 2, on the other hand, are mutually exclusive; students who are reported as having met these options met only one of those two pathways and not any of the original three.

Grad pathways chart 1

We can draw a few conclusions from these data. First, all of these districts had at least a fourth of their graduating class take advantage of the weakened alternatives to graduate. Some of them—like Fairland Local and Wellston City—had a majority of their students demonstrate basic academic competency by passing EOC exams. But other districts, like Cleveland Municipal and East Cleveland, had more students graduate using the alternative pathways than they had students passing state exams. When considering these numbers, it’s important to remember that students do not need to score proficient on all of the exams to use them to graduate. In fact, it’s mathematically possible for a student to fail to earn proficiency on all four math and English EOCs and still earn enough points to graduate.

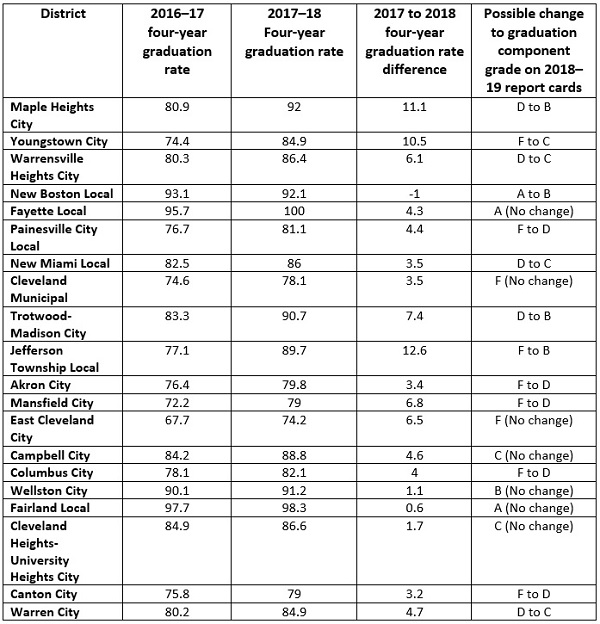
Second, some districts will likely see significant increases to their graduation rates because of the high number of students who took advantage of the weak alternatives. Since the state accountability system calculates grades for the graduation rate component on a one year delay, increases for the class of 2018 would result in improved graduation rate grades on 2018–19 school report cards. Check it out:

Grad Pathways chart 2

Based on these projections, only one of the twenty districts will earn a lower graduation rate component grade in 2018–19: New Boston Local, which may drop from an A to a B. Seven districts will see no change in their grades. But twelve districts could get higher grades this year than they did last year. Seven of those twelve will rise from an F to a passing grade, and at least two districts—Maple Heights and Trotwood-Madison—will jump from a D to a B. Since the graduation rate component counts for 15 percent of a district’s overall grade, a suddenly higher graduation rate grade could mean that some of these districts avoid overall Fs—which could help them sidestep being placed under the authority of an academic distress commission.

The outsized impact of these watered down requirements on school report cards should give lawmakers pause. Several of the districts with dramatically higher graduation numbers have a history of much lower rates, so it will be tempting to celebrate the higher figures as signs of growth. Doing so would be a mistake. The only reason many of these districts will have higher rates is because the state codified much easier graduation pathways into law. Lowering the bar and getting better results is not cause for celebration, and it’s not good policy. The basis of good policy and meaningful school improvement is data that are both honest and timely. So far, Ohioans haven’t been given either.

view

A Fair Chance: Simple steps to strengthen and diversify the teacher workforce

Jessica Poiner
3.18.2019
Ohio Gadfly Daily

Each year, teacher candidates across the nation take licensing exams designed to check their mastery of pedagogy and of content knowledge. Though each state selects its own licensing tests, the Praxis Elementary Education: Multiple Subjects assessment, created by the Education Testing Service (ETS), is the most widely used elementary content exam. It’s required in eighteen states and optional in five others.

In a new report, the National Council on Teacher Quality (NCTQ) examines never-before published data from ETS to identify initial and final passing rates for this exam. Teaching candidates are required to separately pass each of the four content area subtests: reading/language arts, math, science, and social studies. Only 46 percent of candidates passed all four subjects on their first attempt, which the report authors flag as being very low. In comparison, initial passing rate for licensure exams in other professions with a reputation for difficult entry exams is much higher: 69 percent for lawyers, 85 percent for nurses, and 90 percent for doctors of internal medicine. The final pass rate for the Praxis exam is higher—72 percent—but that doesn’t take into account the time and cost of retakes.

A demographic breakdown of final pass rates also reveals significant gaps between candidates of color and their white peers. While 75 percent of white candidates go on to pass all four subjects, only 57 percent of Hispanic candidates and 38 percent of Black candidates do the same. There are similar gaps in passage rates for each of the subtests. Based on these results, and assuming similarly disparate pass rates for the other tests used by all states, NCTQ estimates that approximately 8,600 candidates of color each year likely do not qualify to teach based on low test performance. Given research that shows students benefit from having teachers of the same race, it should worry policymakers and advocates that so many candidates of color are failing licensure exams.

But why are so many candidates—more than half overall—struggling so mightily to pass their licensing tests on their first try? There are a variety of issues at play, but a lack of alignment between how candidates are prepared and what they need to know to pass licensing tests could be a significant factor. NCTQ claims that elementary teachers need to master at least eleven core topics in four content areas to be prepared to meet teaching requirements. But based on data collected from undergraduate elementary teacher preparation programs at 817 institutions that account for 71 percent of such programs in the nation, they find that each on average covers just three of those eleven topics.

Another part of the problem is that too few undergraduate teacher preparation programs identify candidates’ knowledge gaps early enough. Most require candidates to be formally admitted, typically before a candidate’s junior year of college. Screening candidates prior to admittance would allow universities to address gaps in candidate knowledge by requiring additional coursework. Unfortunately, only 4 percent of the 817 programs screen candidate knowledge in at least one area.

Most institutions also do very little to ensure that the general education courses taken by candidates are relevant to both the licensing test and the daily demands of being an elementary teacher. While the parameters of some programs are too narrow (i.e., a history course that only focuses on one decade in American history), others are too broad (such as a course that covers multiple scientific disciplines in one semester), and still others focus on pedagogy rather than content.

To make matters worse, data reporting practices are also suspect. NCTQ notes that many teacher preparation programs only publicly report passing rates for completers—candidates who have finished their coursework and passed the appropriate licensing exams. This gives the public a skewed view of how many test-takers pass on their first attempt, and explains why the rates reported by programs are so much higher than the data provided in this report.

The authors are careful to note that they can’t prove the correlation between coursework and pass rates. They also point out that strengthening college course requirements isn’t a silver bullet, and that the fault for candidates’ gaps in content knowledge lies with the “inequitable or uneven” K–12 education sector and not teacher preparation programs. Nevertheless, they are “confident that requiring meaningful exposure to relevant content” during teacher training will be a key element of diversifying and strengthening the teacher workforce moving forward.

The report closes by offering a series of recommendations to both teacher preparation programs and state policymakers. These include using admissions processes to identify candidates’ weaknesses in content knowledge, aligning content course requirements with what elementary teachers need to know, and holding preparation programs accountable for low pass rates rather than abandoning licensing tests all together.

SOURCE: Hannah Putman, Kate Walsh, “A Fair Chance: Simple steps to strengthen and diversify the teacher workforce,” National Council on Teacher Quality (February 2019).

view

The truth about transportation troubles

Jeff Murray
3.13.2019
Flypaper

If you think that student transportation is tricky for school districts—and there are  numerous sources broadcasting that message—try being a kid or a parent. Access to that yellow bus can make or break the success of school choice in a given city or region. New research from the Baltimore Education Research Consortium (BERC) adds more evidence to the growing pile that shows that old ways of managing school transportation are inadequate for education, and especially to support choice, in the twenty-first century.

Authors Julia Budick-Will, Mark L. Stein, and Jeffrey Grigg look into the travails of students in Baltimore with a study ominously titled “Danger on the Way to School,” published in the journal Sociological Science last month. It provides a stark though sometimes exaggerated picture of what high school students in Baltimore City Public Schools endure just to arrive on time, and the potentially high costs to them to do so. All Baltimore district high schools are schools of choice, and the district provides free public transit passes (city buses and two separate rail systems) rather than traditional yellow bus service for high schoolers living more than 1.5 miles from their school. The universal-choice structure in Baltimore is characterized as a complicating factor in the BERC analysis, but it is ultimately helpful for putting the local results into a wider context.

Baltimore experienced an uptick in its crime rates across the city in 2014 and 2015, and based on previous findings, the BERC research team hypothesized that the levels of violence experienced in different parts of the city could affect school attendance; the more violent crime reported in the areas through which students travel, the more likely they would be to miss school.

The data, which included 4,200 first-time freshmen during the 2014–15 school year, bore this out. The average student in the study attended school in a neighborhood where eighty-seven violent crimes were reported during the academic year but lived in a neighborhood where ninety-five violent crimes were reported during the same period. Students passed streets in transit vehicles where there were forty-one violent crimes during the school year, on average, and passed streets on foot where there were twenty-seven violent crimes.

The researchers hypothesized that higher rates of absenteeism would correlate with high-crime areas at or near the places where students were commuting outside of vehicles—walking from home to a bus stop, changing modes of transit outdoors, etc. The average student traveled thirty-six minutes from home to school with an average of 1.8 stops per trip, meaning that most students had at least two points at which they were commuting on foot every day.

While exposure to dangerous streets while riding in a public transit vehicle did not correlate with absenteeism, nor did exposure to high-property-crime streets—as opposed to those with high rates of violent crime—exposure to high-crime areas while commuting on foot did correlate with the absenteeism data. On average, a 1 percent increase in walking violence exposure predicted a 0.10 percent increase in absenteeism, or 1.9 additional missed days, on average. These results remained after adjusting for student demographics, prior attendance, violent crime around homes and schools, and unobserved differences related to school preference and neighborhood selection.

On the upside, all 4,200 students in the study persevered and remained in their chosen high school for the full year despite their dangerous commutes. On the downside, an additional 2,160 students were excluded from the final analysis because they did not persevere. Their reasons for switching schools were not included, which is unfortunate because their experiences would surely be telling. The limited data provided on those students ultimately excluded raise questions about the interplay between transportation and a successful school choice infrastructure far above the safety factor germane to the study. Additional issues to consider along with the results: the hypothetical nature of the routes to school used in the study; the assumed level of “danger” perceived by students traveling in daylight through areas where violent crime only happens at night; the researchers’ assumption of stress and trauma in kids due to reported crime; and the lack of inclusion of students utilizing choice via charters and private schools.

Ultimately, the effects of student commuters’ exposure to street-level violence is just one more piece of evidence that existing public transit systems—designed to bring adults from home to work centers, still via twentieth-century travel patterns—are inadequate for school transportation. These systems are forbidden by federal law from changing to adapt to student needs and should not be seen as anything more than a Band-Aid fix for the ills of district-based busing. In an age of high demand for school choice in cities—and increasingly in exurban and suburban areas, as well—the evidence in favor of scratch-built and separately-funded student- and family-centric transportation from door to door, regardless of school governance type, could not be clearer.

SOURCE: Julia Budick-Will, Mark L. Stein, and Jeffrey Grigg, “Danger on the Way to School: Exposure to Violent Crime, Public Transportation, and Absenteeism,” Sociological Science (February 2019).

view

Four things to look for in Governor DeWine’s education budget

Aaron Churchill
3.8.2019
Ohio Gadfly Daily

Governor Mike DeWine is expected to release his biennial budget proposal next week, which will include his plan to fund education. On the campaign trail—and during his short time in office—DeWine has dropped relatively few hints about his agenda for K–12 education. Apart from pledges to increase spending on early childhood programs, there’s not much that would help us predict the details of his education budget. With that in mind, I’ll be diving into these key (albeit wonky) questions when he unveils his proposals.

Will there be changes to the school funding formula?

Under former Governor John Kasich, Ohio wisely moved away from an input-driven funding formula to a more conventional approach predicated on pupil enrollment, district wealth, and weights for children with special needs. To ensure a fair distribution of state aid, Kasich’s formula relies heavily on the “state share index” (SSI). The SSI computations take into account districts’ incomes and property values, yielding results that generally direct more aid to lower-wealth districts. Although a certain level of complexity is needed to fairly split the tab between the state and local districts, there may be some room to streamline the SSI without compromising its ability to drive money to where it’s most needed. In a preview of the much anticipated Cupp-Patterson funding report, it appears that some legislators are concerned about the intricacies of the SSI and might be open to modifications that produce a simpler, more predictable formula. Governor DeWine, however, has said little about the funding formula. It’ll be worth watching whether he proposes any tweaks to the SSI—or puts forward an entirely different distribution model. 

More money for high-poverty schools...but with strings attached?

In his State of the State address, Governor DeWine promised:

We are going to direct significant state resources to Ohio’s most-in-need children to help them overcome the barriers and disadvantages of poverty and trauma...and that is why—through targeted funding in my budget—these kids will receive additional resources for mentoring, after-school programs, wrap-around services, health care, mental health care, and much, much more.

Clearly, there will be more funding for schools and other providers that serve needy children—and that’s praiseworthy. More interesting, however, will be how these targeted funds are disbursed to schools. Will it be more money-driven through the funding formula itself? For instance, there is an existing component that provides public schools with additional funds based on economically disadvantaged student enrollments. DeWine’s plan could simply boost those amounts. Another possibility is a targeted grant program that is open to high-poverty schools. But either way, DeWine seems to suggest that strings might be attached; note his remarks about specific uses for these funds like mentoring or after-school programs. If indeed there are restrictions, what might those look like? Will high-poverty districts, for example, be obligated to spend these dollars in certain ways, or will they have greater spending flexibility? And what about high-poverty charter schools?

Will funding caps and guarantees be addressed?

Rightly so, one of Governor Kasich’s school funding goals was to remove “caps and guarantees.” As a quick refresher: The cap limits the yearly growth in state funding that districts receive, while a guarantee ensures that a district doesn’t receive less in state aid compared to some prior year. Because these policies result in many districts receiving amounts that differ from the formula, the Kasich administration argued time and again that these policies gave too much money to some districts and stiffed others. Unfortunately, the administration’s efforts to remove caps and guarantees were largely unsuccessful. Both policies are difficult to unwind for various reasons: Although they are likely losing enrollments, districts on the guarantee are apt to complain about cuts to their state funding. Meanwhile, removing caps poses budgetary challenges for the state because it would cost hundreds of millions to provide full-formula funding to capped districts. Whether Governor DeWine will support eliminating caps and guarantees is unclear. But if he does, it’ll be interesting to see how his administration tries to navigate the potholes that have derailed previous attempt to scrap these policies.

Will public charter schools finally receive equitable funding?

In contrast to Governor Kasich, who once called school choice a “civil right,” Governor DeWine has been relatively quiet on the school choice front. That’s prudent given the ongoing political attacks on charters and the bruising battle to close ECOT. But DeWine has pledged to create a “more equitable funding system,” which should certainly include public charter schools just the same as school districts. Sadly, however, much work remains to fund charters equitably. As we at Fordham have documented, urban brick-and-mortar charter schools remain egregiously underfunded—receiving roughly $4,000 per student less than their nearby districts—all while delivering an arguably better education than students’ district alternatives. Will his budget rectify these massive funding shortfalls? One hopes the answer is yes.

* * *

It’s hard to know how the DeWine administration will handle important matters such as these. But if history is our guide, we can at least predict two reactions to his proposals. First, the focus will inevitably be on the “winners and losers,” without much context about why districts might receive more or less compared to prior years. Indeed, some districts may receive less state aid simply because of declining enrollments, while others, like those in Central Ohio, receive more as their student bodies swell. Second, no matter the amount of funding dedicated to K–12 education, there will be interest groups decrying that it’s not enough. To paraphrase Michael Buffer, let’s get ready to grumble.


view

Tackling Ohio’s toughest education challenges: Develop teacher residencies

Ohio Education Gadfly
3.4.2019
Ohio Gadfly Daily

Editor’s Note: Back in September 2018, awaiting the election of our next governor, we at the Fordham Institute began developing a set of policy proposals that we believe can lead to increased achievement and greater opportunities for Ohio students. This is one of those policy proposals.


With Mike DeWine sworn in as Ohio’s 70th governor, and with his administration now well underway, we are proud to roll out the full set of our education policy proposals. You can download the full document, titled Fulfilling the Readiness Promise: Twenty-five education policy ideas for Ohio, at this link, or you can access the individual policy proposals from the links provided here.

Proposal: Provide funding to support districts and charter networks that seek to create teacher-residency programs in partnership with institutions of higher education. Because residencies train nontraditional candidates, they should also relax teacher-licensing statutes to allow districts to hire individuals who have degrees outside of education.


Background: Ohio schools employ over 100,000 teachers, the majority of whom were trained in traditional teacher-preparation programs housed in colleges or universities. Ohio also offers a couple of alternative routes for nontraditional candidates via the Intensive Pedagogical Training Institute or the highly selective Teach For America program. Together, these traditional and nontraditional routes fill many of the staffing needs of schools, but significant voids remain. In other parts of the country, teacher-residency programs have been launched to address such needs. They provide in-depth clinical experiences to new recruits—typically early- to mid-career professionals—before they take on full teaching responsibilities. The residency programs are generally close partnerships between K–12 schools and local institutions of higher education. The schools pair new recruits with experienced mentors who support their hands-on classroom experience; local colleges sometimes provide coursework. Research on residencies shows they can attract talented individuals into high-need schools and in-demand subjects, improve the diversity of the profession, and support retention. In a 2016 Learning Policy Institute paper, just one teacher-residency program was found in Ohio—developed by the Cleveland-based Breakthrough Network of charter schools in partnership with Ursuline College and John Carroll University.[1]


Proposal rationale: Residency programs prioritize clinical experience in the classroom—a learning-by-doing approach rather than a conventional paper-credentials model. Such programs are a promising way to draw nontraditional or mid-career candidates into the profession, especially in hard-to-staff subjects and schools.


Cost: The state could budget $10 million per year to create a grant program that would support the planning and implementation of teacher-residency programs. Depending on the specific residency model and what expenses are subsidized—for example, tuition, residents’ salaries, or stipends for mentors—this amount should support the training of approximately 100 to 250 residents (nationally, the cost per resident ranges from $35,000 to $85,000, which may include the resident teachers’ salaries).


Resources: For overviews of teacher residencies, see the 2016 Learning Policy Institute report The Teacher Residency: An Innovative Model for Preparing Teachers by Roneeta Guha and colleagues and the National Center for Teacher Residencies’ “About The Residency Model.” For data on residency costs, see Sara Morris and Marisa Bier’s article “This may be the best way to train teachers—and yes, we can afford it” in the Hechinger Report (2016). For an overview of Breakthrough’s residency program, see “Cleveland Urban Teacher Residency,” and for more information on teaching requirements in Ohio, see Jessica Poiner’s policy brief “Pathways to Teaching in Ohio,” published by the Fordham Institute (2015).


[1] The “residencies” discussed here are not related to Ohio’s Resident Educator Program, a state-required development program for beginning teachers trained in traditional education schools.

view

Tackling Ohio’s toughest education challenges: Incentivize schools to help students earn high-value industry credentials

Ohio Education Gadfly
3.8.2019
Ohio Gadfly Daily

Editor’s Note: Back in September 2018, awaiting the election of our next governor, we at the Fordham Institute began developing a set of policy proposals that we believe can lead to increased achievement and greater opportunities for Ohio students. This is one of those policy proposals.


With Mike DeWine sworn in as Ohio’s 70th governor, and with his administration now well underway, we are proud to roll out the full set of our education policy proposals. You can download the full document, titled Fulfilling the Readiness Promise: Twenty-five education policy ideas for Ohio, at this link, or you can access the individual policy proposals from the links provided here.

Proposal: Create an incentive fund to encourage traditional districts, regional joint-vocational centers, charter and STEM schools, or community and technical colleges (via dual enrollment) to help high school students earn credentials in high-demand careers. The fund should provide additional dollars to schools or colleges based on the number of students who accumulate credentials for in-demand fields before graduating.


Background: The State Board of Education currently approves dozens of industry-recognized credentials across thirteen career fields, such as agriculture, health care, hospitality and tourism, and manufacturing. Students can earn credentials through their local schools, at regional joint-vocational centers, through an apprenticeship, or through dual high school/college enrollment. Each credential is assigned a certain number of points—up to twelve for the most demanding certification programs and one for the least intensive. Third-party organizations, such as professional associations or industry groups, issue these credentials when students meet certain requirements. For example, students can earn an HVAC credential issued by the Air Conditioning Contractors of America; a medical-assistant credential issued by the American Medical Certification Association; or an IT routing and switching credential issued by Cisco. According to the most recent state data, few students earn such credentials: although these data predate the new state graduation requirements, less than 5 percent of Ohio’s graduating classes of 2015 and 2016 left high school with industry credentials (that is, earned credentials worth a total of at least twelve points). With 40 percent of young people not entering college directly after high school, many graduates are left to pursue employment without credentials that could open job opportunities and help them advance in their careers. Earning certifications in high school can also benefit college-going students, who can use them when they begin to pursue full-time employment.


Proposal rationale: Industry-recognized credentials are a win-win for students and employers. Students benefit by gaining technical skills and earning credentials that signify their employability; businesses also benefit from better-trained employees, particularly at entry-level positions. Yet Ohio has too many young people leaving high school (and college, too) who enter the job market without technical skills or recognized credentials. By providing financial incentives, as Colorado and Wisconsin have done, state leaders would encourage more students to gain certifications in Ohio’s most in-demand careers.


Cost: This could be accomplished by providing $8 million per year for this incentive program. Schools would receive $1,000 for each student who completes an in-demand industry credential. Incentive dollars would be awarded until they were gone.


Resources: For information about industry-recognized credentials, see ODE’s “Industry-Recognized Credentials,” and for a list of careers that Ohio considers in demand, see Ohio Means Jobs’ “In-Demand Careers.” For examples of states with incentive programs linked to industry certifications, see the Wisconsin Department of Public Instruction’s “CTE Technical Incentive Grants” and the Colorado Department of Education’s “Career Success Pilot Program.”

Fordham Logo

© 2026 The Thomas B. Fordham Institute
Privacy Policy
Usage Agreement

National

P.O. Box 110
Burke, VA 22009

202.223.5452

[email protected]

Ohio

P.O. Box 82291
Columbus, OH 43202

614.223.1580

[email protected]

Sponsorship

130 West Second Street, Suite 410
Dayton, Ohio 45402

937.227.3368

[email protected]