In recent years, states and districts have made a concerted effort to align early elementary school instruction with “the science of reading.” But how much progress has actually been made?
To find out, Fordham researchers David Griffith and Brian Fitzpatrick analyzed results from a nationally representative survey of K–3 teachers—developed by Fordham and fielded by RAND—that examined their knowledge of reading science and its relationship to the policies that shape instruction.
The takeaway: Progress is real, but incomplete.
Download the full report or read it below.
Foreword
By Amber M. Northern and Michael J. Petrilli
Formal reading instruction in the United States predates our nation’s founding. Published in the 1680s, The New England Primer—the nation’s first major schoolbook—included spelling and sounding-out exercises that modern science of reading advocates would readily identify as early phonics instruction.
But it was the late nineteenth-century psychologist Edmund Huey who established the roots of the “science of reading” (SoR). Using rudimentary mechanical devices to measure eye movements, he showed that the act of reading was not a smooth process but rather a series of “rapid eye jumps and pauses,” reflecting the complex mental processes involved in decoding and comprehension.
In the decades that followed, a procession of influential scholars—including Edward Thorndike, Rudolf Flesch, Jeanne Chall, Keith Stanovich, and Marilyn Jager Adams—built an empirical foundation on how children learn to read. And in 2000, the National Reading Panel synthesized the best evidence and the takeaways for classroom implementation.
Yet this long research tradition has not produced uniform understanding or practice in today’s literacy classrooms. Instead, we’ve experienced significant bumps, detours, and even reading “wars,” as advocates of effective reading instruction have struggled to make their voices heard.
In 2022, Emily Hanford’s podcast series, Sold a Story, initiated a fresh wave of concern and advocacy, and state and local policies meant to improve reading instruction have proliferated in response. (At least 40 states and counting have enacted science of reading laws.) Whether these efforts ultimately succeed depends in large part on how clearly and consistently they are understood, supported, and enacted by teachers.
To learn more about that, we conducted a nationally representative survey of America’s K–3 reading teachers, with the twin goals of assessing their knowledge of reading science (via a short quiz embedded in the survey) and connecting those results to specific and ongoing “SoR” state implementation efforts. Fordham’s David Griffith and Brian Fitzpatrick co-led the analysis and report writing.
Their investigation yielded four big findings:
First, at least a third of teachers in high-poverty settings aren’t fully committed to the science of reading.
For example, when given the choice between a phonics-based approach to reading instruction and “cueing”—a discredited practice that encourages guessing instead of systematic decoding—a disquieting 41 percent of K–3 teachers in high-poverty settings did not express a clear preference for phonics (Figure F-1).
Figure F-1. Teachers in high-poverty settings are more likely to express ambivalence about phonics-based instruction.
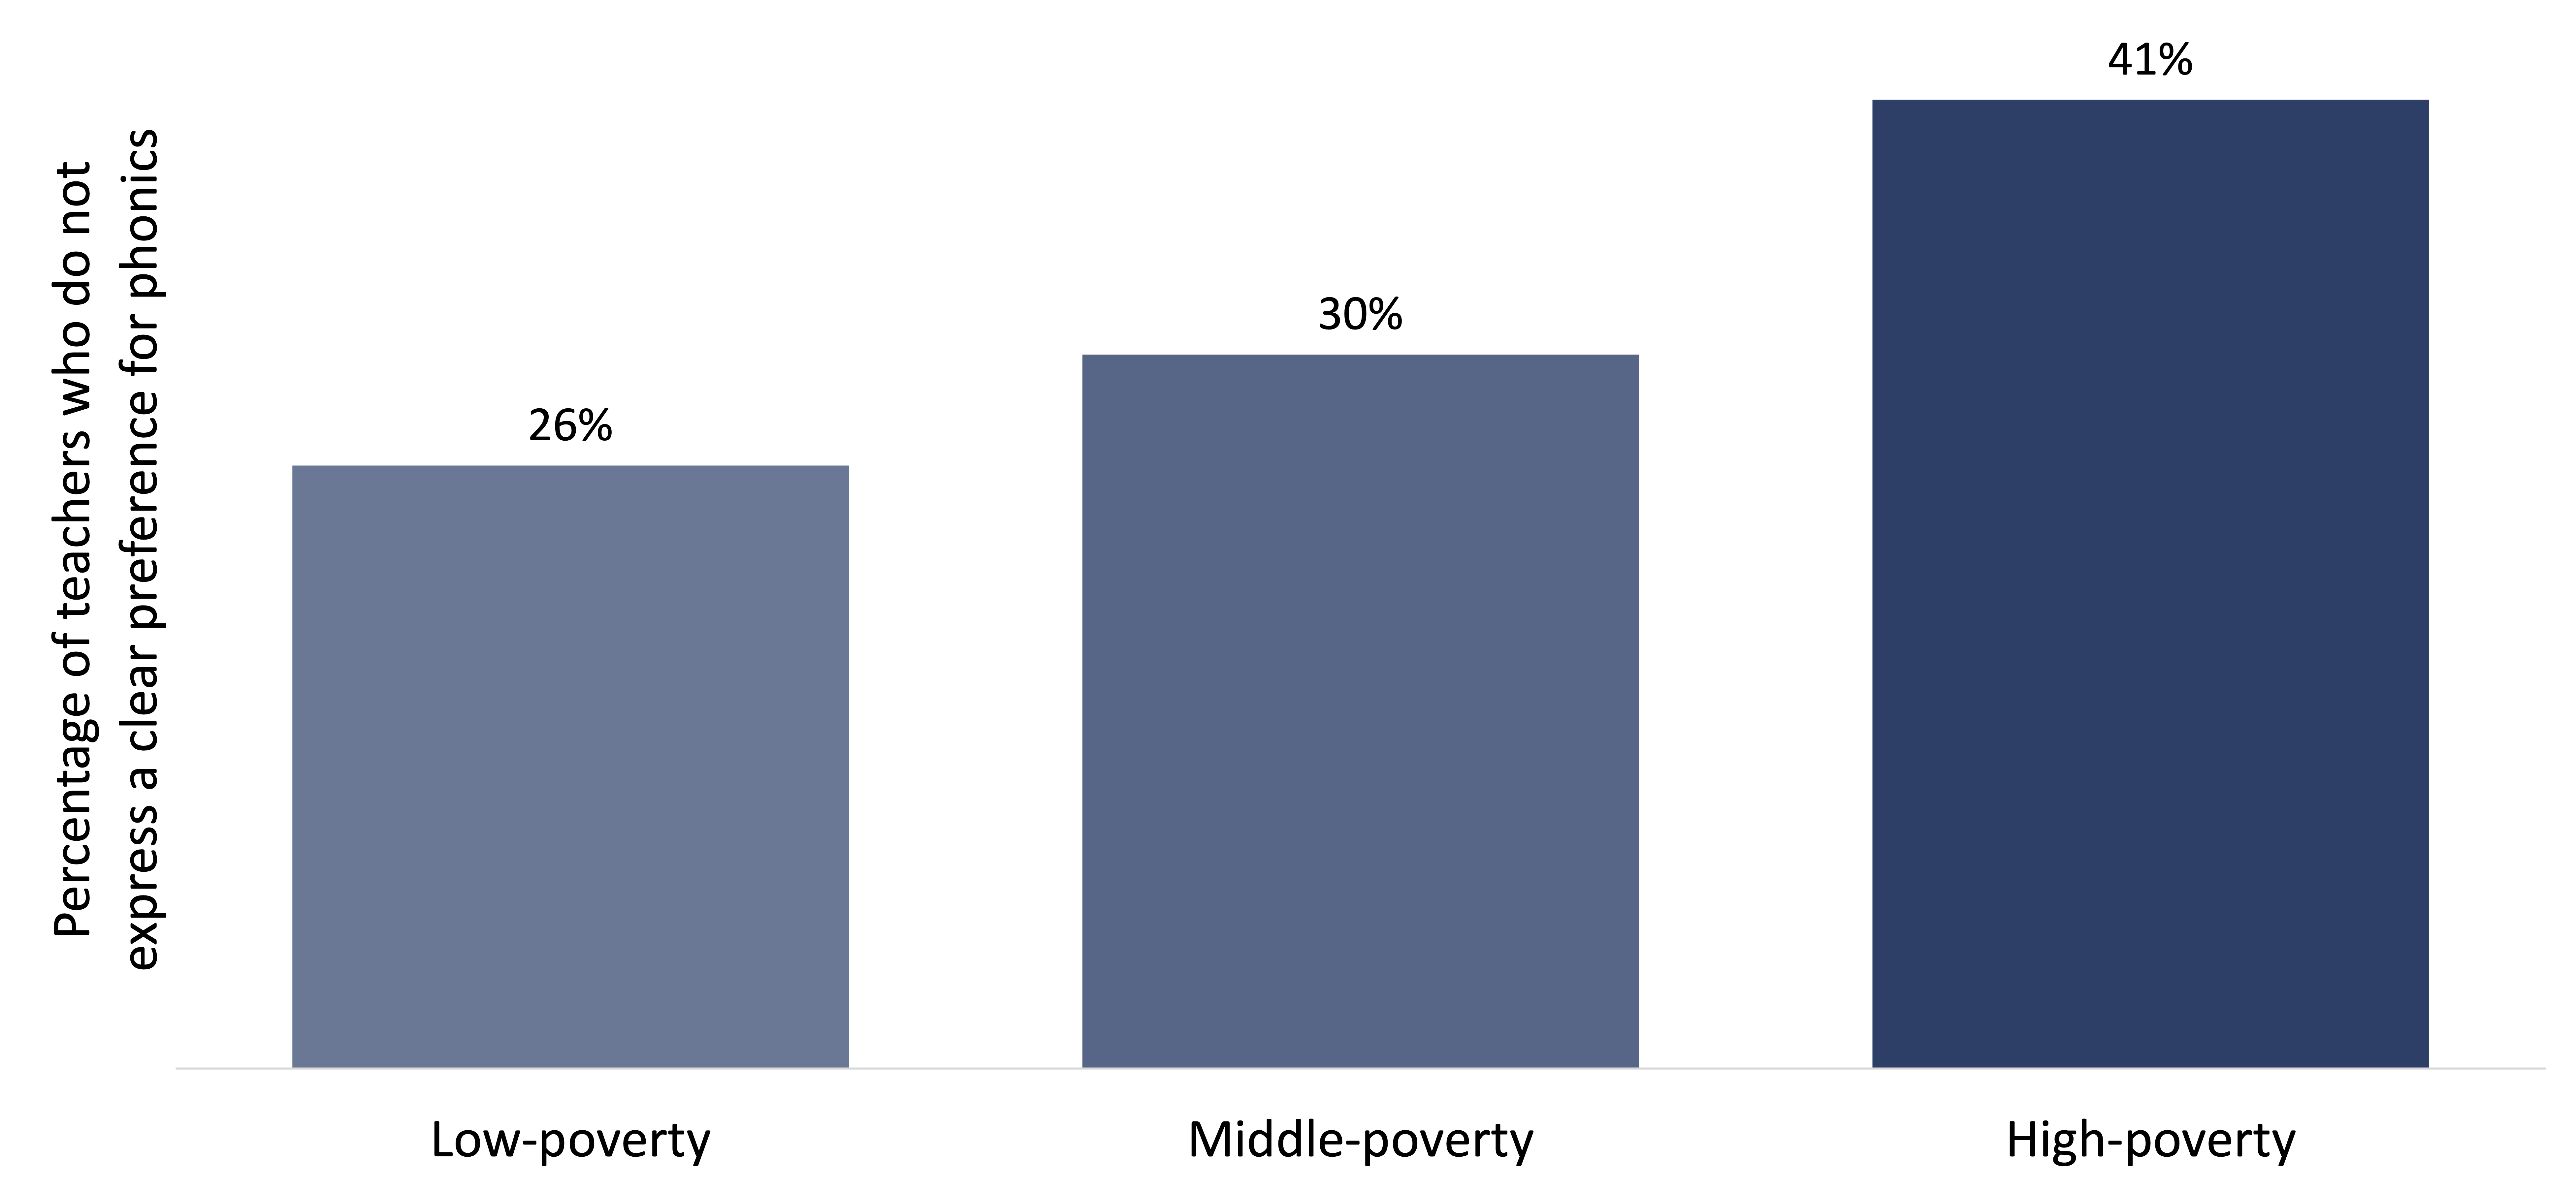
Note: Survey question: “Do you generally favor the use of phonics (i.e., encouraging students to sound out words) or cueing (i.e., encouraging students to use context clues) when teaching?” The percentages shown include teachers who chose “cueing,” “both equally,” or “neither” rather than “phonics.” This question is based on a similar question from Fordham’s 2025 report, Ohio’s path to early literacy: Science of Reading progress and challenges.
Second, teachers who rely on their preservice training know less about the science of reading than teachers who receive in-service training.
In fact, while receiving science of reading–aligned professional development is associated with more knowledge of reading science, preservice emphasis on the science of reading is associated with less knowledge of the topic (Figure F-2). In other words, whatever literacy instruction teachers receive in schools of education may be actively harmful to their understanding of evidence-based practices.
Figure F-2. In-service literacy training is associated with more knowledge of reading science, while preservice literacy training is associated with less knowledge.
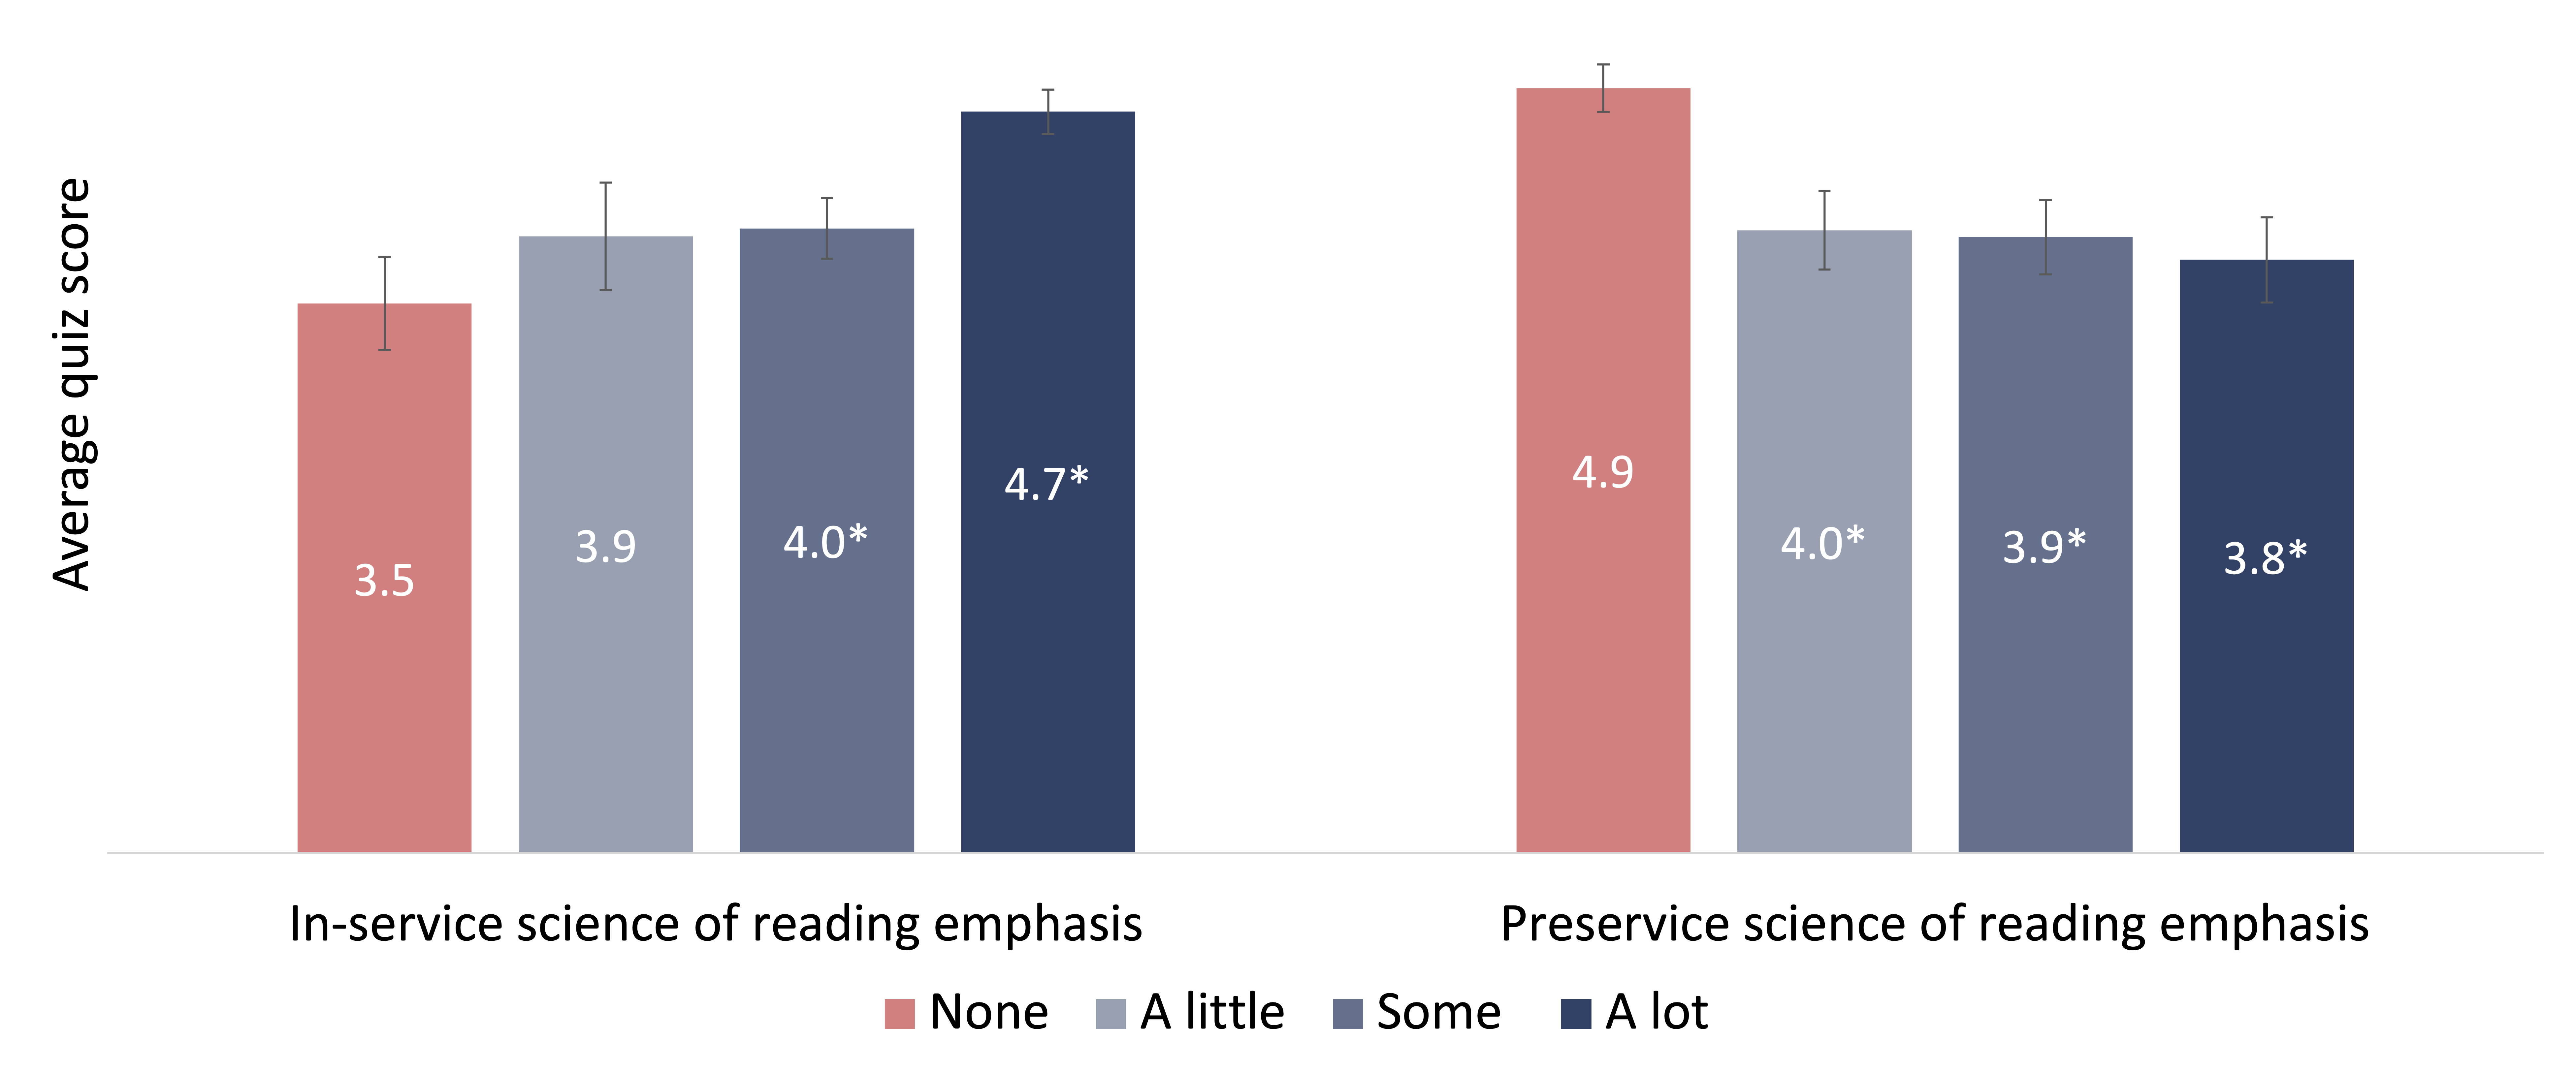
Note: Survey question: “How much emphasis has your professional development/preservice program put on the science of reading?” *Indicates statistically significant difference at the 95 percent confidence level. Peach-colored bars (“None”) indicate the reference categories. Quiz scores range from zero to eight.
Third, teachers in states with science of reading–aligned licensure tests have a firmer grasp of reading science.
Of the 18 state reading policies we examined, only one—requiring an initial licensure test aligned with the science of reading—is associated with deeper understanding of that science (Figure F-3). Like the previous finding, this one suggests that improving the quality of preservice preparation is perhaps the most fundamental challenge.
Figure F-3. Teachers in states with science of reading–aligned licensure tests have a firmer grasp of the science of reading.
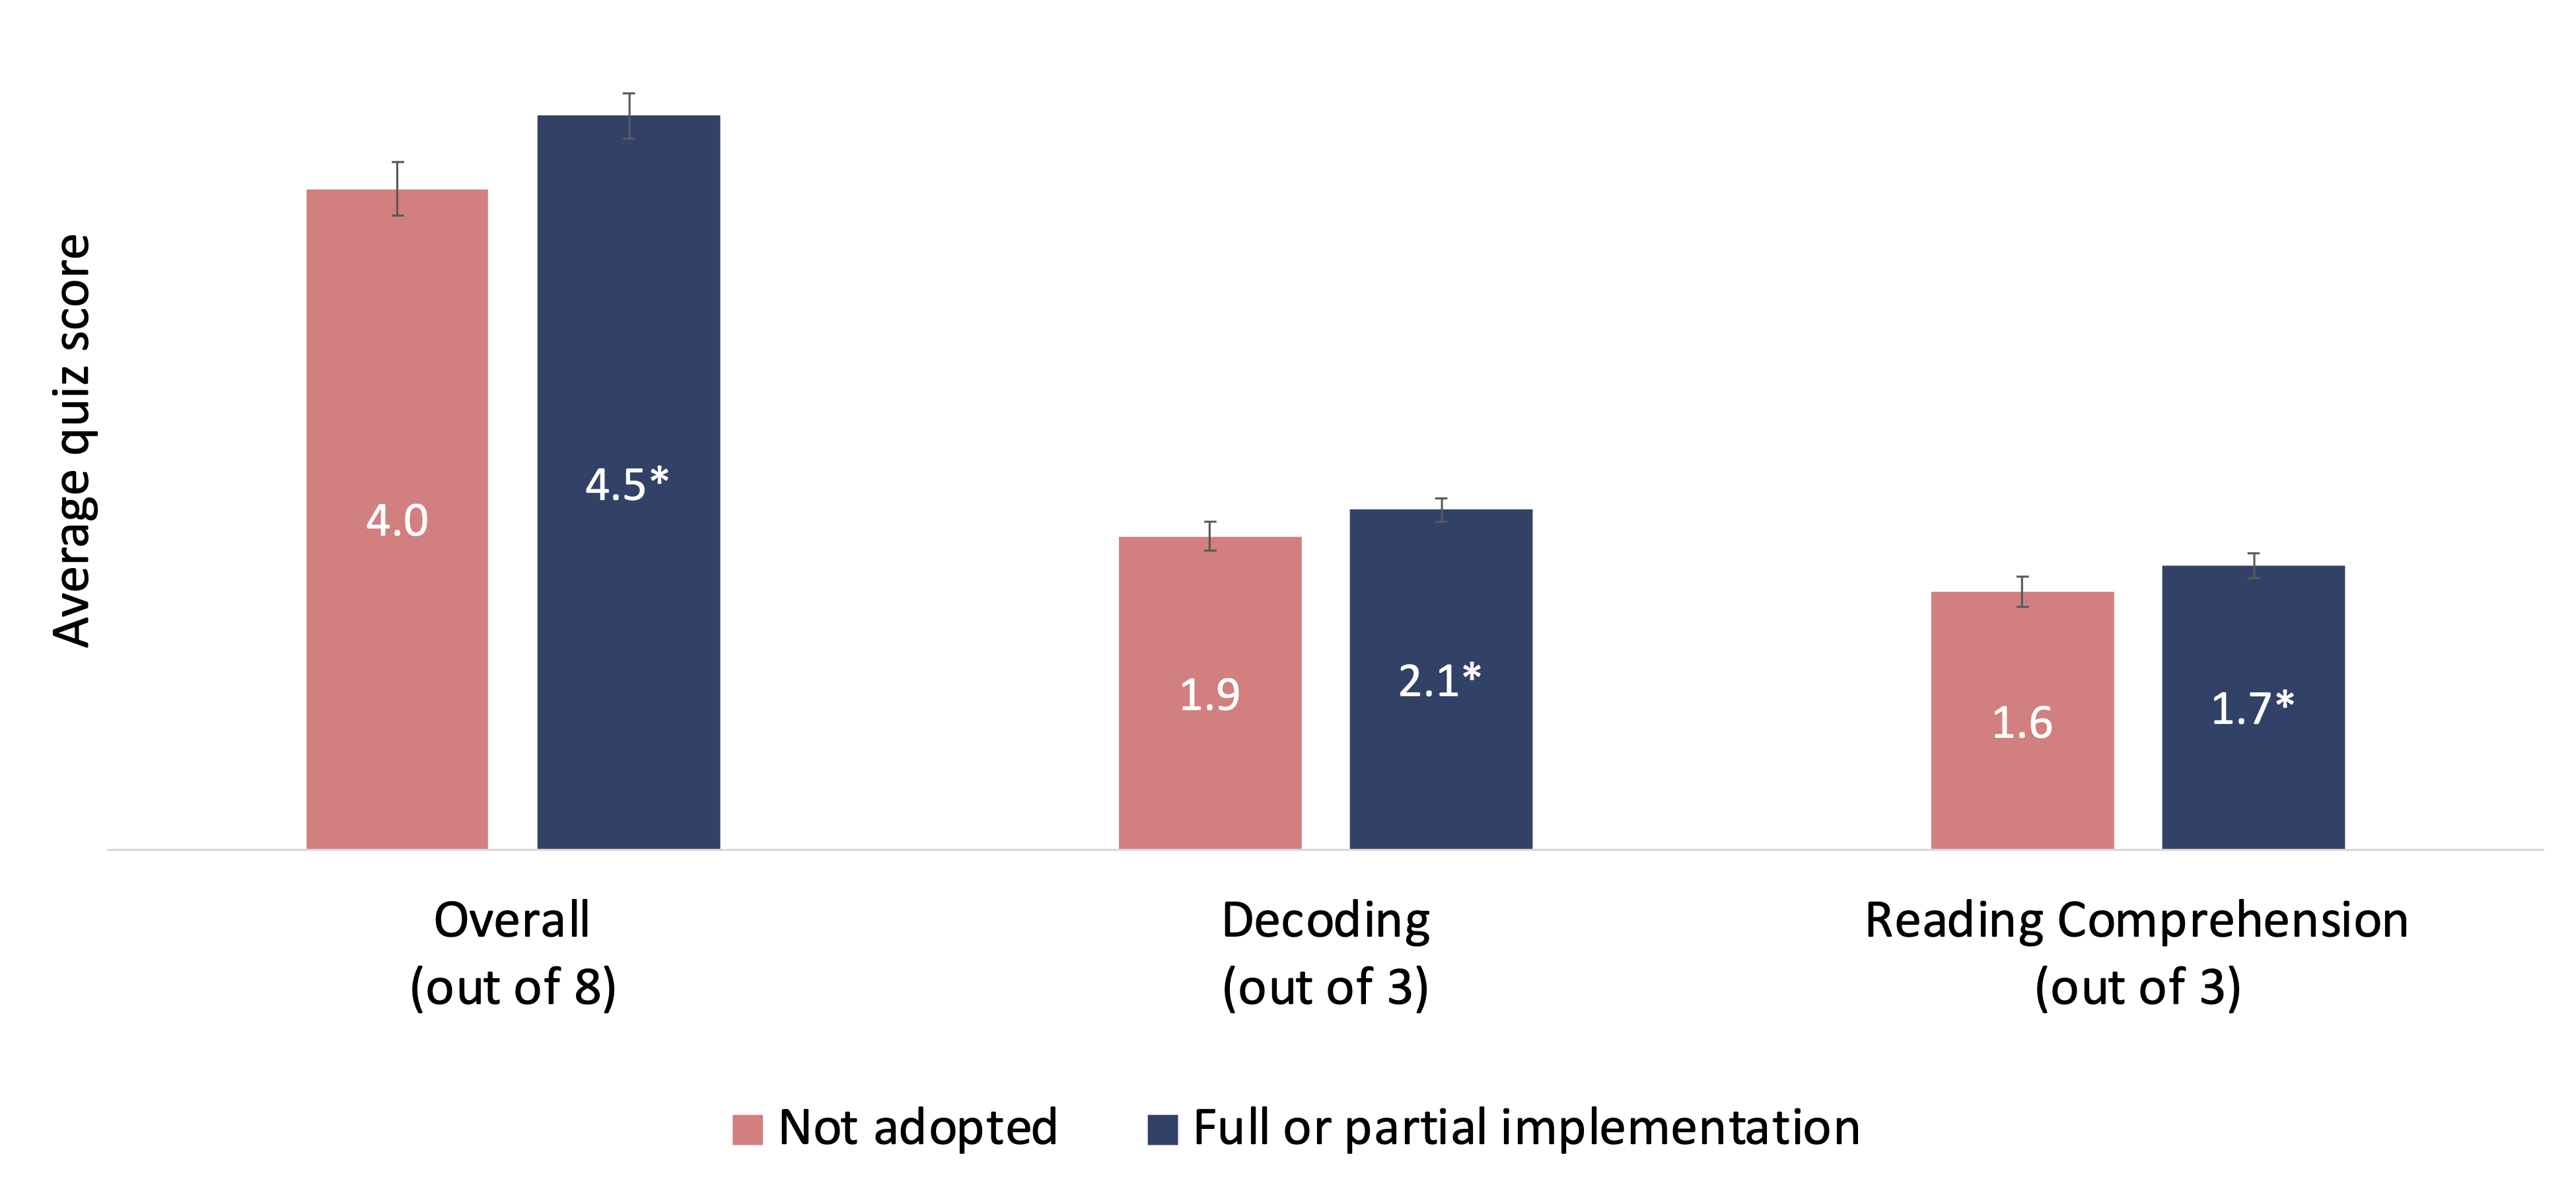
Note: *Indicates statistically significant difference at the 95 percent confidence level. Peach-colored bars (“Not adopted”) indicate the reference categories.
Finally, many teachers are still using questionable reading curricula.
For example, despite facing criticism for their continued inclusion of three-cueing and other unscientific methods, Benchmark Advance and Fountas & Pinnell are still used by 19 percent and 16 percent of teachers, respectively—though in better news, the most popular reading curriculum in America is now the well-regarded UFLI (University of Florida Literacy Institute) Foundations (Figure F-4).
Figure F-4. The most popular reading curriculum among K–3 teachers is University of Florida Literacy Institute (UFLI) Foundations.
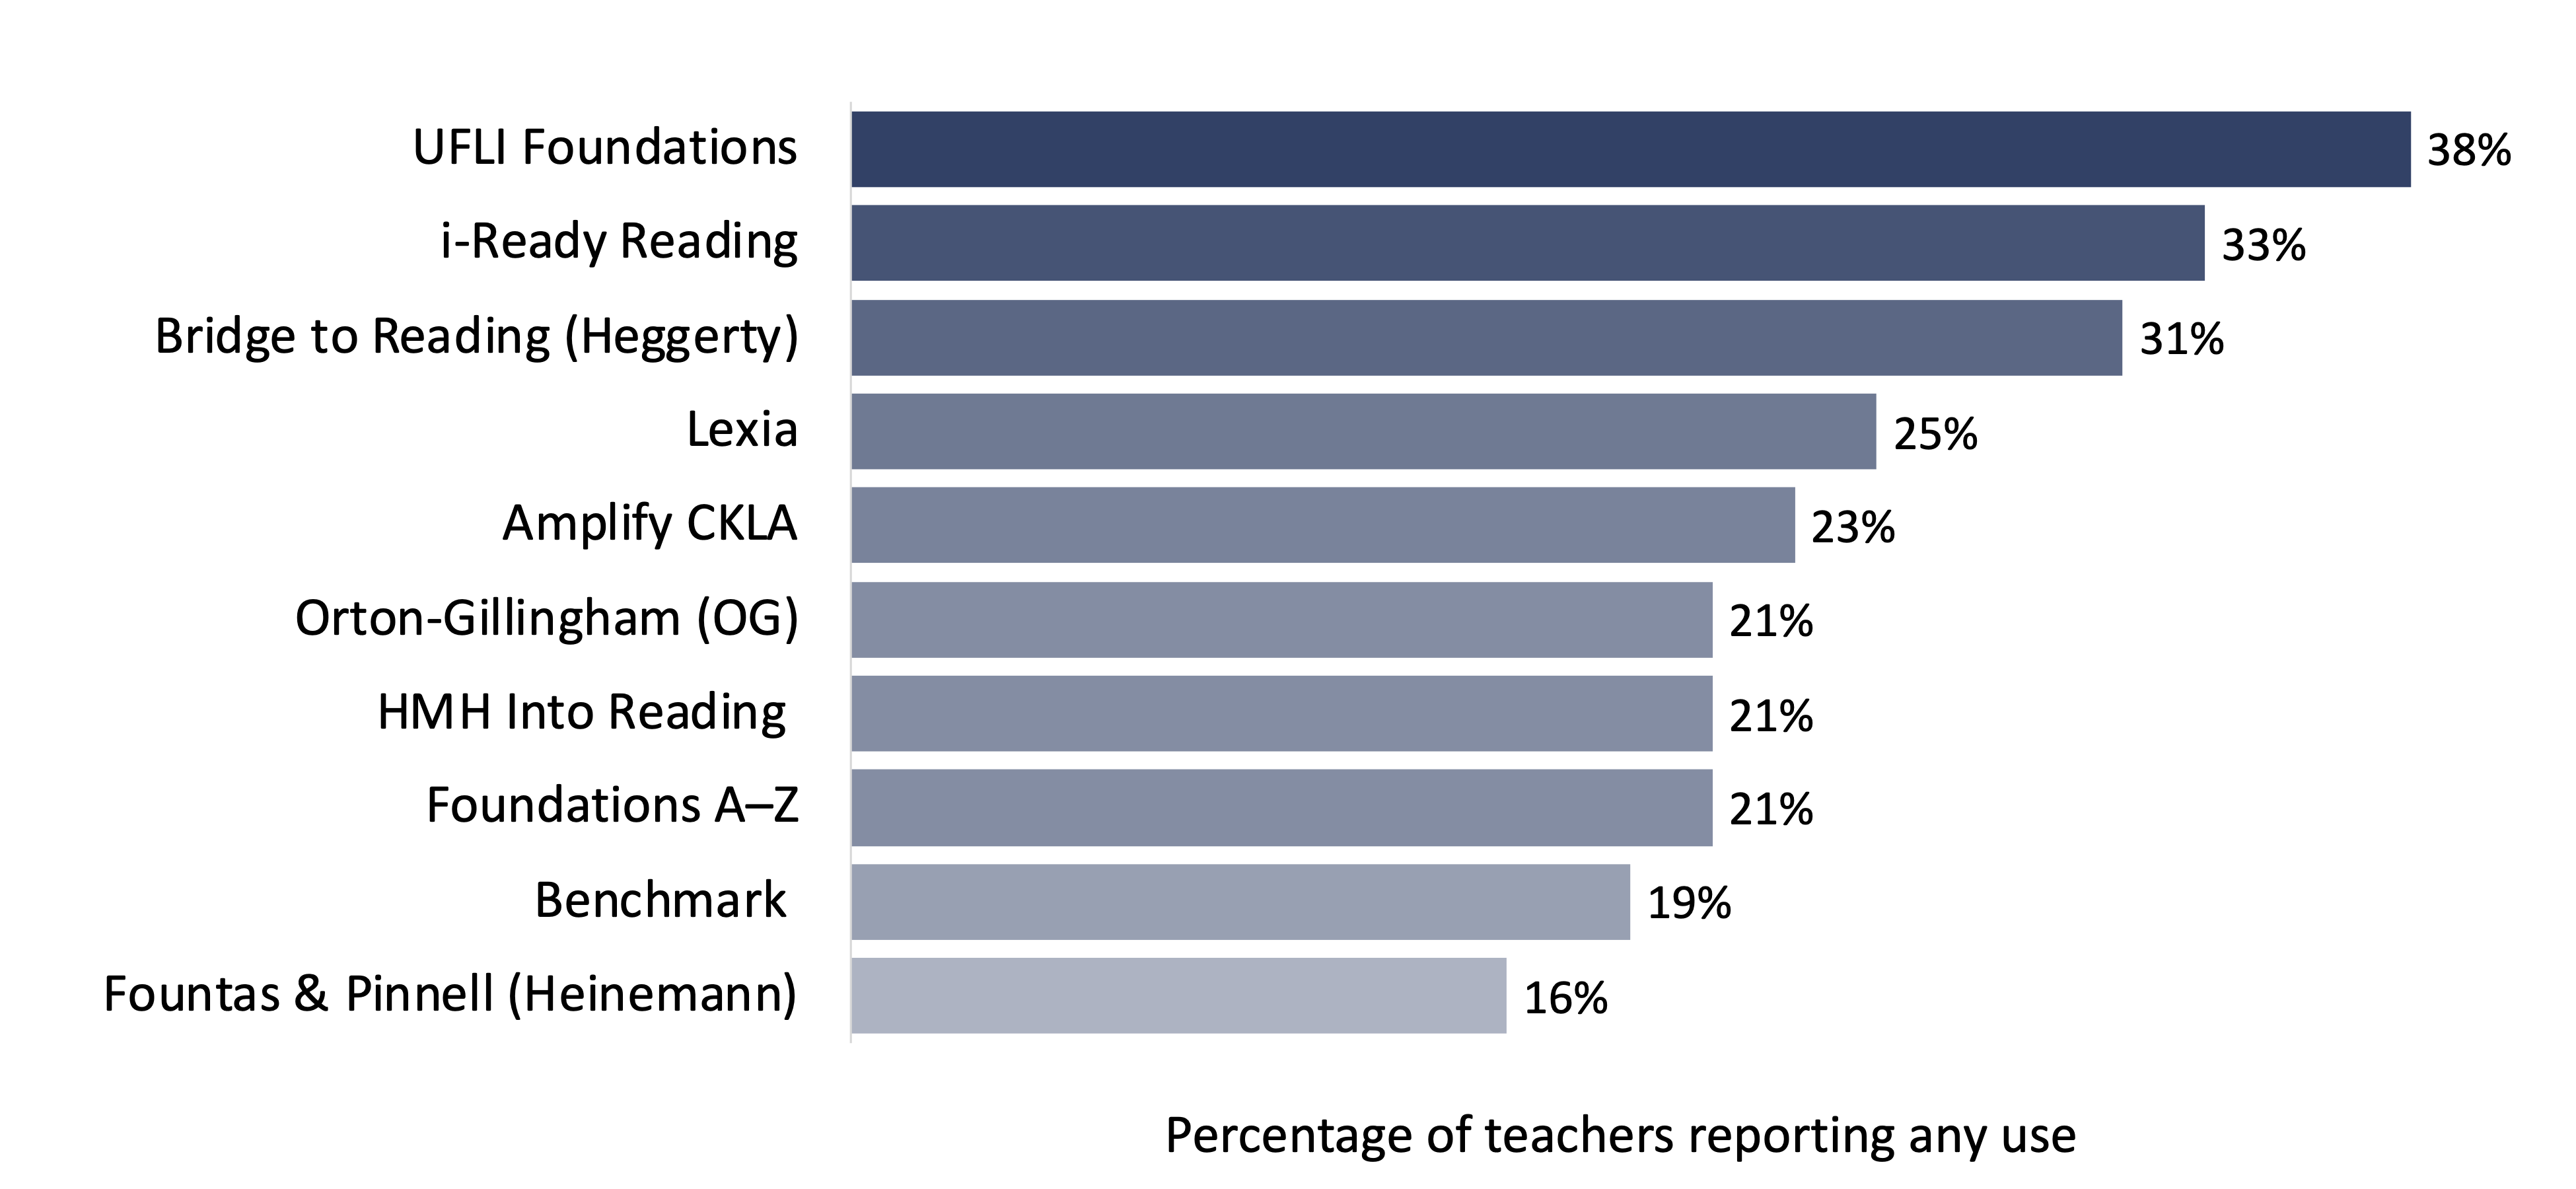
Note: Survey question: “Please select the 2–3 instructional materials in each row and column that you rely on to teach ELA skills.”
Encouragingly, the survey data show that teachers who use UFLI tend to know more about the science of reading than the rest of the sample, as do teachers using CKLA-Amplify. In contrast, teachers who use Benchmark, Fountas and Pinnell, and i-Ready (the nation’s second most popular reading curriculum) tend to be less knowledgeable than their peers.[1]
Based on these findings, our Fordham colleagues urge states to take four steps:
1. Require colleges of education and other teacher preparation programs to provide instruction aligned to the science of reading.
2. Require that K–3 teacher licensure exams include comprehensive knowledge of the latest reading science.
3. Require every K–3 teacher to complete at least one science of reading training in their first 2–3 years on the job.
4. Require districts to choose a science of reading–aligned curriculum from a state-approved list in grades K–3.
We wholeheartedly agree with these recommendations and would add one more to the list: policymakers and other stakeholders must do everything in their power to address the emerging science of reading gap.
On average, the survey data suggest that teachers in low-poverty schools are at the 54th percentile of science of reading knowledge and commitment, while those in high-poverty schools are at the 44th—a substantial difference that will have dire consequences for poor students should it persist.
Unfortunately, we can’t say with certainty why this gap exists. For example, despite exhibiting less knowledge of reading science, teachers in high-poverty schools report more exposure to science of reading–aligned trainings such as LETRS (37 percent versus 27 percent) and CKLA (16 percent versus 8 percent) than teachers in low-poverty schools. Similarly, they are more likely to report using the CKLA-Amplify curriculum (27 percent versus 17 percent) – though they are also more likely to use i-Ready (42 percent versus 31 percent), which is generally associated with less knowledge of reading science.
Collectively, these patterns don’t suggest a single, straightforward explanation. But they do highlight the fragmented nature of curriculum adoption and the complexity of translating exposure to science of reading–aligned training into better practice in high-poverty schools. And by that measure, there is still considerable ground to cover.
To be clear, we’ve made real progress in recent years, so the challenge now is to use what we’ve learned to keep moving forward. To us, that means a sustained focus on the things that matter most: stronger preservice programming, deeper professional development, more coherent curricula, and implementation supports that reflect local realities—especially where the need is greatest.
Introduction
The basic contours of the “science of reading” have been well-established since at least the turn of the century, when the National Reading Panel published its definitive report, Teaching Children to Read. Yet despite the unusual strength of the evidence behind the science of reading movement, millions of American students are still taught with ineffective instructional methods and materials.
In recent years, reading reformers have finally begun to turn the tide, aided by the work of education authors and mainstream journalists such as Emily Hanford, whose 2022 podcast series, Sold a Story: How Teaching Kids to Read Went So Wrong, brought unprecedented attention to the problems with reading instruction, including the degree to which explicit phonics instruction—which is critical to decoding unfamiliar words—was overlooked or crowded out by unscientific approaches such as whole language, three-cueing, and “balanced” literacy.
In the wake of the podcast’s release, many practicing educators came forward to corroborate Hanford’s account, and a bipartisan coalition of stakeholders ignited a fresh wave of activity in statehouses, departments of education, and central offices that focused on science of reading–aligned professional development and instructional materials for kindergarten through third grade, which is the period when most children learn to read. In addition to explicit phonics instruction, this push has increasingly incorporated other “pillars” of effective reading instruction, such as a proactive approach to phonemic awareness and a broad curriculum that effectively builds knowledge and vocabulary through exposure to history, science, and other essential content.
But is this flurry of activity having the desired effects?
To find out, we conducted a nationally representative survey of K–3 teachers whose responsibilities included teaching reading or English language arts instruction. Our research questions were as follows:
1. How well do K–3 teachers understand the science of reading?
For example, how many view explicit phonics instruction as essential? How many understand that teaching subjects like history and science is critical to building content knowledge and vocabulary—and thus to reading comprehension? How many understand the specific reading challenges facing English learners and students with dyslexia? And how do the answers to these questions differ by teacher and/or school characteristics?
2. What science of reading supports are K–3 teachers receiving?
For example, how many have received professional development on phonics or other topics? How many have worked with a reading coach? To what extent are instructional materials aligned with the science of reading? And what do recent graduates say about the reading/literacy training that education schools and other teacher preparation programs are providing?
3. Which policies or supports are associated with a deeper understanding of reading science?
For example, do teachers exhibit a deeper knowledge of the science of reading in states that provide funding for reading/literacy efforts? Are those with reading coaches or other supports more committed to evidence-based practice? Is exposure to specific trainings associated with a better understanding of phonics or other topics?
Overall, the results suggest at least two conclusions. First, K–3 teachers’ knowledge of the science of reading is improving. Second, there is an urgent need for continued progress.
Background
Like the act of reading itself, the body of knowledge that has come to be referred to as the “science of reading” is inherently complex. For example, in the spring of 2000, the National Reading Panel’s final report, which synthesized decades of experimental research, concluded that effective early literacy instruction includes explicit attention to phonemic awareness, systematic phonics, fluency, vocabulary, and strategy-based comprehension.
Subsequent research has largely reinforced those findings, with two exceptions. First, fluency is increasingly viewed as an outcome that emerges naturally from decoding and orthographic mapping (storing a written word in one’s long-term memory), though some modeling of and practice with prosody may be appropriate. Second, exposure to rich content that builds knowledge and vocabulary across multiple domains is now understood as essential to reading comprehension, while traditional reading comprehension strategies such as finding the main idea are considered less likely to move the needle.[2]
In contrast, recent studies have made the need for systematic phonics and other elements of “structured literacy” such as blending and morphology even more difficult to dispute. And in recent years, state policymakers have acted on this evidence. For example, at least thirty-three states now mandate science of reading training for early-elementary teachers and administrators, while others are banning the use of three-cueing (using meaning, syntax, and visual cues to guess unknown words) or requiring districts to adopt high-quality instructional materials grounded in scientific reading research.
At face value, these reforms appear promising. Still, prior experience provides grounds for caution. For example, in the wake of the National Reading Panel’s report, the federal government issued Reading First grants, which incentivized states to promote “scientifically based reading instruction” via curricular materials and professional development. Yet despite this incentive (and the weight of the evidence), there was pushback, with many districts and educators keen to do what they had been doing and wary of an approach that they considered too prescriptive. And subsequently, many districts shifted toward “balanced literacy,” which purportedly included best practices from both whole-language and phonics-based approaches but which often resembled the former in practice.
Two decades later, the challenge of firmly grounding instruction in the science of reading persists. For example, one recent study found that elementary teachers had limited knowledge of key literacy constructs—including phonological awareness, phonics, and decoding. Similarly, a 2025 study found that many of the instructional materials used by elementary school teachers did not meet widely accepted scientific standards.
To be clear, little of the blame for this state of affairs lies with teachers. For example, a 2023 study found that only 53 percent of teacher education programs provided instruction in phonemic awareness, which is a foundational skill for early reading. And some of the reading/literacy programs that have dominated the elementary landscape in recent decades have been criticized for their inattention to phonics and other scientific principles.
Despite inconsistent implementation, specific reading policies—including those pertaining to literacy coaching, reading-focused professional development, high-quality instructional materials, external literacy supports, and third-grade retention—have been associated with improved reading outcomes for some or all students. And in recent years, states such as Mississippi have succeeded in boosting reading scores after adopting more comprehensive literacy reforms.
Yet while prior research has examined both specific science of reading supports and policies and teachers’ knowledge and beliefs regarding the science of reading, it has largely failed to examine the relationship between the two, with the exception of a 2025 RAND study that related policies on preservice training, professional learning, and curriculum use to a question about decoding-related practice. The present study expands on that work by investigating the links between a broader set of policies and supports and a more comprehensive measure of teacher knowledge.
Data and Methods
The primary data source for this project is a nationally representative survey that was administered to a subsample of the RAND American Teacher Panel (ATP) in the fall of 2025. The sampling methodology was designed, via a set of survey weights, to produce nationally representative estimates of K–3 public school teachers who taught English language arts (ELA) or English as a second language (ESL) during the 2025–26 school year.[3]
The survey design called for approximately 300 teachers per grade level (kindergarten through grade 3), with intentional subgroup targets of 225 teachers from non–high-poverty schools and seventy-five teachers from high-poverty schools within each grade. To achieve these goals, invitations were sent to 3,200 teachers starting on October 21, 2025, and respondents were offered a $10 electronic gift card as an incentive. After excluding ineligible respondents, the final analytic sample included 1,244 teachers, for a completion rate of 41.6 percent.
Survey Instrument
The survey included approximately sixty questions, most of which gauged teachers’ exposure to specific science of reading supports such as reading/literacy coaches, science of reading–focused trainings, and other forms of professional development, as well as preservice preparation programs that emphasize scientific reading instruction and reading/literacy curricula that are designed to encourage it.
In addition to multiple-choice questions, the survey included an open-ended question that invited teachers to “describe the most significant changes in early reading or ELA instruction that [they] ha[d] experienced in recent years.” A sampling of those responses appears throughout the report as illustrative context for the findings.
Finally, the survey included a short battery of questions that assessed teachers’ knowledge and understanding of the science of reading, which we scored based on the following point system:
3 points for knowledge of and commitment to explicit and systematic instruction in phonics and other elements of decoding
3 points for knowledge of and commitment to building knowledge and vocabulary to support reading comprehension
1 point for knowledge of reading/language supports that benefit English learners
1 point for knowledge of reading/language supports that benefit students with dyslexia
Readers who are familiar with the science of reading will recognize that the distribution of points between the first two categories echoes the formula for reading comprehension that is the foundation for the Simple View of Reading.[4] Advocates for English learners and students with dyslexia should note that we have included questions that deal with the specific instructional needs of these groups. For a full account of the survey and the questions included in the quiz, see Appendix A and Appendix B.
Investigating the links between policies and/or supports and teachers’ knowledge
To quantify teachers’ exposure to policies related to the science of reading, we augment our survey data with data from ExcelinEd’s Early Literacy Matters initiative,[5] which tracks states’ adoption of eighteen fundamental principles, such as requiring science of reading–aligned professional development and publishing guidance on high-quality instructional materials.[6] For simplicity’s sake, we consider states rated as having “fully” or “partially” implemented a principle to have policy aligned to that principle and consider states with “no such policy” or “forthcoming policy” to not have policy aligned to that principle.[7]
To investigate the links between policies and/or supports and teachers’ knowledge, we use a combination of correlation coefficients and bivariate regression to identify key variables from both the survey and the ExcelinEd data that predict teacher performance on the science of reading “quiz,” as well as other dependent variables. In general, we report differences that are significant at the 95 percent confidence level. For additional details on the methods, see Appendix D.
Findings
Finding 1 At least a quarter of teachers—and at least a third of those in disadvantaged settings—are not fully committed to the science of reading.
As noted, our science of reading quiz included a “decoding” section, a “reading comprehension” section, and two multipart questions that focused on special populations that require additional supports. In this section, we summarize teachers’ performance on each of those components and the evidence that their understanding of and commitment to the science of reading differ by school and teacher characteristics.
Finding 1a. Some teachers still aren’t emphasizing phonics.
When given the choice between four possible approaches to reading instruction, about half of K–3 teachers say they take a “structured” approach that emphasizes explicit instruction in phonics, decoding, and related skills (Figure 1). However, nearly one in three say they take a “balanced” approach that includes discredited methods such as leveled texts and “cueing support.” And nearly one in five say they take an “eclectic” or “immersive” approach that does not necessarily include phonics.
Figure 1. Only half of K–3 teachers say they take a structured approach to reading instruction that reflects the science of reading.
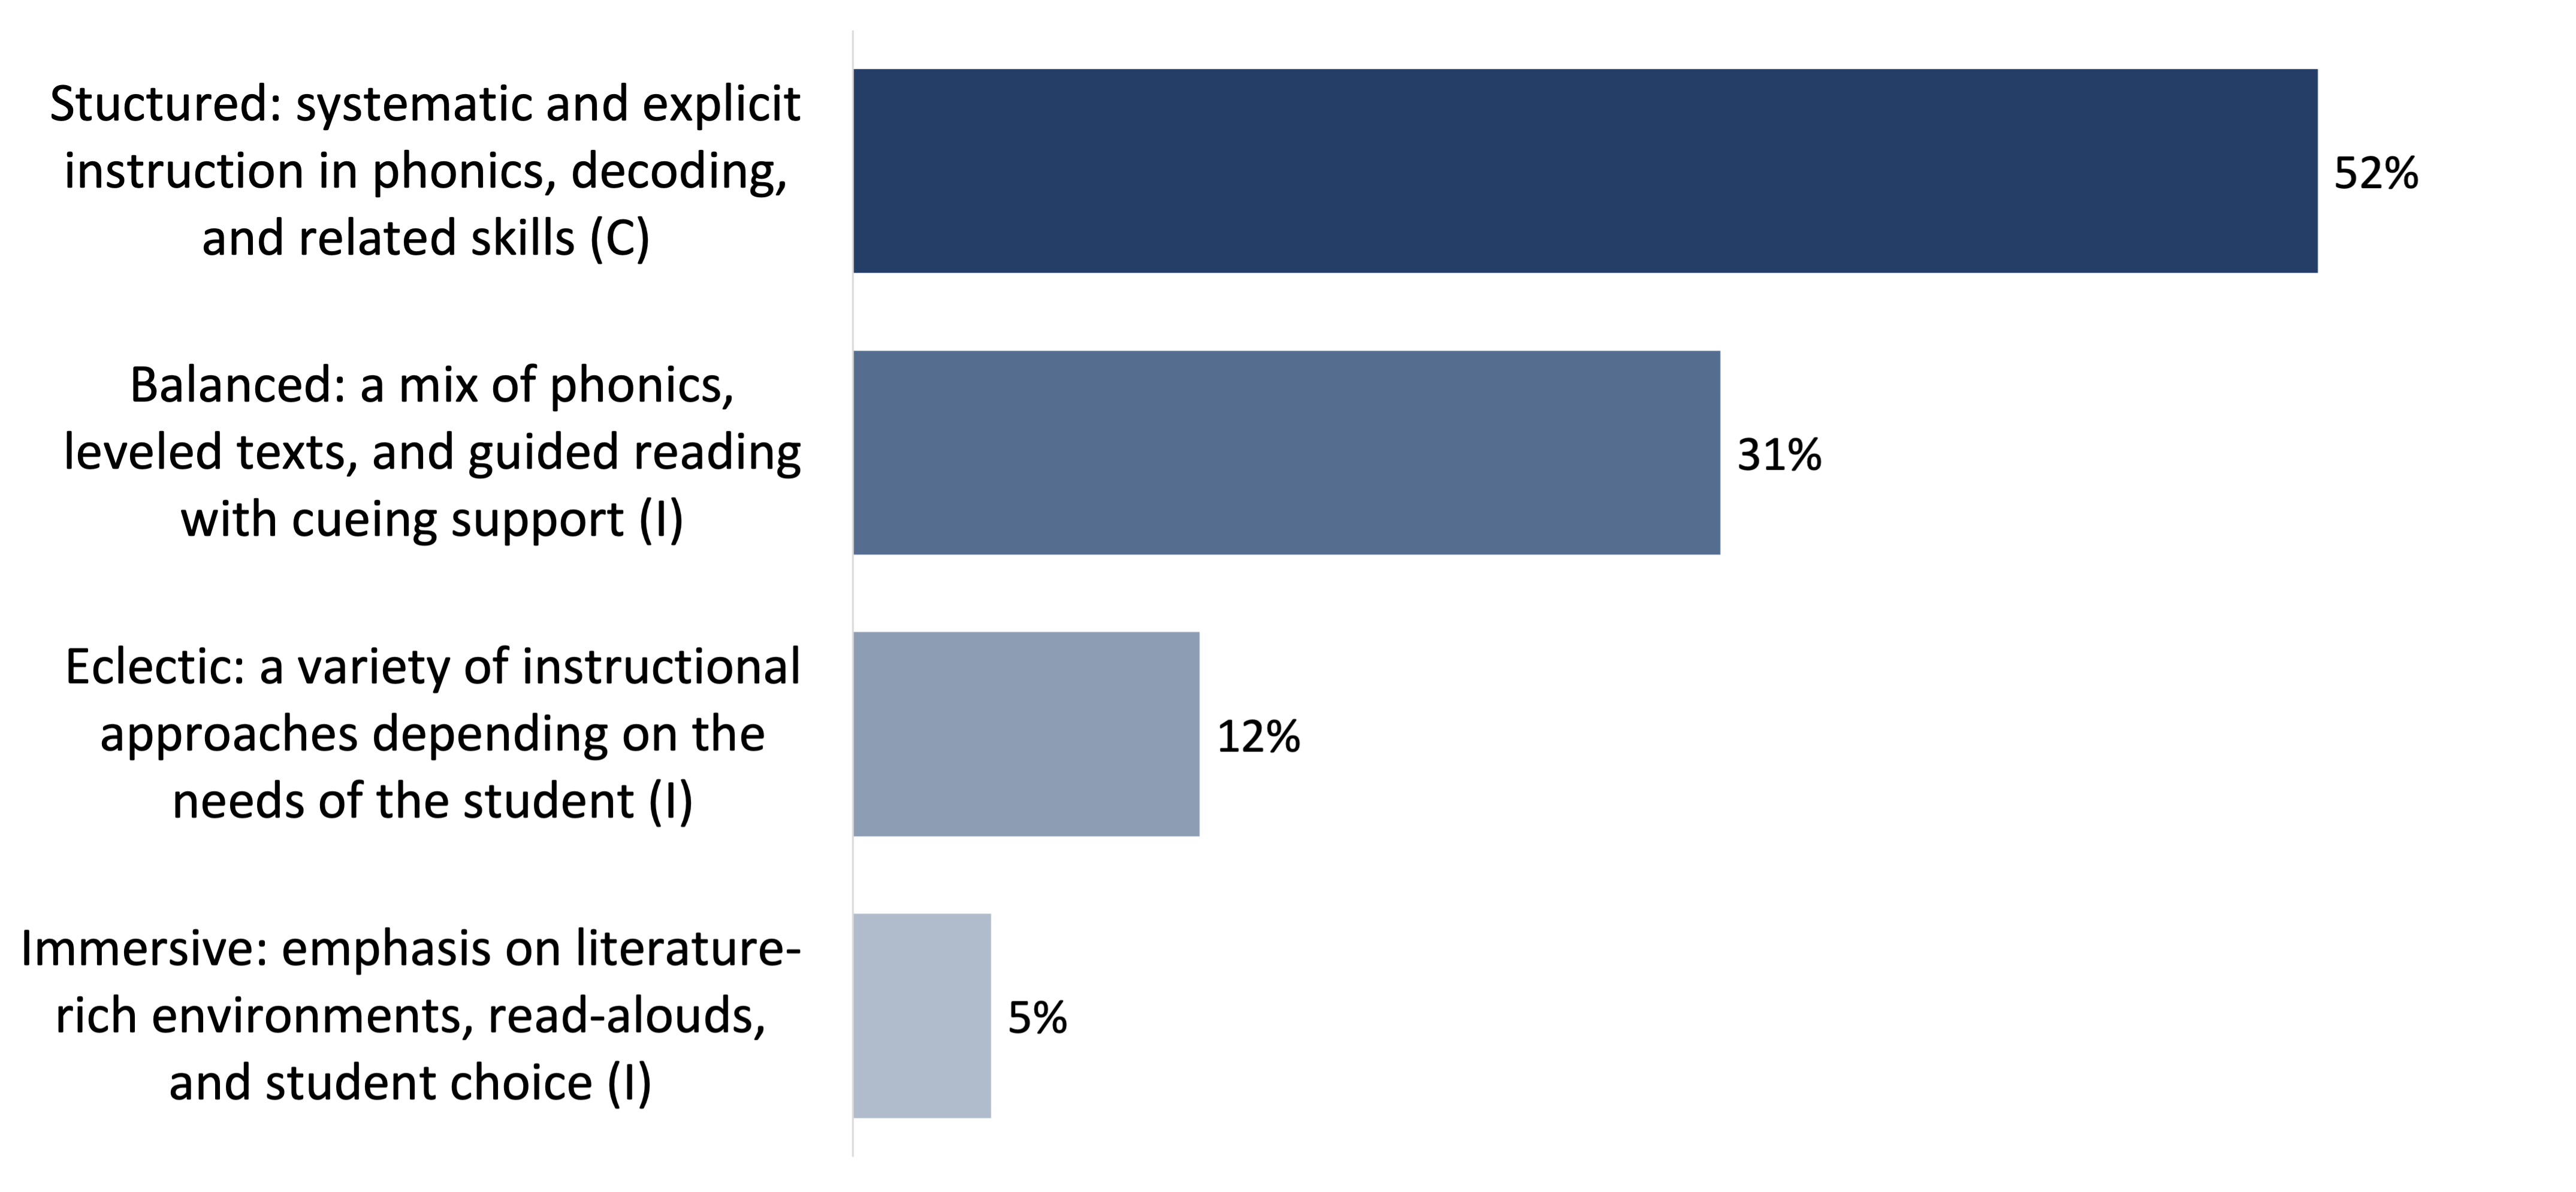
Note: Survey question: “Which of the following best describes your approach to reading instruction?” C = correct response; I = incorrect response.
Similarly, when given the choice, about two-thirds of teachers say they favor phonics over cueing (Figure 2). However, even though cueing has been discredited, 30 percent of teachers say they favor both approaches equally, and about 2 percent say they favor cueing over phonics.
Figure 2. Most K–3 teachers say they favor phonics over discredited cueing practices, but a sizable minority doesn’t express a clear preference.
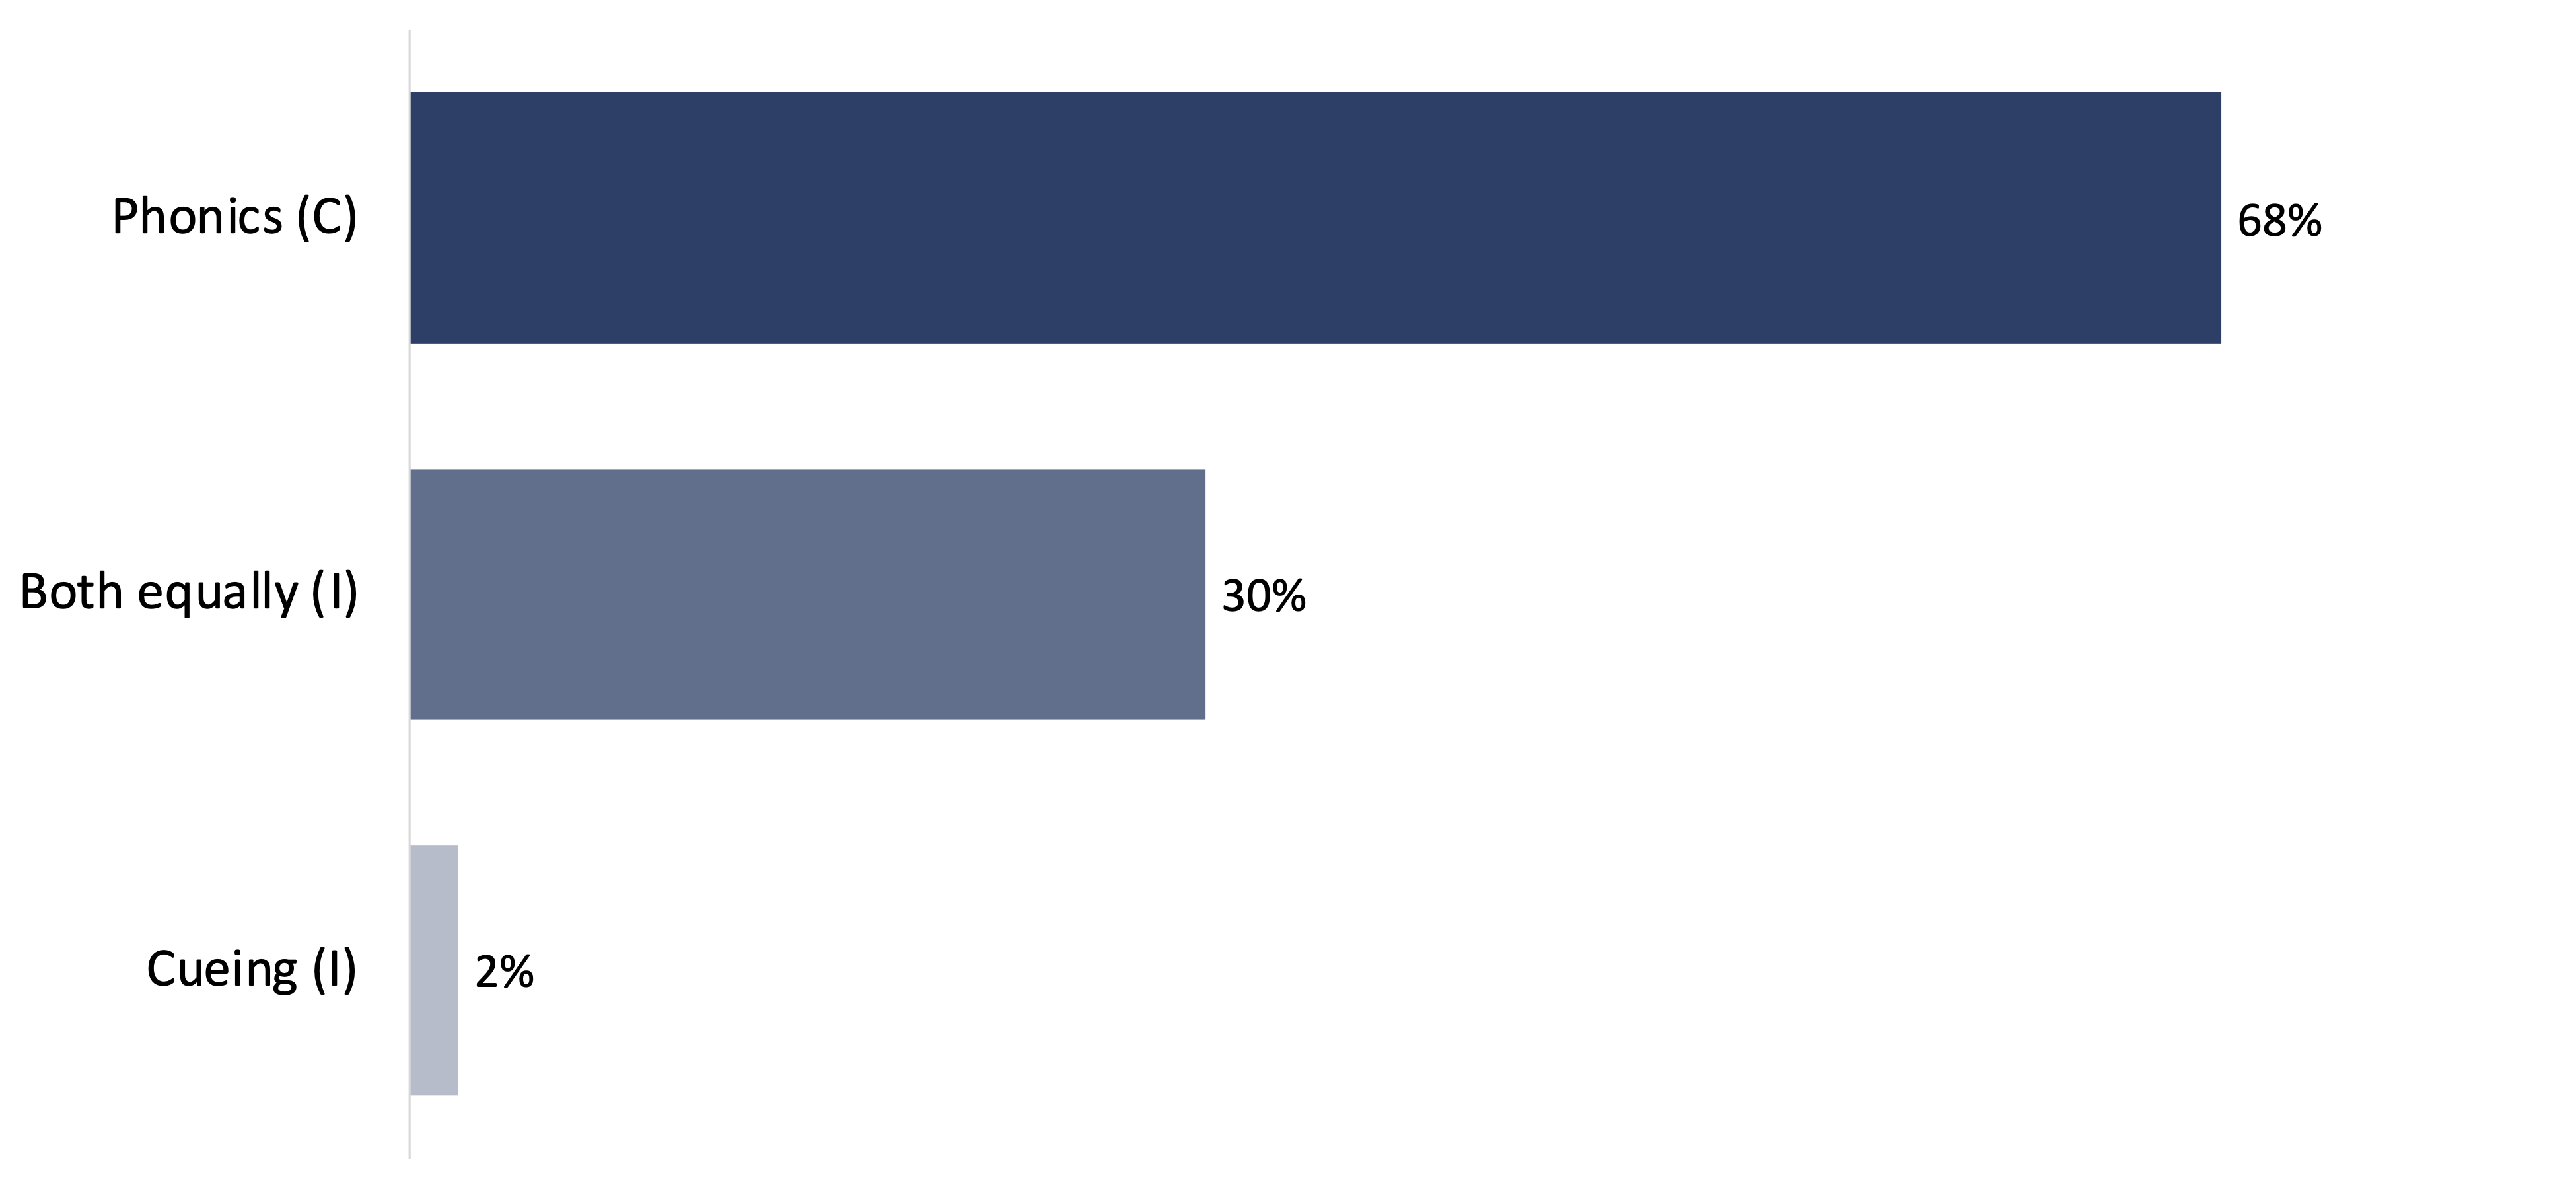
Note: Survey question: “Do you generally favor the use of phonics (i.e., encouraging students to sound out words) or cueing (i.e., encouraging students to use context clues) when teaching?” Question is based on a similar question from Fordham’s 2025 report Ohio’s path to early literacy: Science of Reading progress and challenges. C = correct response; I = incorrect response.
Looking across both questions, 78 percent of teachers either say they take a structured approach or chose phonics over cueing in the second question. However, 22 percent fail to express a clear preference for phonics in either question. And only 42 percent answer both questions correctly.
Notably, teachers who say they take an “eclectic” or “immersive” approach to reading instruction are even less likely to choose phonics over cueing than those who say they take a “balanced” approach (Figure 3).
Figure 3. Teachers who say they take a structured approach to reading instruction are more likely to favor phonics over cueing.
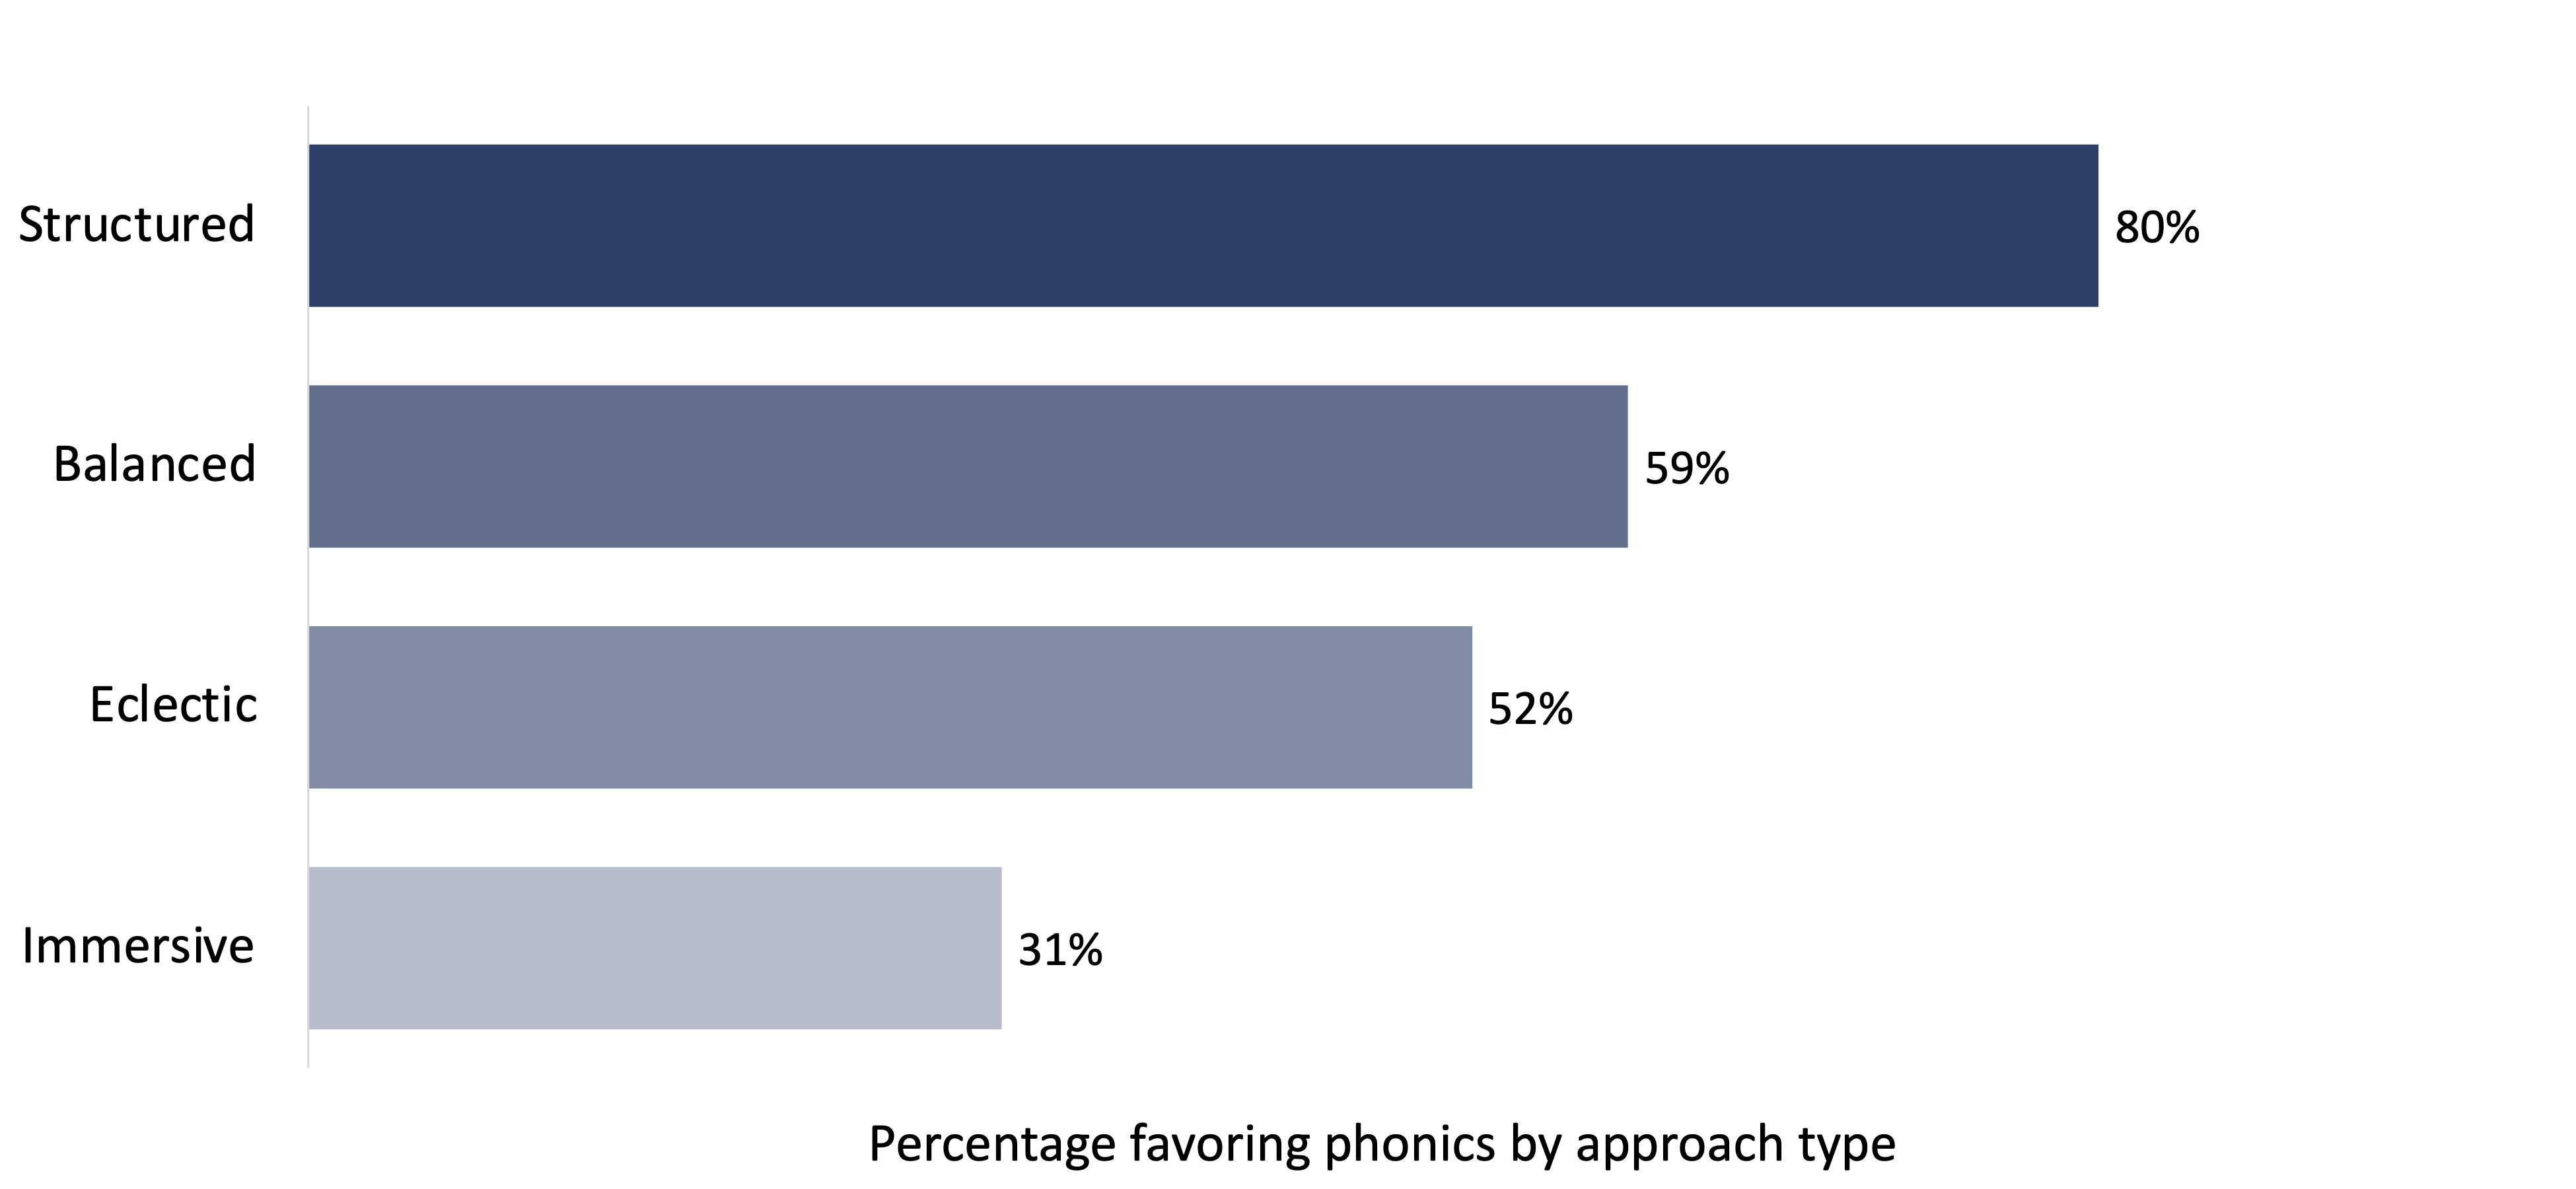
Note: Survey question: “Do you generally favor the use of phonics (i.e., encouraging students to sound out words) or cueing (i.e., encouraging students to use context clues) when teaching?”
Perhaps more encouragingly, when presented with a hypothetical scenario in which a student is “having trouble reading an unfamiliar word during small-group instruction,” 81 percent of teachers correctly indicate that the best strategy is to “help the student break the word into parts to identify syllables or phonics patterns” (Figure 4). Still, 19 percent of teachers chose another response, including 8 percent who say they would “ask the student what word would make sense in the context of the sentence.”
Figure 4. Most K–3 teachers correctly believe that they should help students break unfamiliar words into parts to identify syllables or phonics patterns.
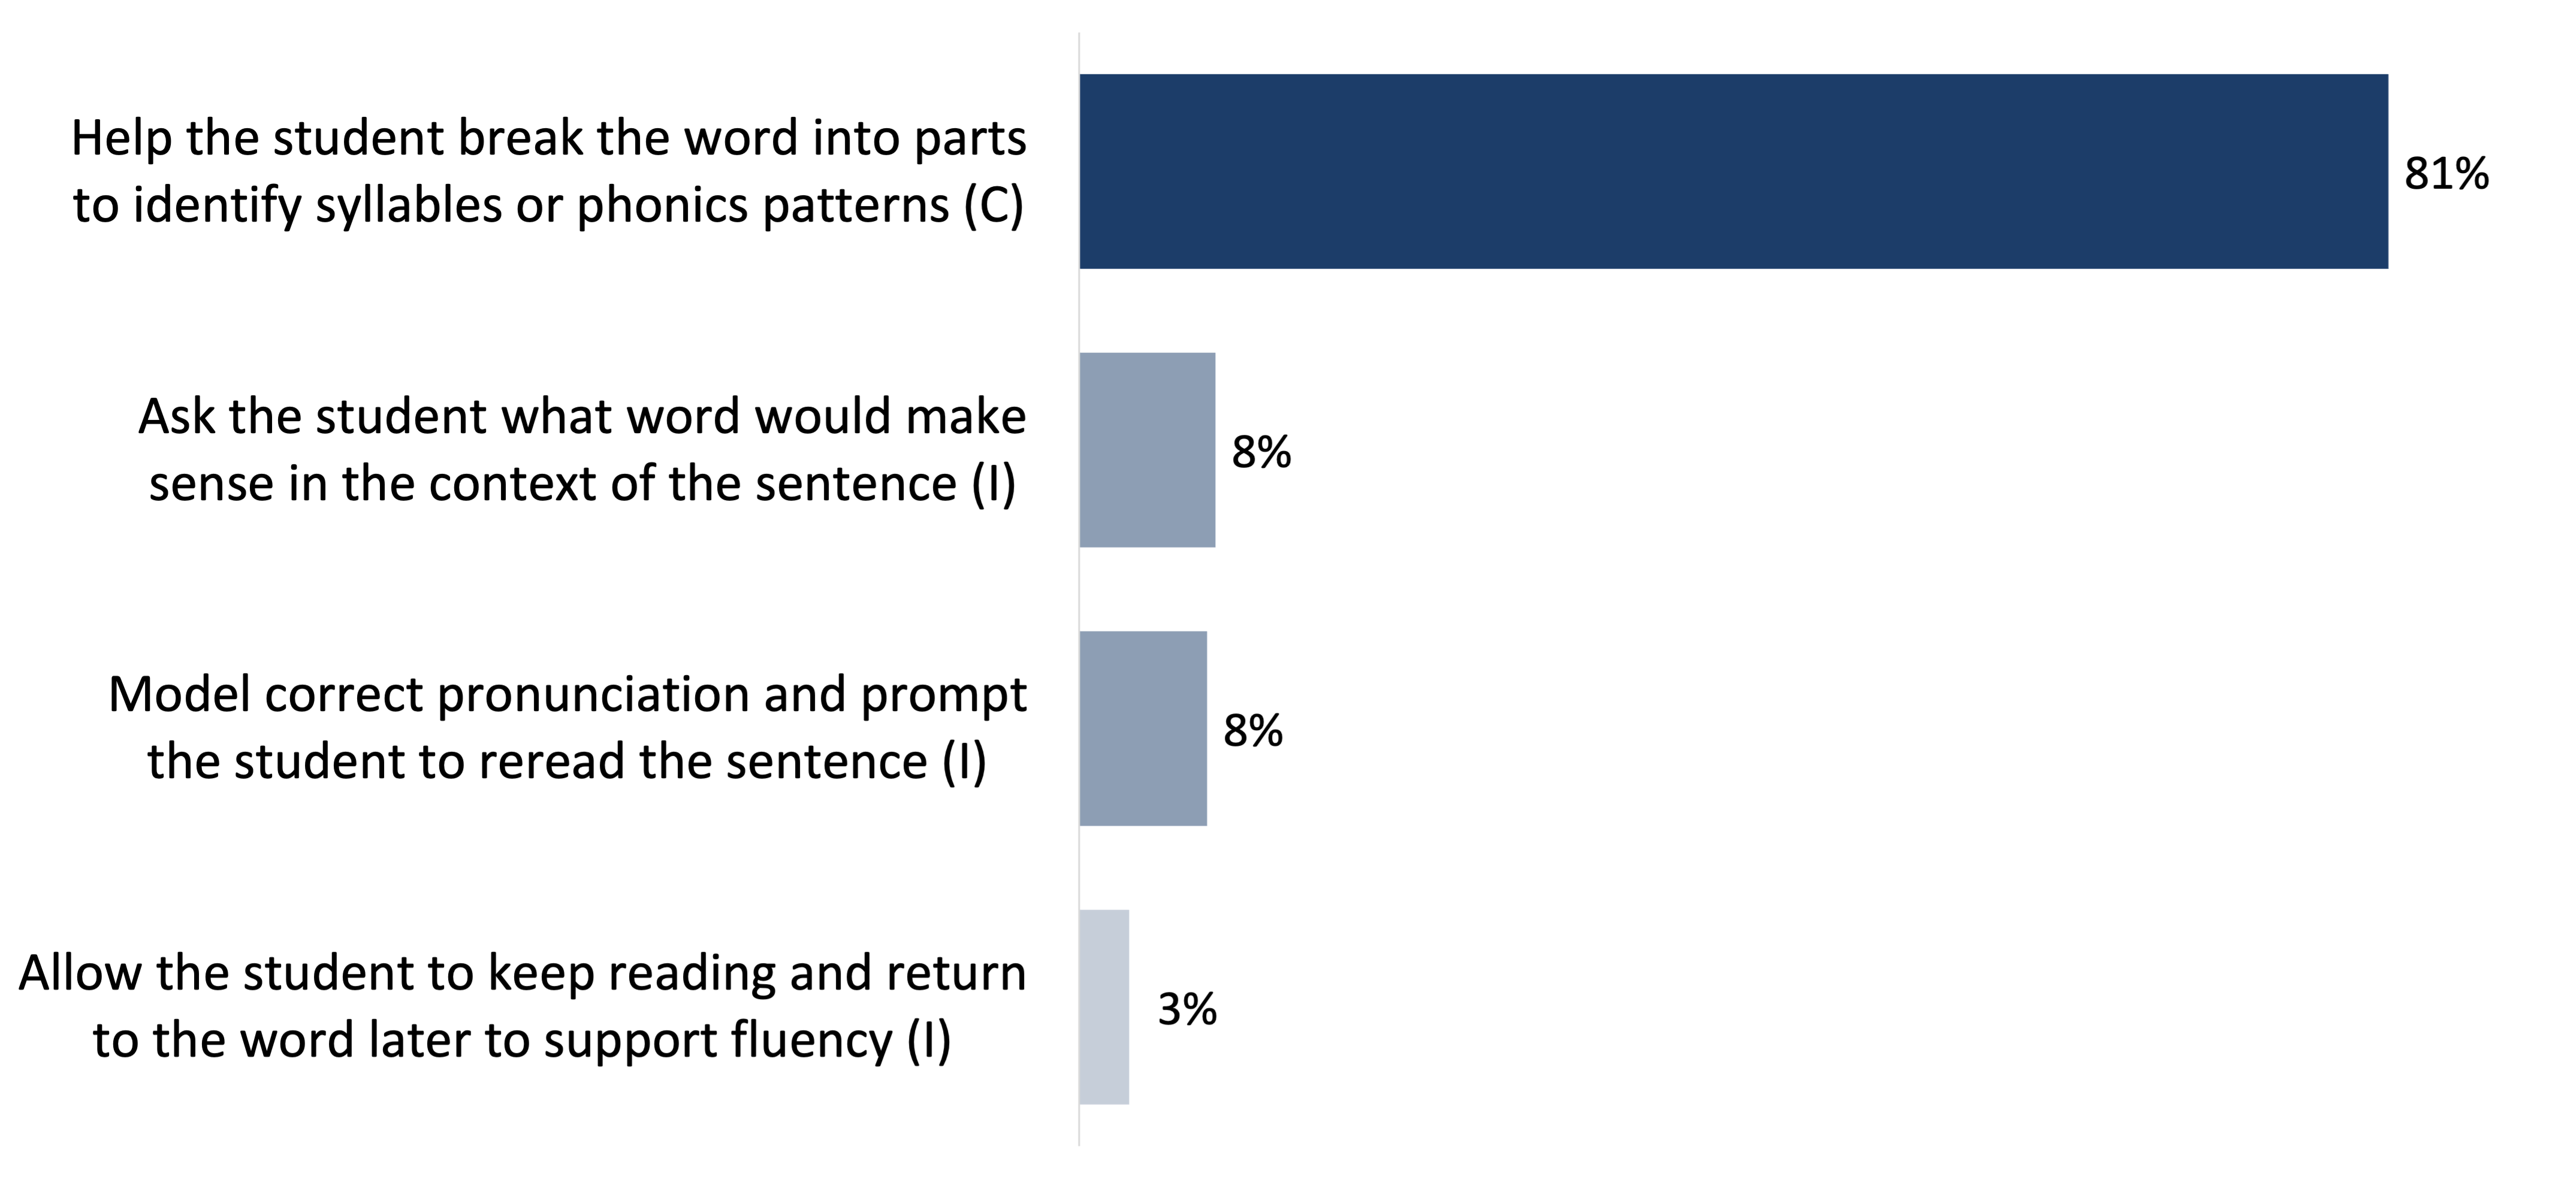
Note: Survey question: “A student in your class is having trouble reading an unfamiliar word during small-group instruction. In your opinion, what should a teacher do first?” Question is based on a similar question from a 2019 survey by Education Week. C = correct response; I = incorrect response.
Overall, just 37 percent of teachers answered all three decoding-related questions correctly. In other words, 63 percent missed at least one question. Moreover, 30 percent missed at least two questions, and 7 percent answered all three questions incorrectly.
In our view, these results suggest that roughly 7 percent of America’s K–3 teachers have little interest in teaching students to decode and that about 30 percent haven’t fully internalized the importance of doing so—though, as their open-ended comments illustrated, many teachers do support the renewed emphasis on phonics (see What do teachers say about the most recent push for phonics?).
Finding 1b: Some teachers still believe that reading comprehension depends on a set of generalizable skills.
Research suggests that reading comprehension depends heavily on what a reader already knows about a topic and the specific vocabulary used in a text. Yet despite this finding, when forced to choose, most teachers (58 percent) say reading comprehension depends on “a set of generalizable skills (like finding the main idea and making inferences) that can be applied to most texts,” as opposed to “what students already know about the topic and the specific vocabulary used in a text” (Figure 5).
Figure 5. Most K–3 teachers mistakenly believe that reading comprehension depends on a set of generalizable skills, as opposed to vocabulary and prior knowledge.
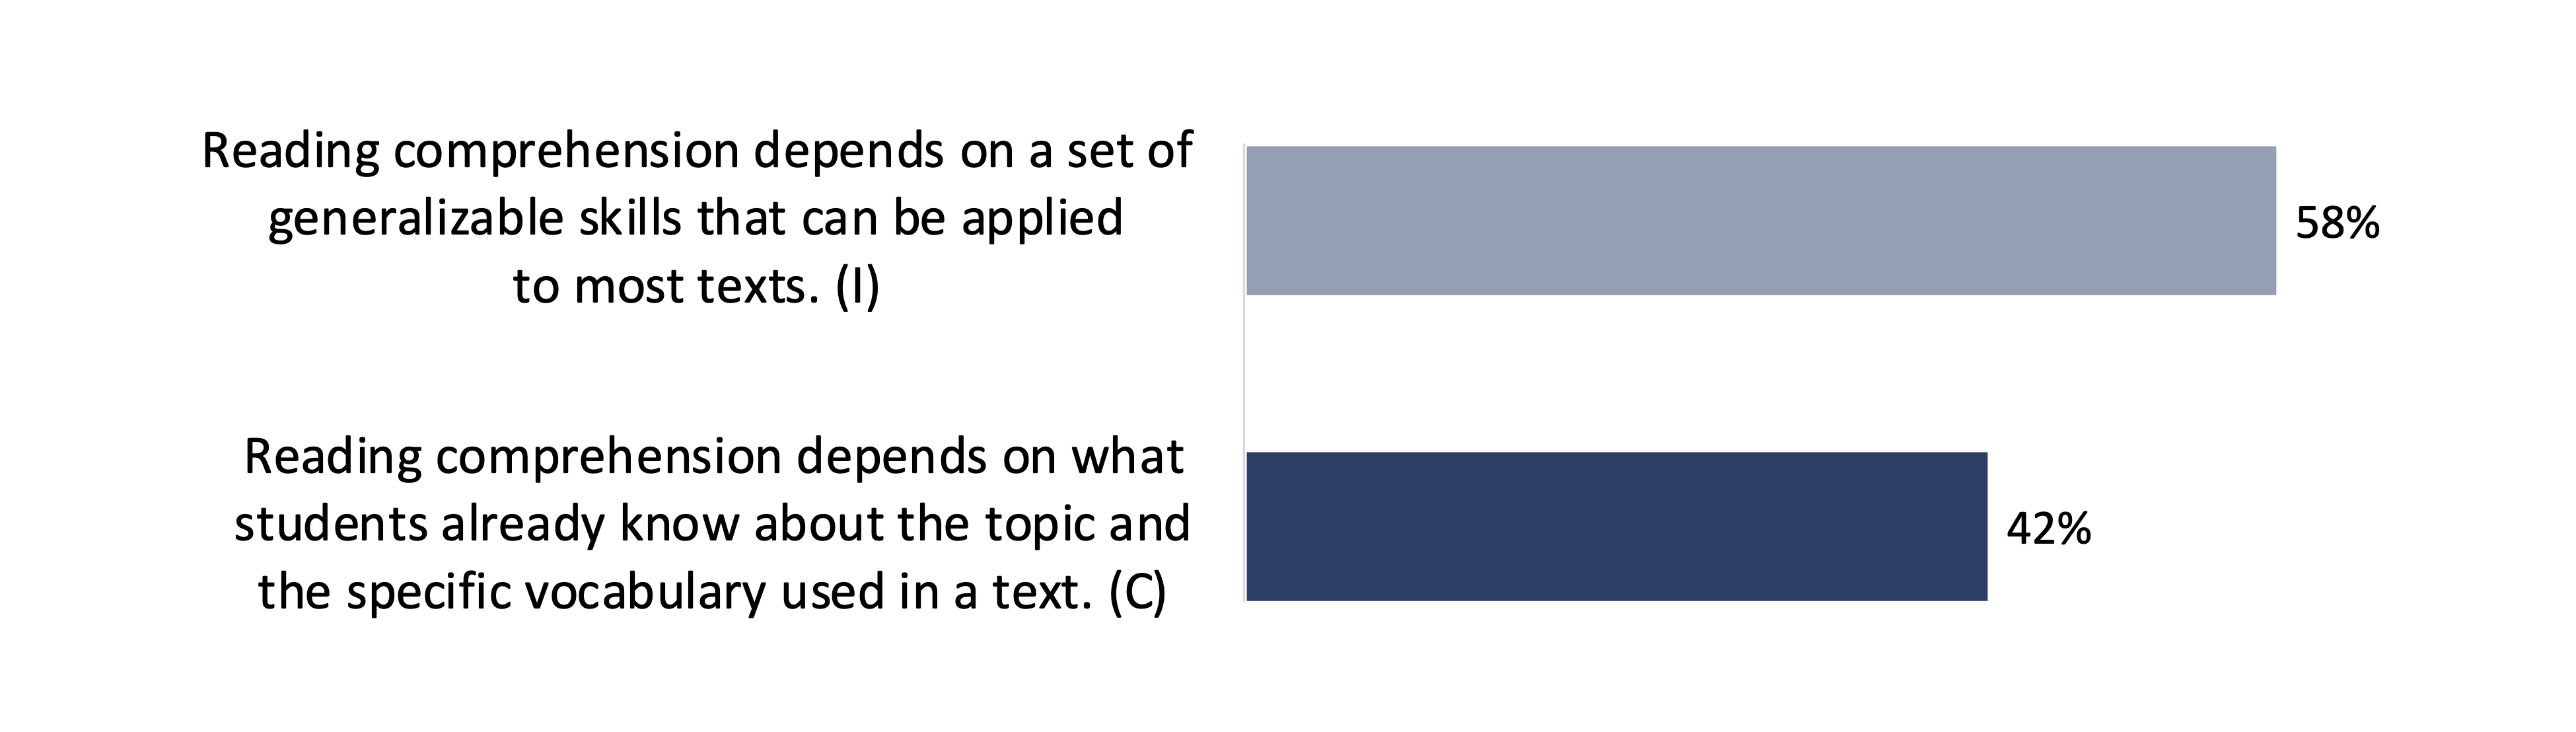
Note: Survey question: “Which statement do you agree with more?” C = correct response; I = incorrect response.
Encouragingly, teachers did better when asked a more specific question about improving vocabulary and comprehension (Figure 6). For example, roughly two-thirds correctly identified “embedding explicit vocabulary instruction in context-rich nonfiction texts” as the most effective way to build vocabulary, though 26 percent chose “teaching students to use context clues to infer the meaning of new words” and 4 percent chose “encouraging students to read age-appropriate fiction independently.”
Figure 6. At least two-thirds of K–3 reading teachers correctly believe that embedding explicit vocabulary instruction in content-rich texts is the best way to build vocabulary.
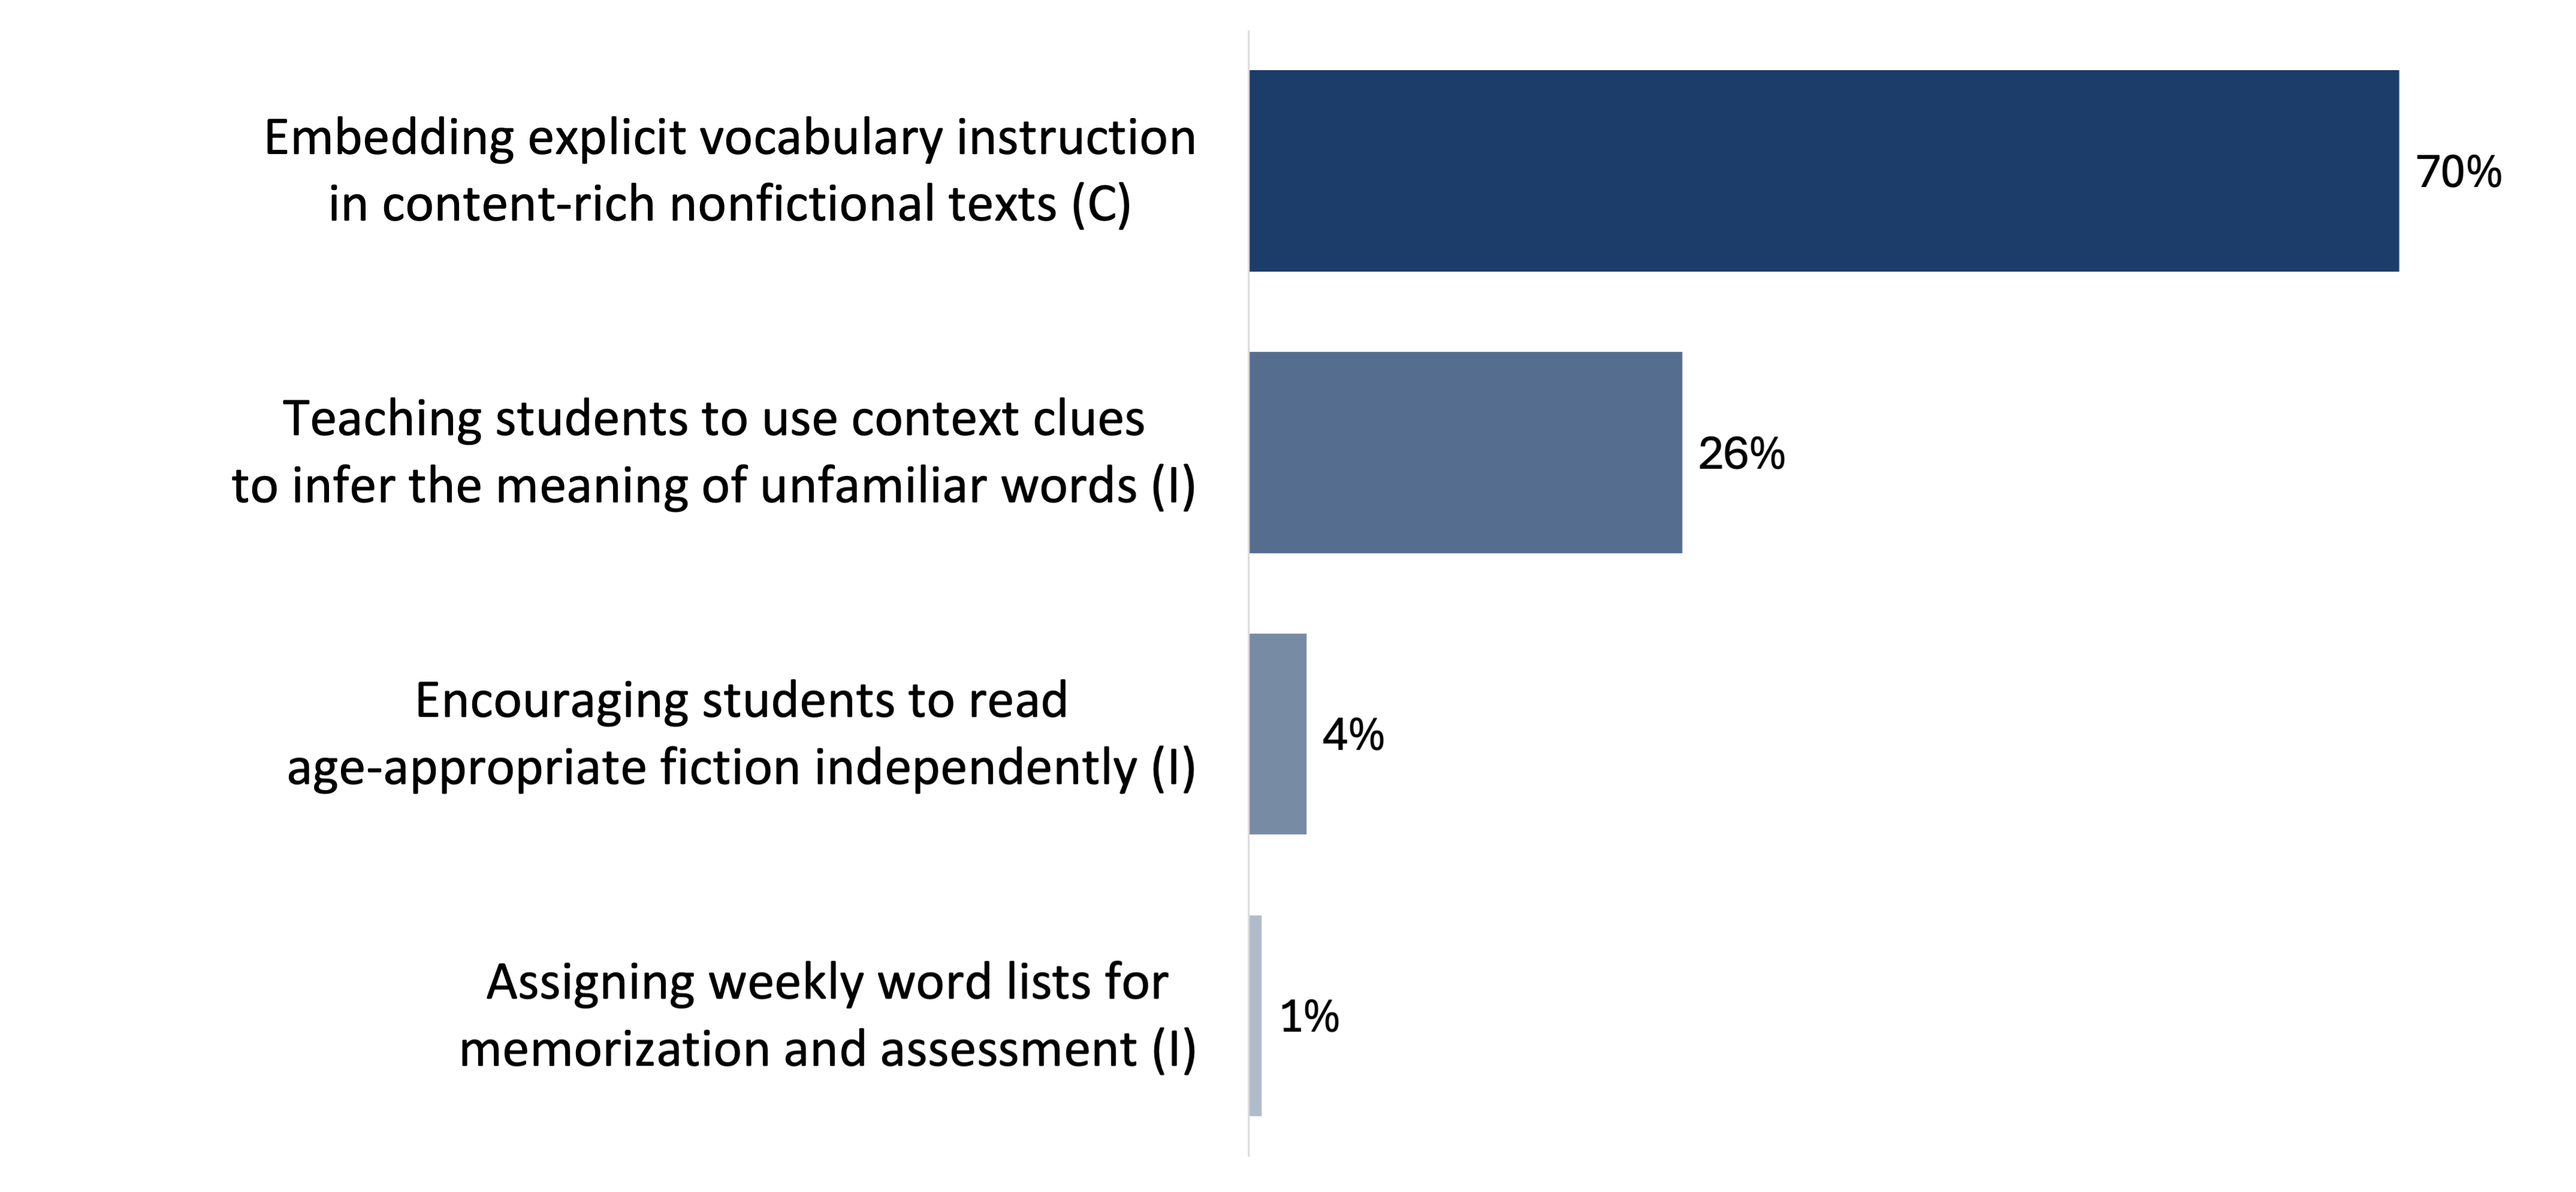
Note: Survey question: “In your opinion, which of the following is the best way to build vocabulary?” C = correct response; I = incorrect response.
Similarly, 60 percent of teachers correctly identified “providing content-rich instruction to build background knowledge across subjects” as the best way to improve reading comprehension. However, 19 percent chose “teaching students how to find the main idea and supporting details,” 17 percent chose “using leveled texts that are matched to students’ reading levels,” and 5 percent chose “encouraging students to read independently on a regular basis” (Figure 7).
Figure 7. Most K–3 reading teachers correctly believe that providing content-rich instruction is the best way to improve reading comprehension.
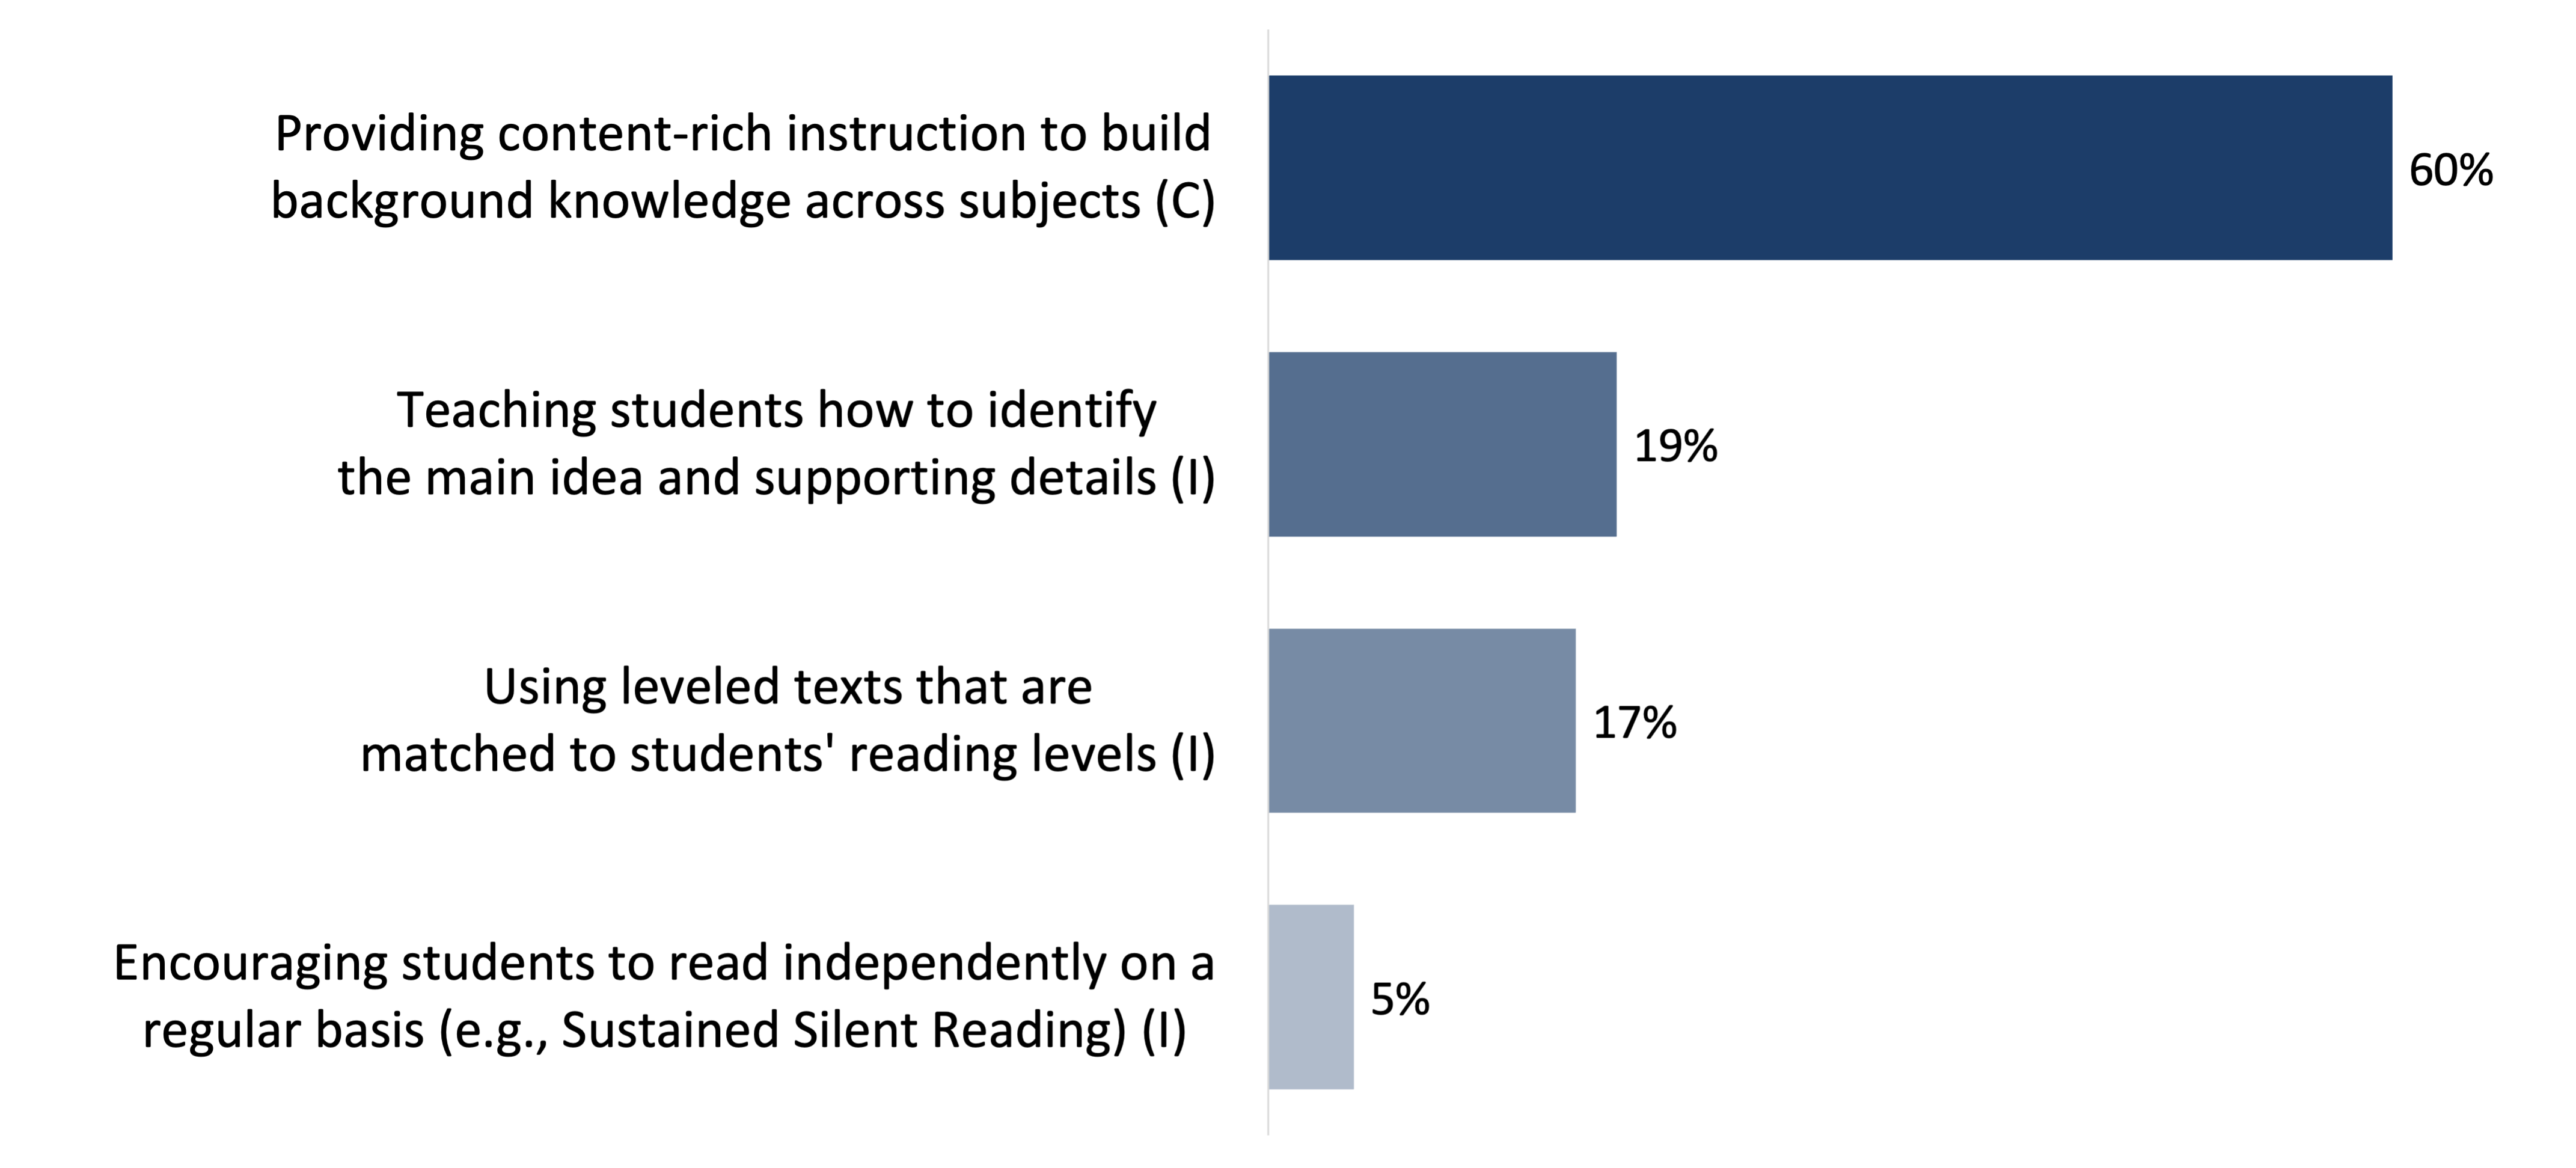
Note: Survey question: “In your opinion, which of the following is the best way to improve reading comprehension?” C = correct response; I = incorrect response.
Overall, just 23 percent of teachers answered all three reading comprehension questions correctly. In other words, 77 percent missed at least one question. Moreover, 43 percent of teachers missed at least two questions, and 14 percent answered all three questions incorrectly.
In our view, these results suggest that roughly 14 percent of America’s K–3 teachers have little interest in a knowledge-based approach and that about 43 percent haven’t fully internalized the importance of knowledge and vocabulary to reading comprehension—though it’s clear from teachers’ comments that there is progress on this front (see What do teachers say about the push for a knowledge-based approach?).
Finding 1c: Some teachers have limited insight into the needs of English learners and students with dyslexia.
In general, teachers’ responses to questions that focused on specific student populations suggest the need for additional training and supportive materials. For example, while most teachers (95 percent) understand that English learners benefit from explicit phonics instruction and exposure to academic language and syntax, fewer (86 percent) understand that “using visuals and oral explanations to support comprehension” is effective, and fewer still (64 percent) understand that “building vocabulary through conversation and read-alouds” can also be effective (Figure 8).
Figure 8. Most K–3 teachers understand that English learners need phonics, but some have a limited grasp of effective approaches to building their vocabulary.
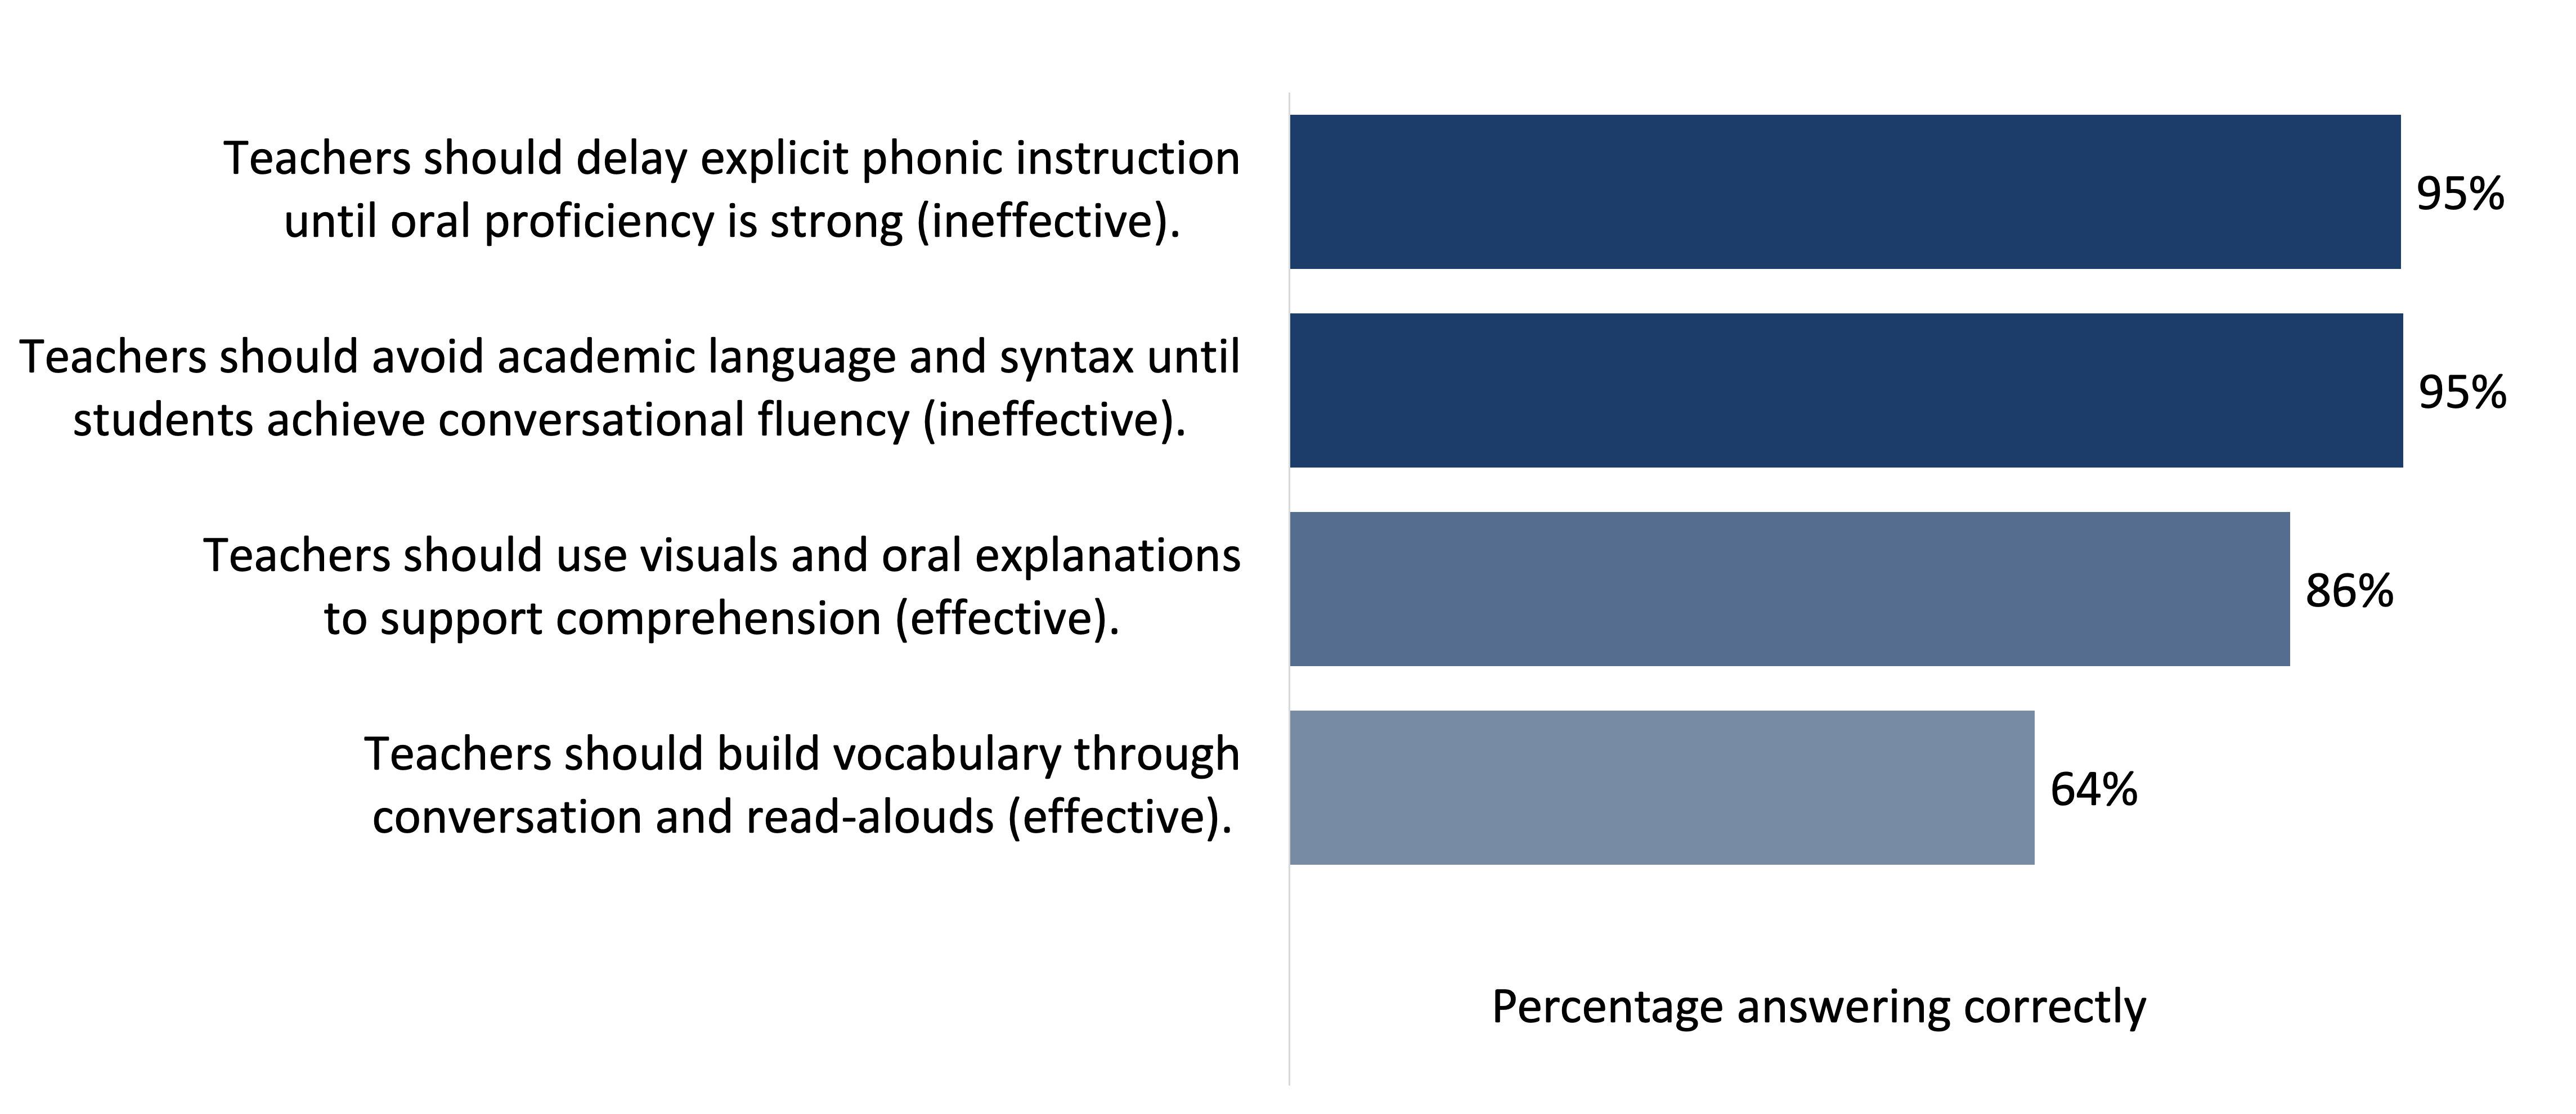
Note: Survey question: “In your opinion, which of the following are effective ways to meet the needs of English learners?” Figure shows the percentages of teachers who correctly identified each statement as effective or ineffective.
“As a teacher of English [l]earners and training in the [science of reading] … [I think] instruction must emphasize pre-teaching vocabulary and using visuals and background knowledge to build meaning, which allows for comprehension.”
“Many teachers are not differentiating the materials so that EL [(English learner)] students are able to have access to the content and curriculum. This causes a greater gap between EL students and their peers.”
Similarly, most teachers (95 percent) understand that students with dyslexia benefit from explicit phonics instruction and often struggle with decoding despite having strong oral language skills (76 percent). However, fewer teachers (61 percent) understand that students with dyslexia often have difficulty identifying and manipulating the sounds in words, and most (56 percent) still mistakenly believe that students with dyslexia have difficulty reading because they confuse or reverse letters and words—something dyslexic and non-dyslexic students do at indistinguishable rates when they are learning to read (Figure 9). Overall, just 17 percent of teachers answered all four dyslexia-related questions correctly.
Figure 9. More than half of K–3 teachers (56 percent) mistakenly believe that students with dyslexia have difficulty reading because they confuse or reverse letters and words.
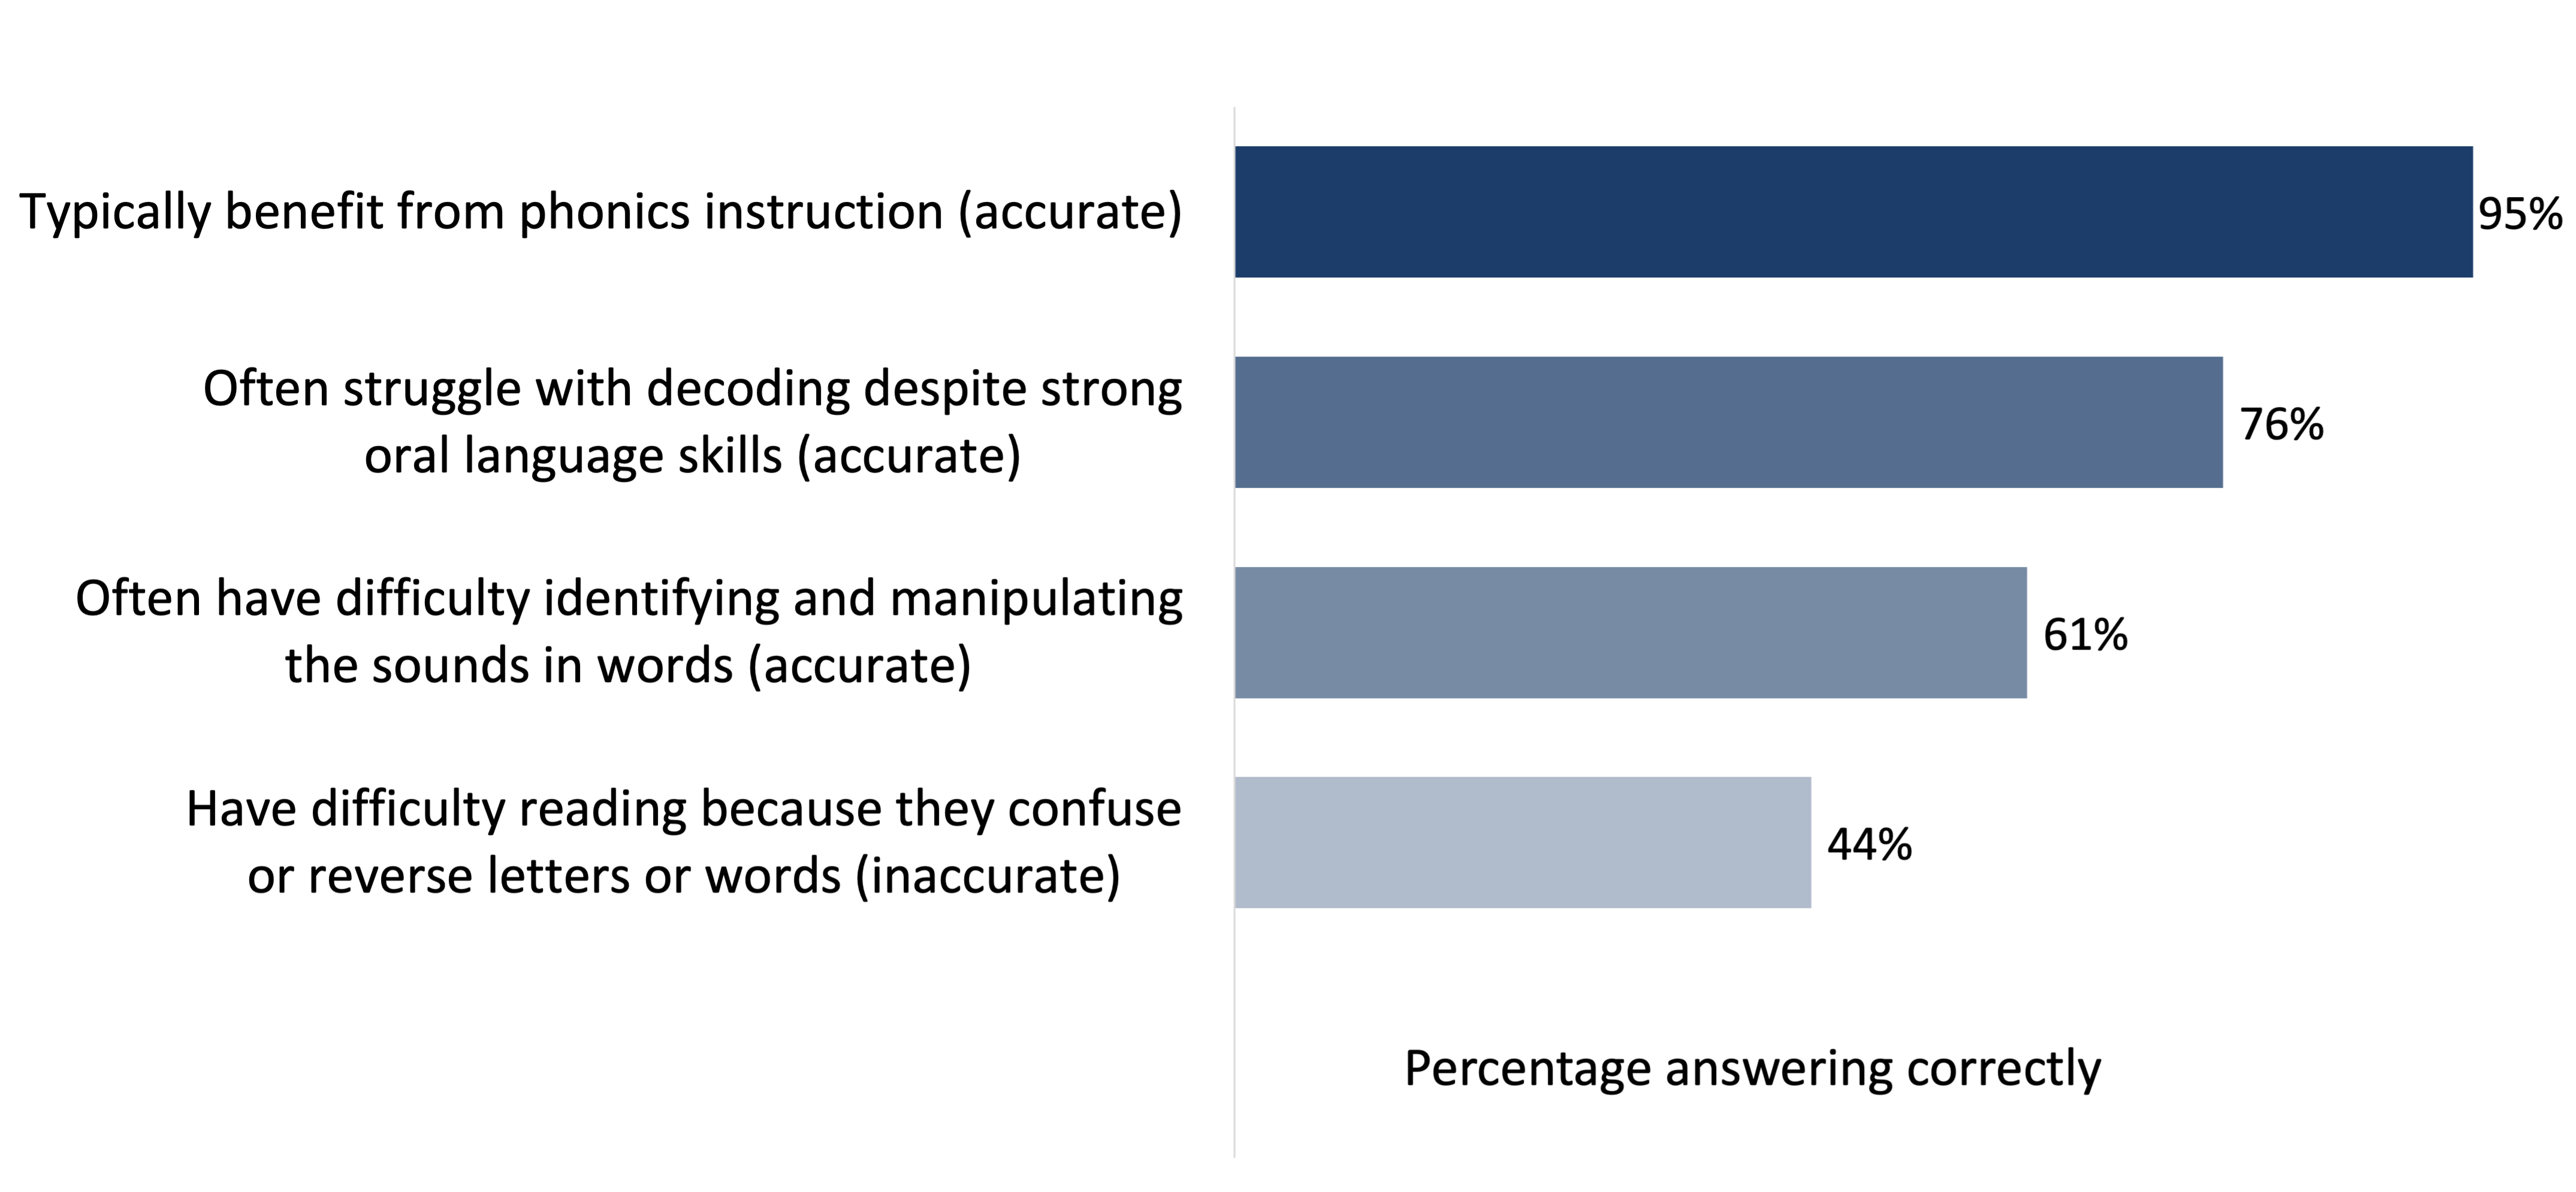
Note: Survey question: “Based on your understanding of the condition, which of the following claims about dyslexia are accurate?” Figure shows the percentages of teachers who correctly identified each statement as accurate or inaccurate.
“I have seen huge growth in my special education students with systematic and structured phonics teaching.”
“I’ve learned a lot about dyslexia. This is something we didn’t learn about when I was in pre-teacher training. Now I feel I can help all my students succeed.”
Finding 1d. Teachers’ knowledge of reading science declines as the grade level increases.
Notably, the survey results suggest that knowledge of reading science declines with a teacher’s grade level, with kindergarten teachers exhibiting the deepest knowledge and third-grade teachers exhibiting the least understanding (Figure 10). Moreover, although these differences are particularly clear for decoding (which makes sense, given the number of students who have learned to decode by the time they reach third grade), they are also apparent when it comes to reading comprehension (which becomes increasingly central to teachers’ goals as the grade level increases).
Among other things, these differences may reflect the fact that science of reading–aligned trainings and curricula often disproportionately target kindergarten, where a focus on decoding is particularly crucial. Still, given the number of third graders who are still struggling with decoding—and the continuing need to build knowledge and vocabulary in higher grades—the mediocre performance of teachers in higher grade levels is grounds for concern.
Figure 10. Teachers’ knowledge of reading science declines as the grade level increases.
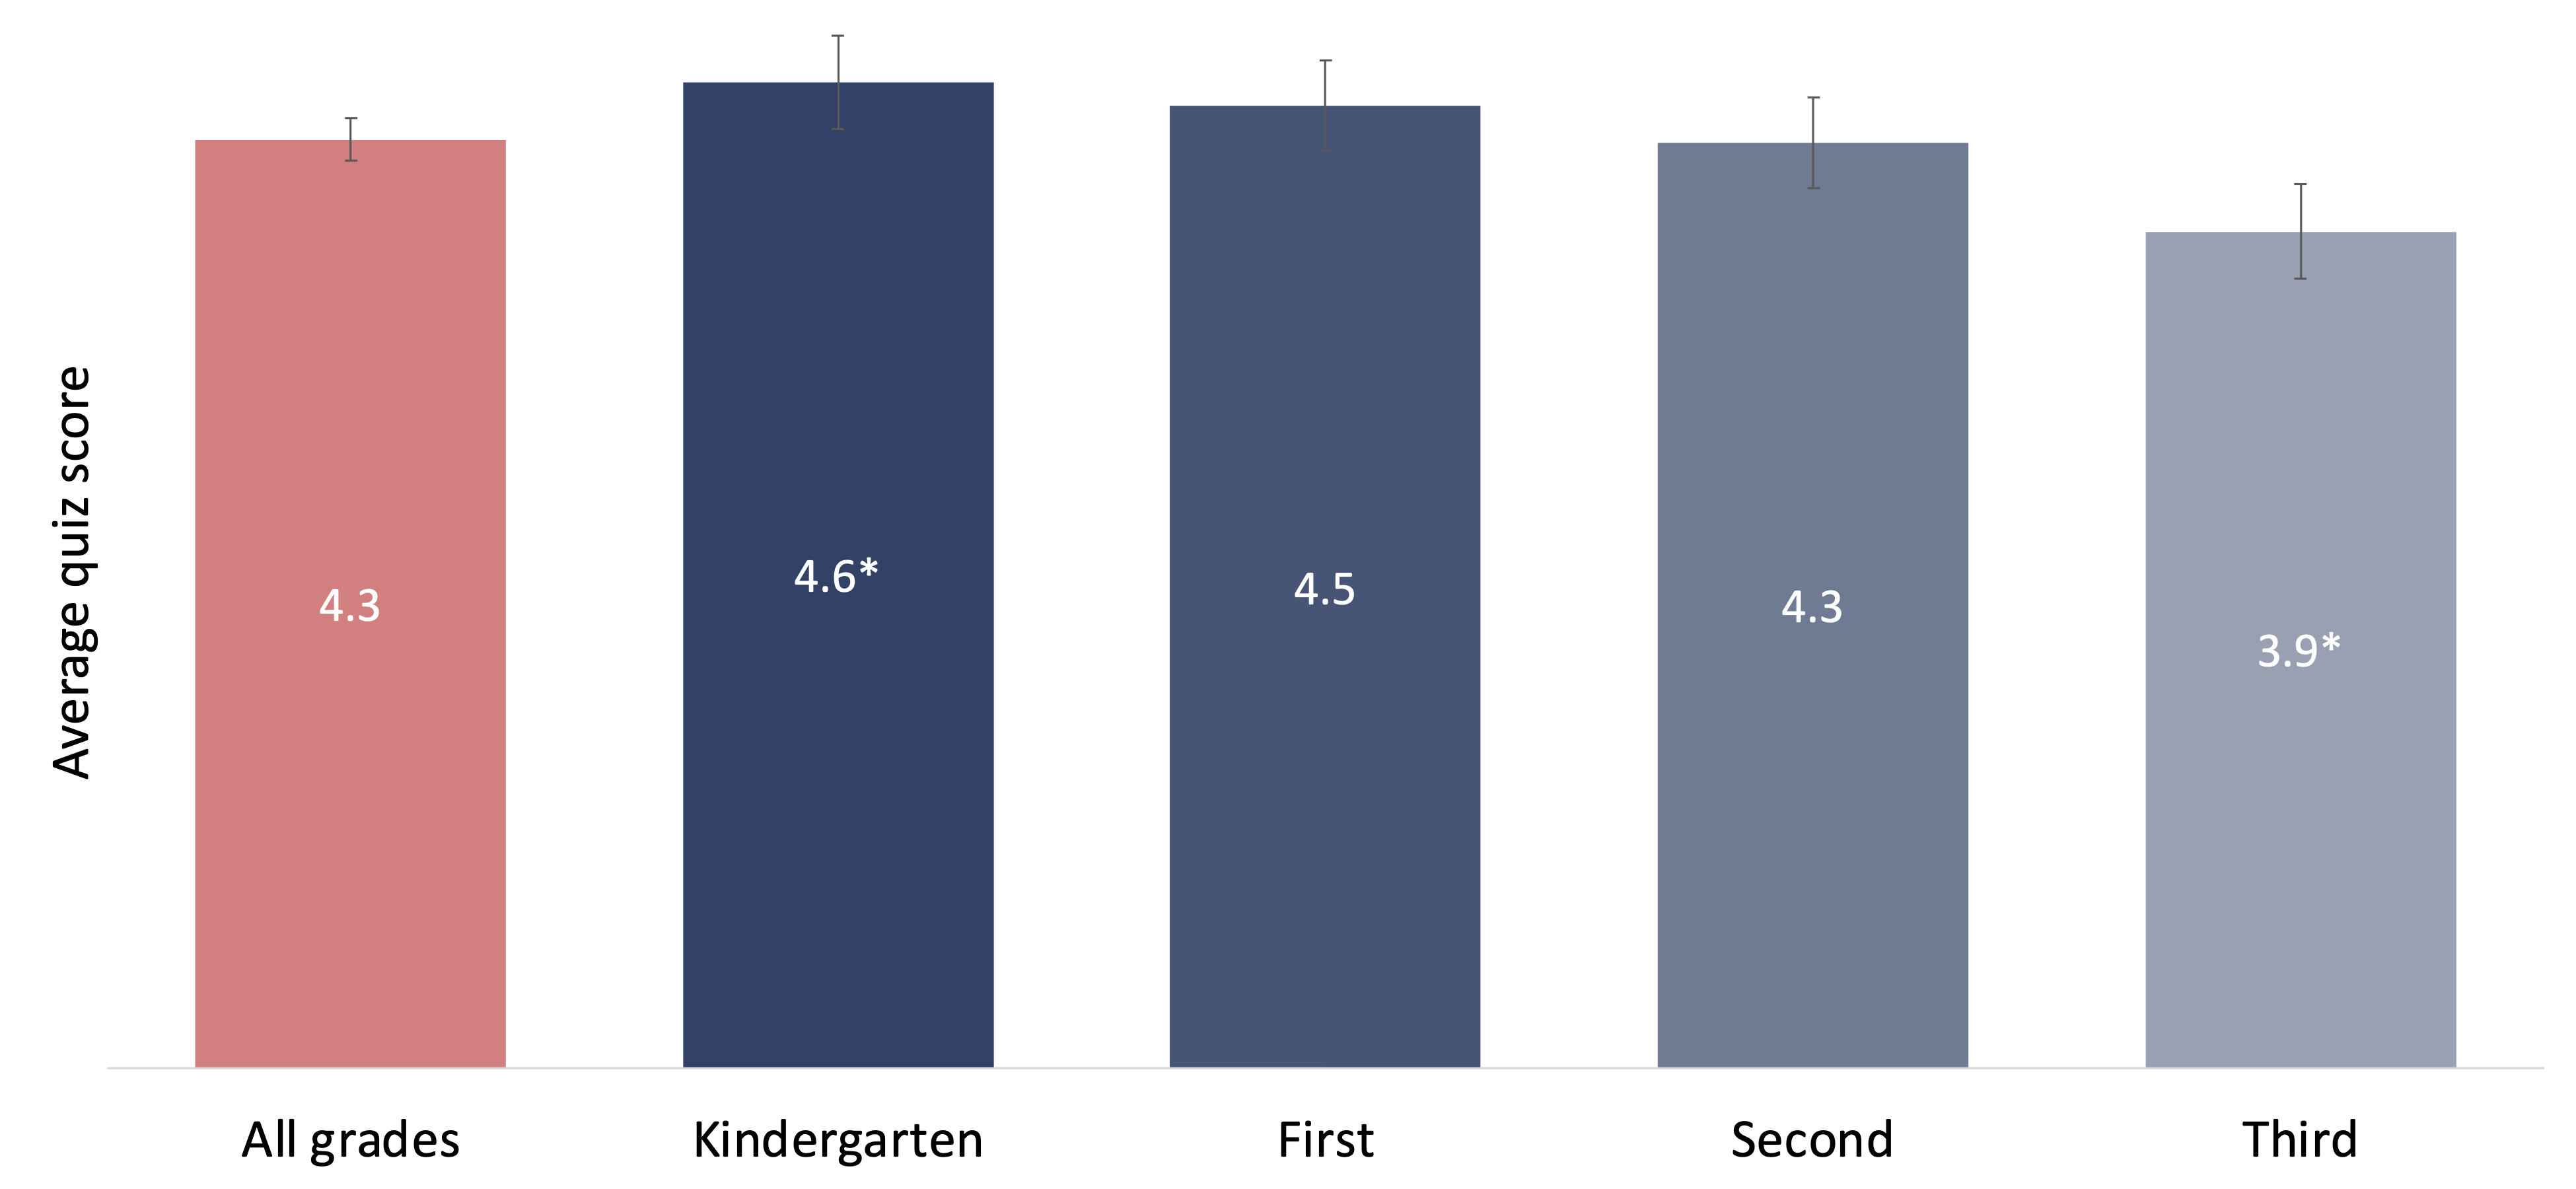
Note: An asterisk indicates a difference that is statistically significant at the 95 percent confidence level. The peach-colored bar indicates the reference category (“All grades”).
“As a third-grade teacher I am not provided with much or any instruction or professional learning on teaching kids to read, because we are at the point where they should begin reading to learn. However, more and more I have students coming to me unable to decode and I am lacking in knowledge of how to support them. My curriculum is lacking any phonics piece, and what supplements I have been provided I have not been trained to use.”
“As a third-grade teacher, I used to focus on vocabulary, reading comprehension, and increasing fluency. Phonics instruction was used in a small group intervention setting. Now, incoming third graders require intensive phonics instruction as most of them can’t read at even a second-grade level. I was never trained in how to teach phonics, yet I teach it like any other curriculum to my whole class each day. Student need aligns more with ‘reading to learn’ instead of ‘learning to read’ but our third-grade curriculum is still very heavy in comprehension and vocab. There aren’t enough minutes in the day, and we don’t have enough leveled text to support students at all their different reading levels.”
Finding 1e. Teachers in disadvantaged settings are particularly likely to exhibit a limited understanding of the science of reading.
Understanding how teachers’ knowledge of reading science differs by setting is important. After all, a substantial body of research suggests that students in more disadvantaged settings are more dependent on teacher quality[8] and other factors[9] because they have fewer compensating resources upon which to draw.
On average, teachers in high-poverty neighborhoods and schools whose student bodies are mostly nonwhite exhibit less knowledge of and commitment to reading science than teachers in low-poverty neighborhoods and majority-white schools. Similarly, male teachers and nonwhite teachers exhibit less knowledge than female teachers and white teachers, perhaps because they are concentrated in high-poverty and majority-nonwhite schools (Figure 11).
Figure 11. Teachers in disadvantaged settings exhibit less understanding of reading science.
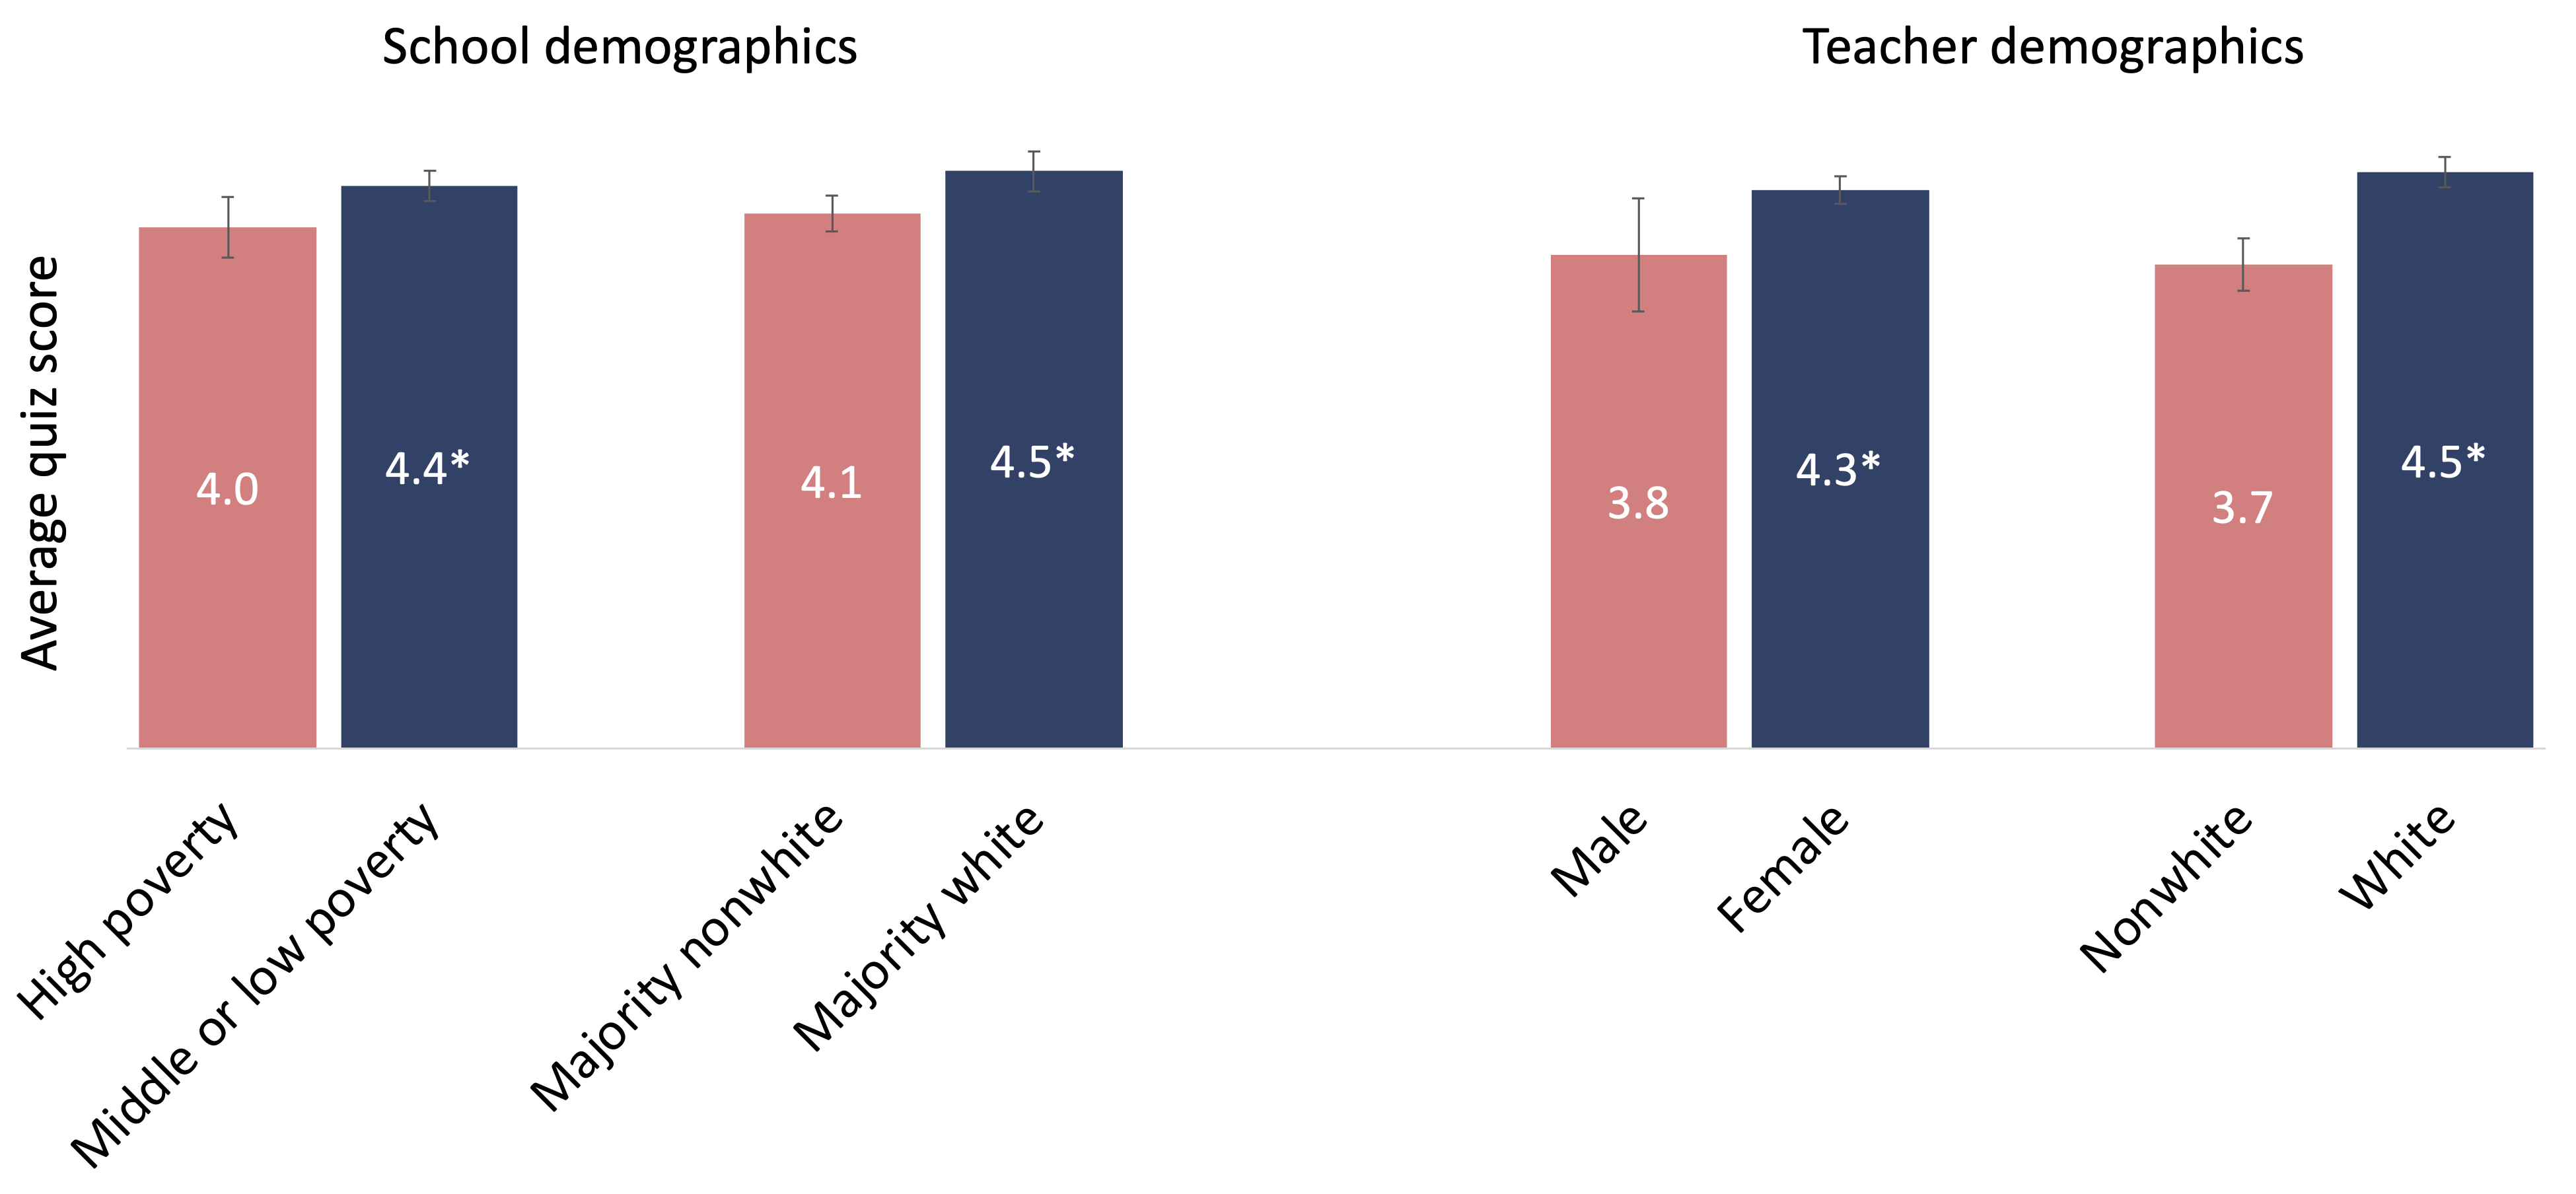
Note: An asterisk indicates a difference that is statistically significant at the 95 percent confidence level. The peach-colored bars indicate the reference categories (the left bar in each pair).
Although these differences aren’t overwhelming, they are meaningful. For example, moving from a high-poverty setting to a low-poverty setting is equivalent to moving from the 44th percentile of teacher knowledge to the 54th percentile—not just for one year of elementary school but for all of them.
Notably, this difference is driven by the “decoding” portion of the quiz. For example, 37 percent of teachers in high-poverty settings missed at least two decoding questions, compared with 26 percent of teachers in low-poverty settings. And when given the choice, 43 percent of teachers in high-poverty settings failed to express a clear preference for phonics over cueing, compared with 25 percent of teachers in low-poverty settings.
In short, despite circumstantial evidence of progress, our results suggest that at least a third of K–3 teachers in disadvantaged settings still aren’t fully committed to the science of reading.
Finding 2 Teachers who rely on their preservice training know less about the science of reading than teachers who receive in-service training.
As noted, our survey included numerous questions about teachers’ exposure to science of reading supports, including the science of reading content of preservice preparation programs and the specific in-service trainings that teachers have completed. Below, we summarize those two forms of exposure and their relationships to teachers’ knowledge of reading science.
Finding 2a. In recent years, most K–3 teachers have received professional development in the science of reading.
Encouragingly, more than half of K–3 teachers (52 percent) reported that their recent professional development had placed “a lot” of emphasis on the science of reading. Specifically, more than half of teachers (56 percent) said their recent professional development had put a lot of emphasis on phonics in the previous two to three years (Figure 12), and almost as many (48 percent) said it had put a lot of emphasis on phonemic awareness.
Other science of reading pillars have received less attention. For example, about a quarter of teachers (26 percent) said their professional development had put a lot of emphasis on reading comprehension, and only a fifth (21 percent) said it had put a lot of emphasis on vocabulary. Still, most of the reading-related topics in the survey had received at least “some” emphasis, according to teachers. For example, just over two-thirds (70 percent) reported that “high quality reading curricula” had received at least some emphasis.
Figure 12. Phonics has been a primary focus of K–3 teachers’ recent professional development.
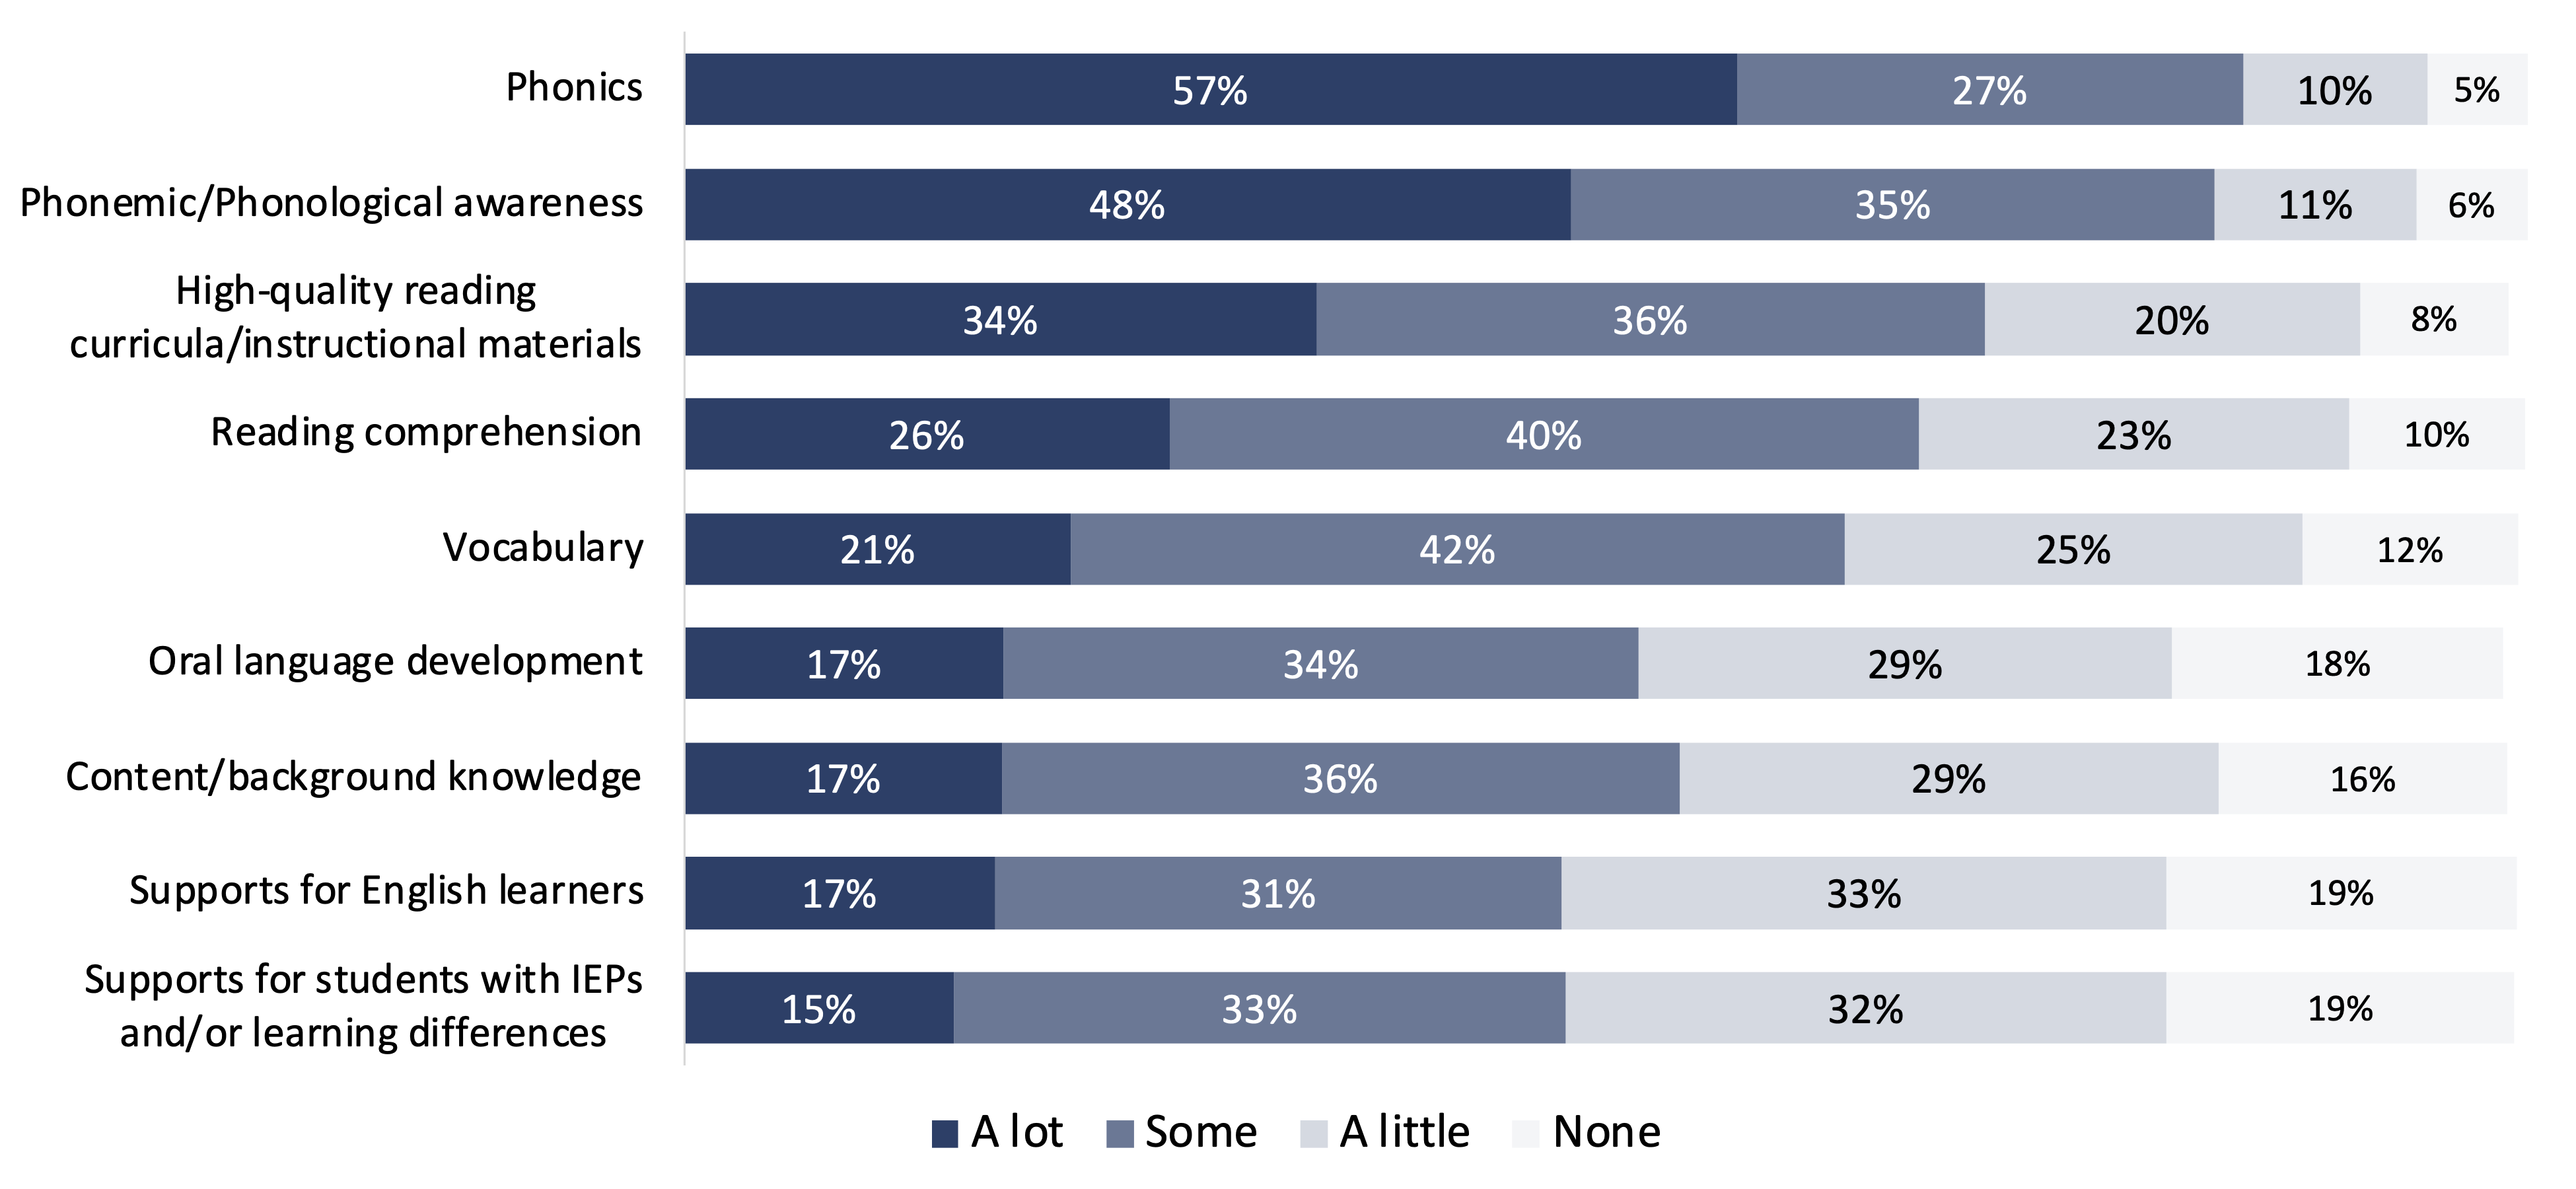
Note: Survey question: “Overall, how much emphasis has your professional development put on each of the following reading-related topics in the past 2–3 years?” Question is modeled on similar questions from recent RAND reports; however, the Fordham version included additional topics. A small percentage of teachers selected “I don’t remember” and were removed for the sake of simplicity.
Overall, 82 percent of teachers said they had completed at least one science of reading–aligned training in the previous two to three years, with many reporting that they had completed multiple trainings. Per Figure 13, the most popular training completed by respondents was LETRS (34 percent), followed by Heggerty training (28 percent), University of Florida Literacy Institute (UFLI) training (22 percent), and professional development provided and/or sponsored by the state (16 percent).[10]
Figure 13. Roughly a third of the nation’s K–3 teachers have completed the LETRS training.
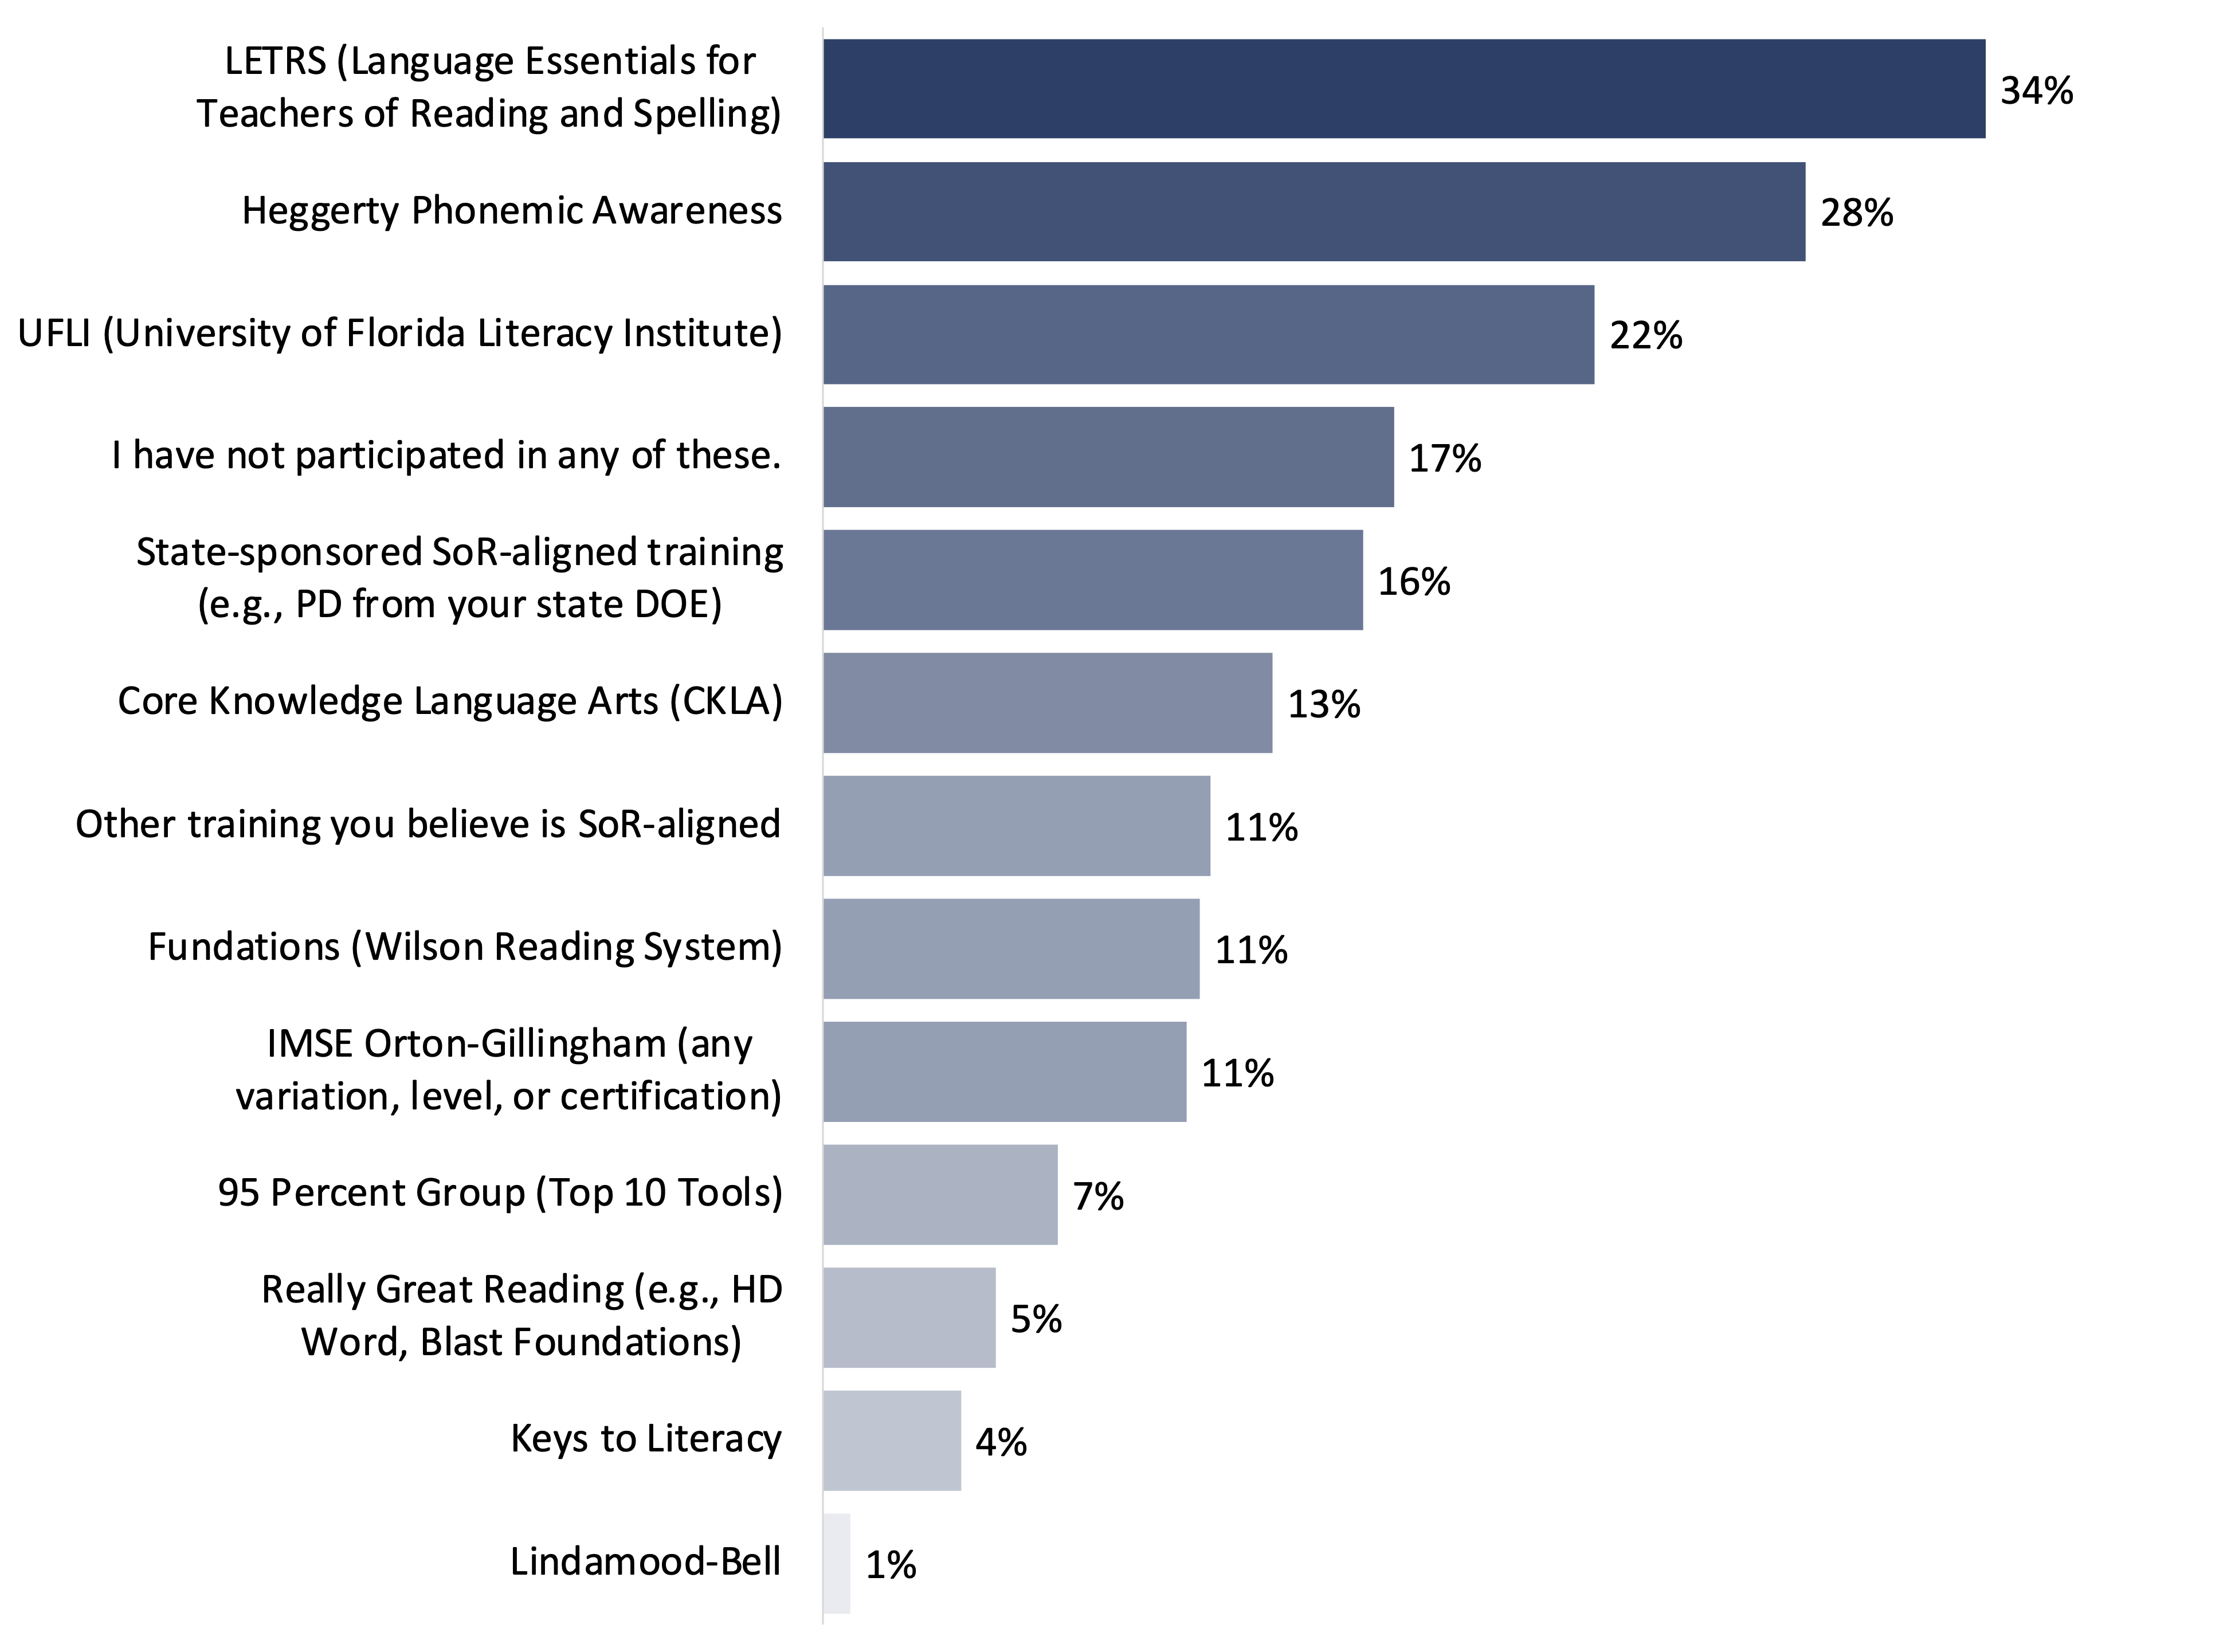
Note: Survey question: “Which of the following science of reading–aligned trainings have you completed in the last 2–3 years?”
In general, teachers gave their recent reading/literacy professional development high marks, with three-quarters (75 percent) saying it had been at least “moderately” useful, nearly two-fifths (37 percent) saying it had been “extremely” or “very” useful, and just 6 percent of teachers saying it had not been useful at all (not shown).
Notably, many teachers praised LETRS and UFLI trainings in their open responses (see What do teachers say about science of reading trainings?).
Finding 2b. Preservice preparation programs put less emphasis on the science of reading than teachers’ in-service professional development.
In general, teachers reported that science of reading–related topics had received less emphasis in their preservice preparation than in their in-service professional development (Figure 14). For example, while 57 percent of teachers said their recent professional development had put a lot of emphasis on phonics, only 23 percent said their preservice preparation program had. Similarly, fewer teachers said their preservice programs had put a lot of emphasis on phonemic/phonological awareness (48 percent versus 21 percent), vocabulary (21 percent versus 14 percent), and supports for English learners (17 percent versus 11 percent).
Figure 14. Preservice preparation programs put less emphasis on the science of reading than teachers’ in-service professional development.
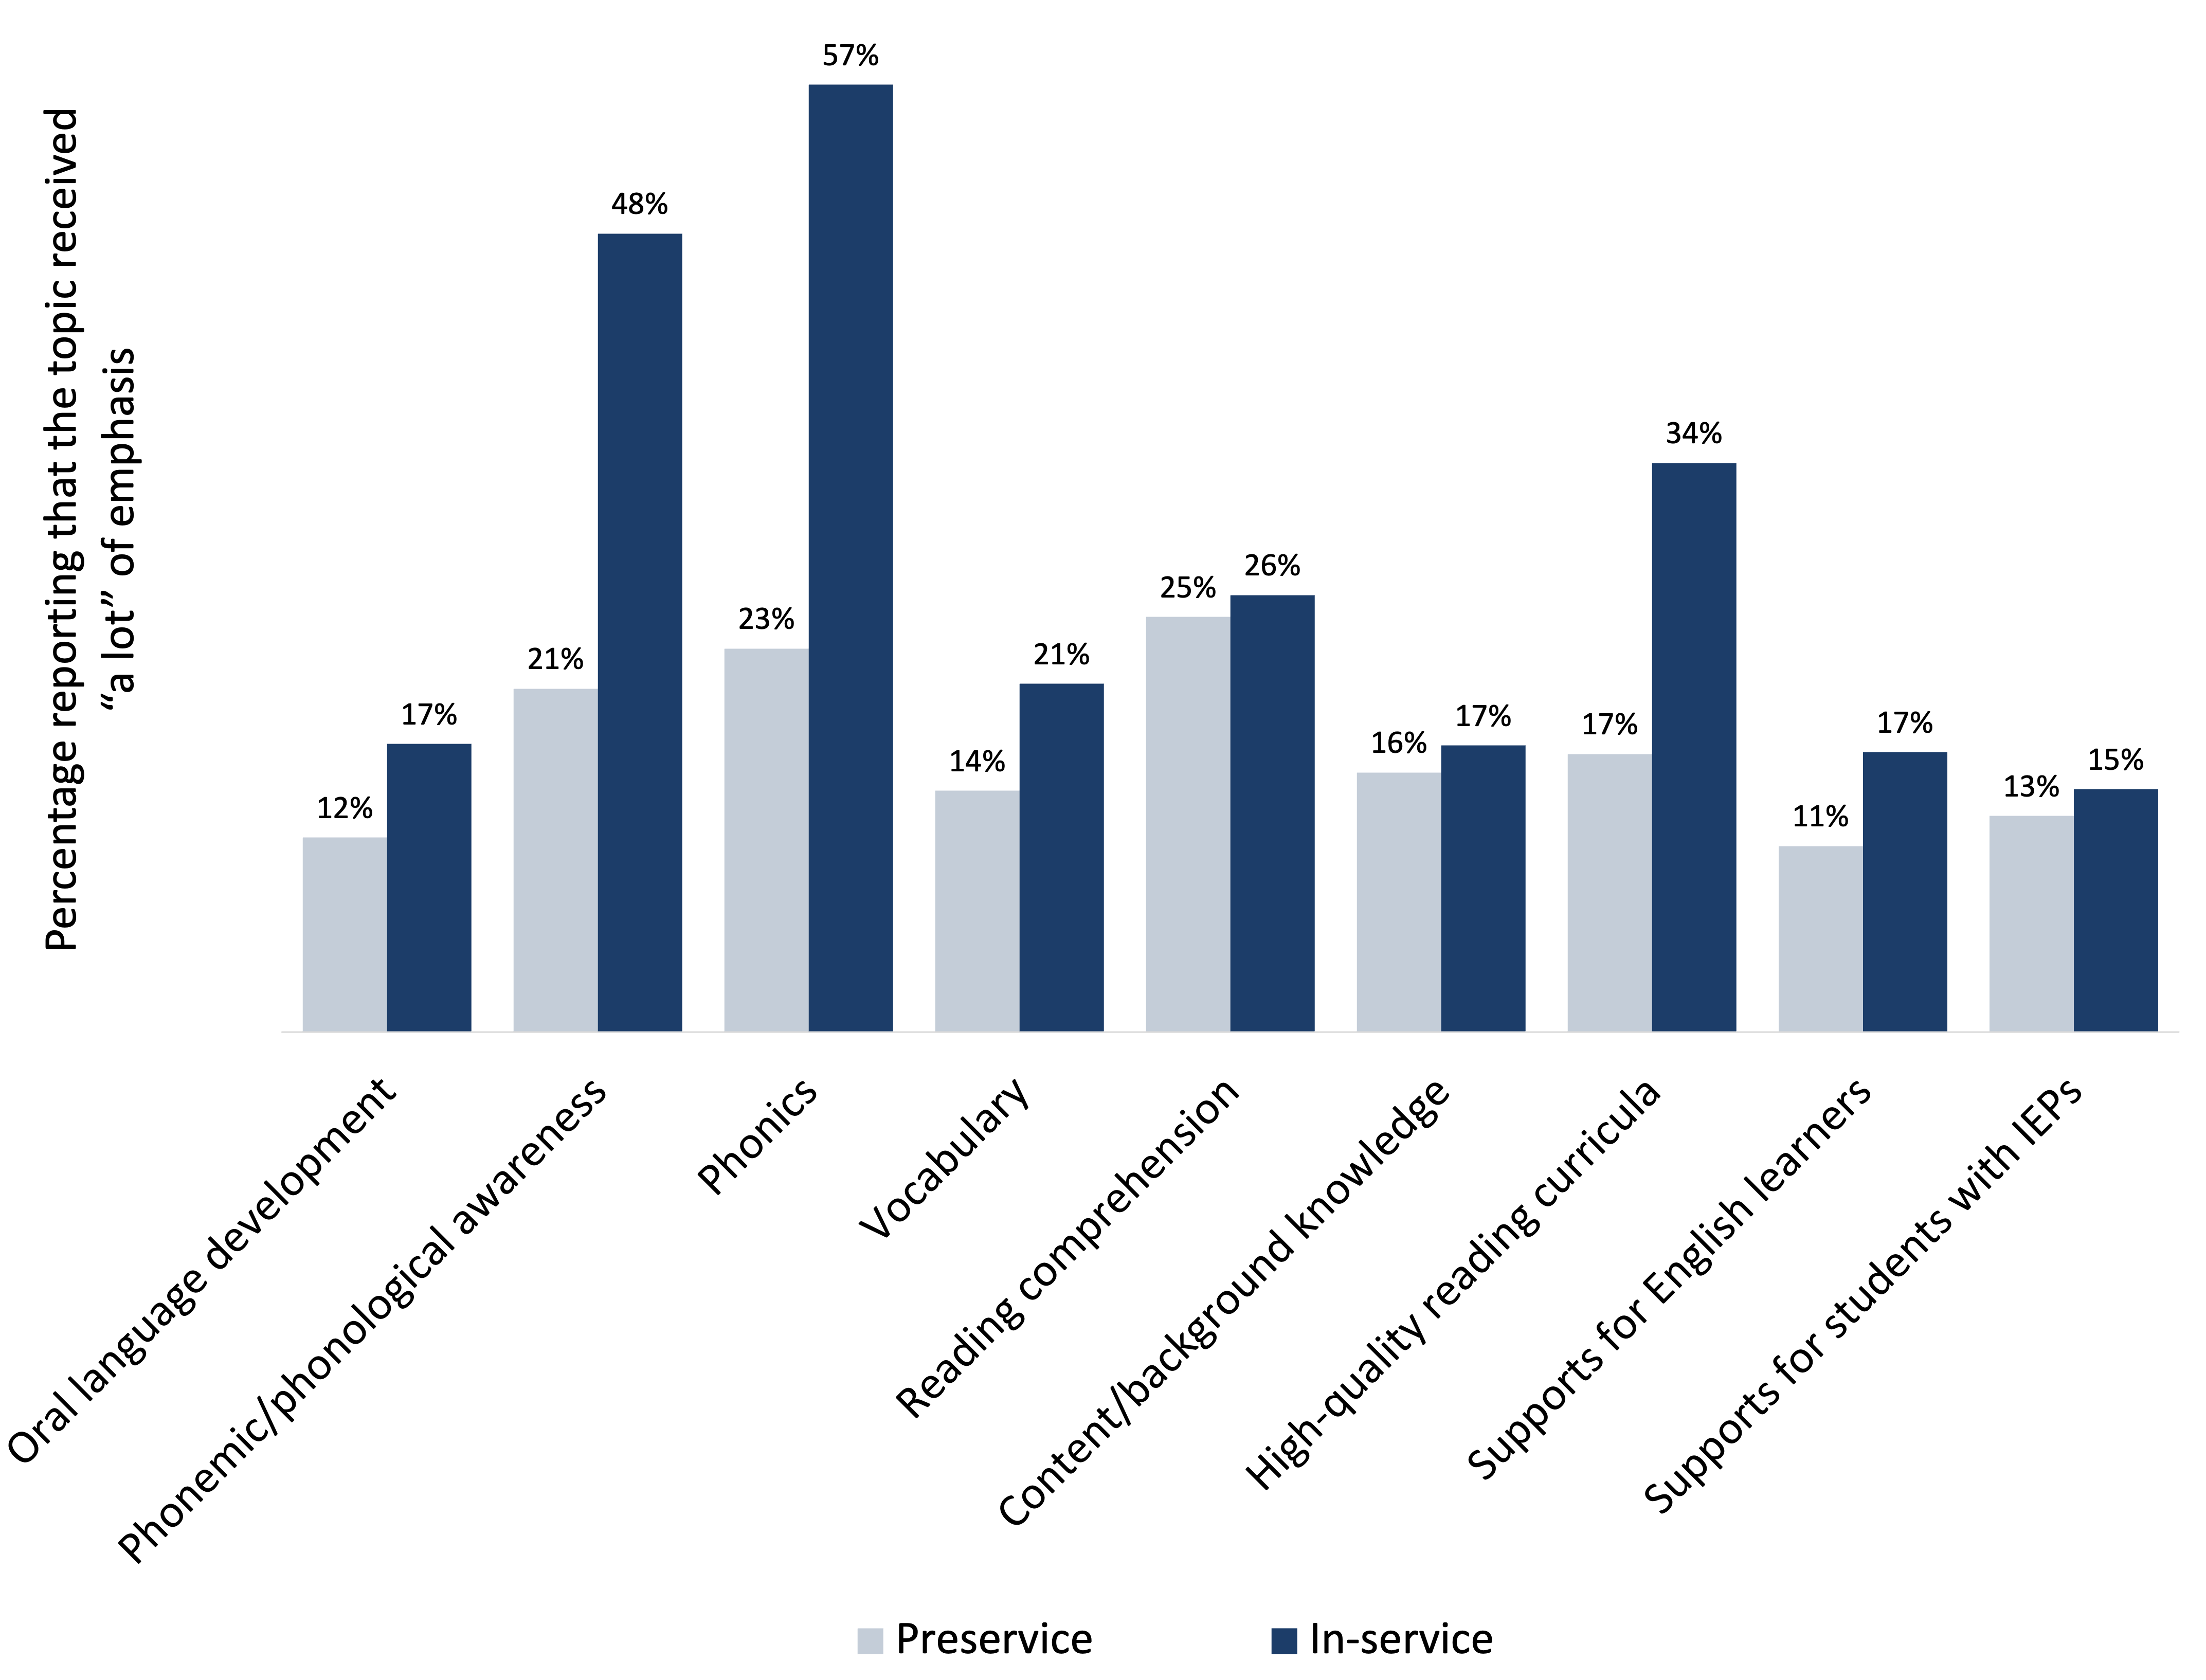
Note: Survey question: “Overall, how much emphasis has your professional development put on each of the following reading-related topics in the past 2–3 years?”
Although these results aren’t necessarily indicative of weak preservice preparation, teachers’ responses to other survey questions are consistent with that interpretation. For example, just 2 percent of teachers said their preservice preparation program had taught them “the most about effective practices for teaching children to read.” In contrast, 21 percent of teachers cited their in-service professional development (Figure 15).
Figure 15. Only 2 percent of teachers say they learned about effective practices for teaching children to read from their preservice preparation programs.
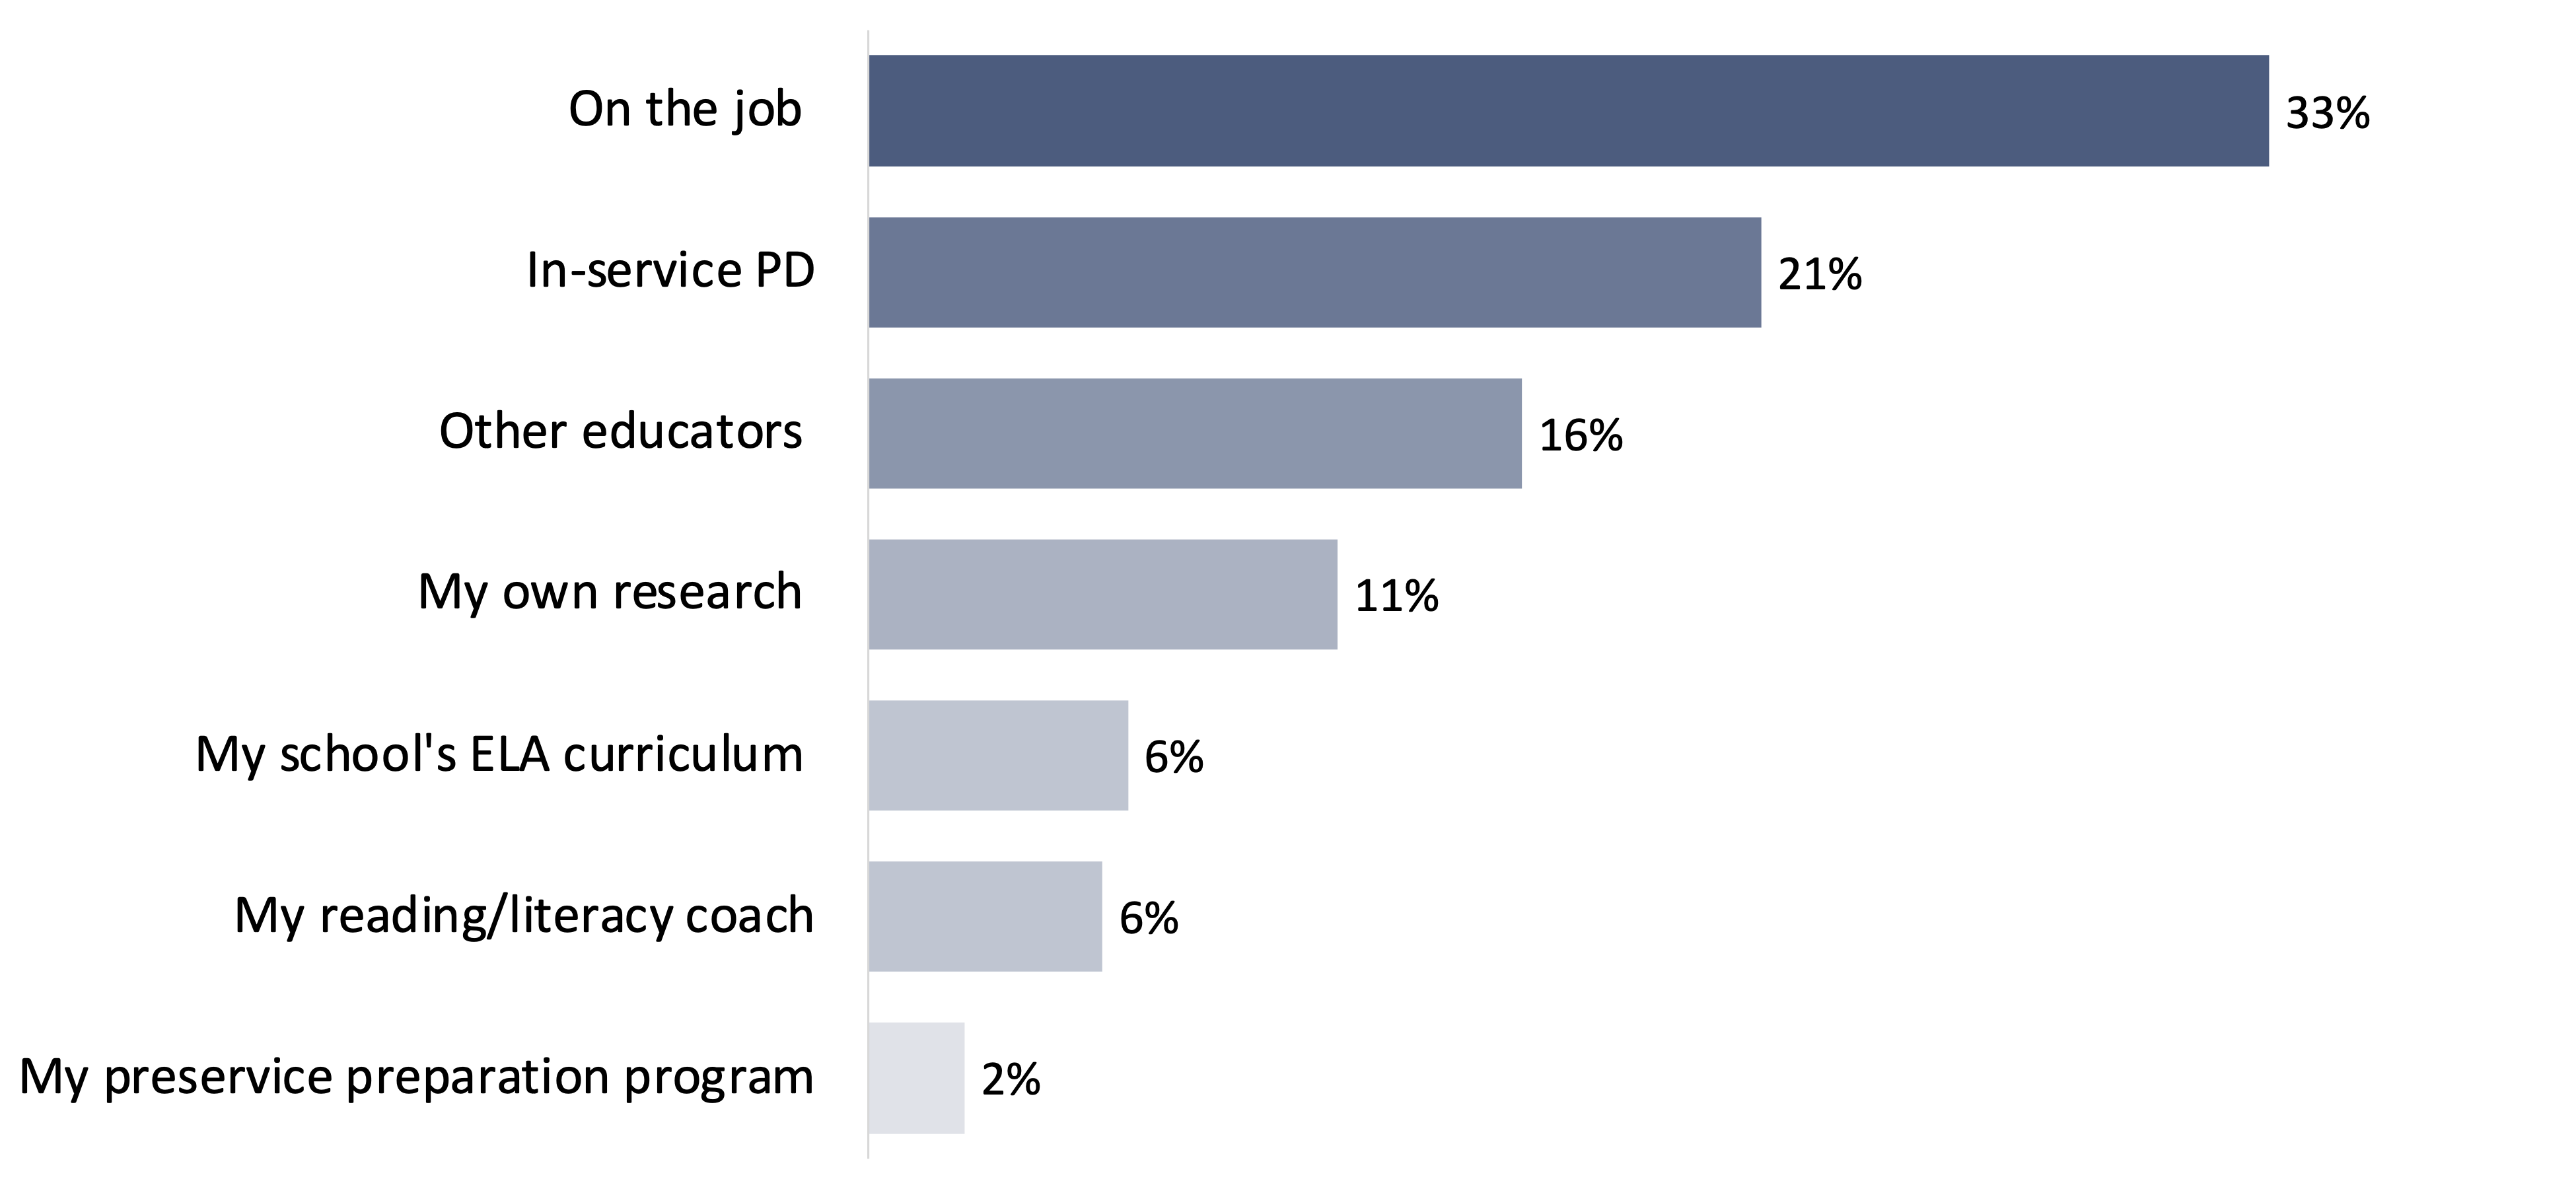
Note: Survey question: “Where have you learned the most about effective practices for teaching children?” Question is based on a similar question from a 2019 survey by Education Week.
“College never taught me how to teach kids how to read. Every year, I continued to see the same results, and they were not the results I wanted for my kiddos. ... Through the LETRS training … I am seeing great results already this year with the modifications I have implemented.”
“LETRS training was amazing!!! Wish I would have learned that in college.”
Finding 2c. Teachers who have completed popular professional development courses know more about the science of reading.
In general, the more emphasis a teacher’s recent professional development placed on the science of reading, the better that teacher scored on our science of reading quiz (Figure 16). Although it’s possible that teachers with higher preexisting knowledge of the science of reading are selecting into science of reading trainings, the most straightforward interpretation of this result is that science of reading–focused professional development tends to boost teachers’ knowledge of the science of reading.
Figure 16. Teachers who have received more science of reading–aligned professional development know more about the science of reading.
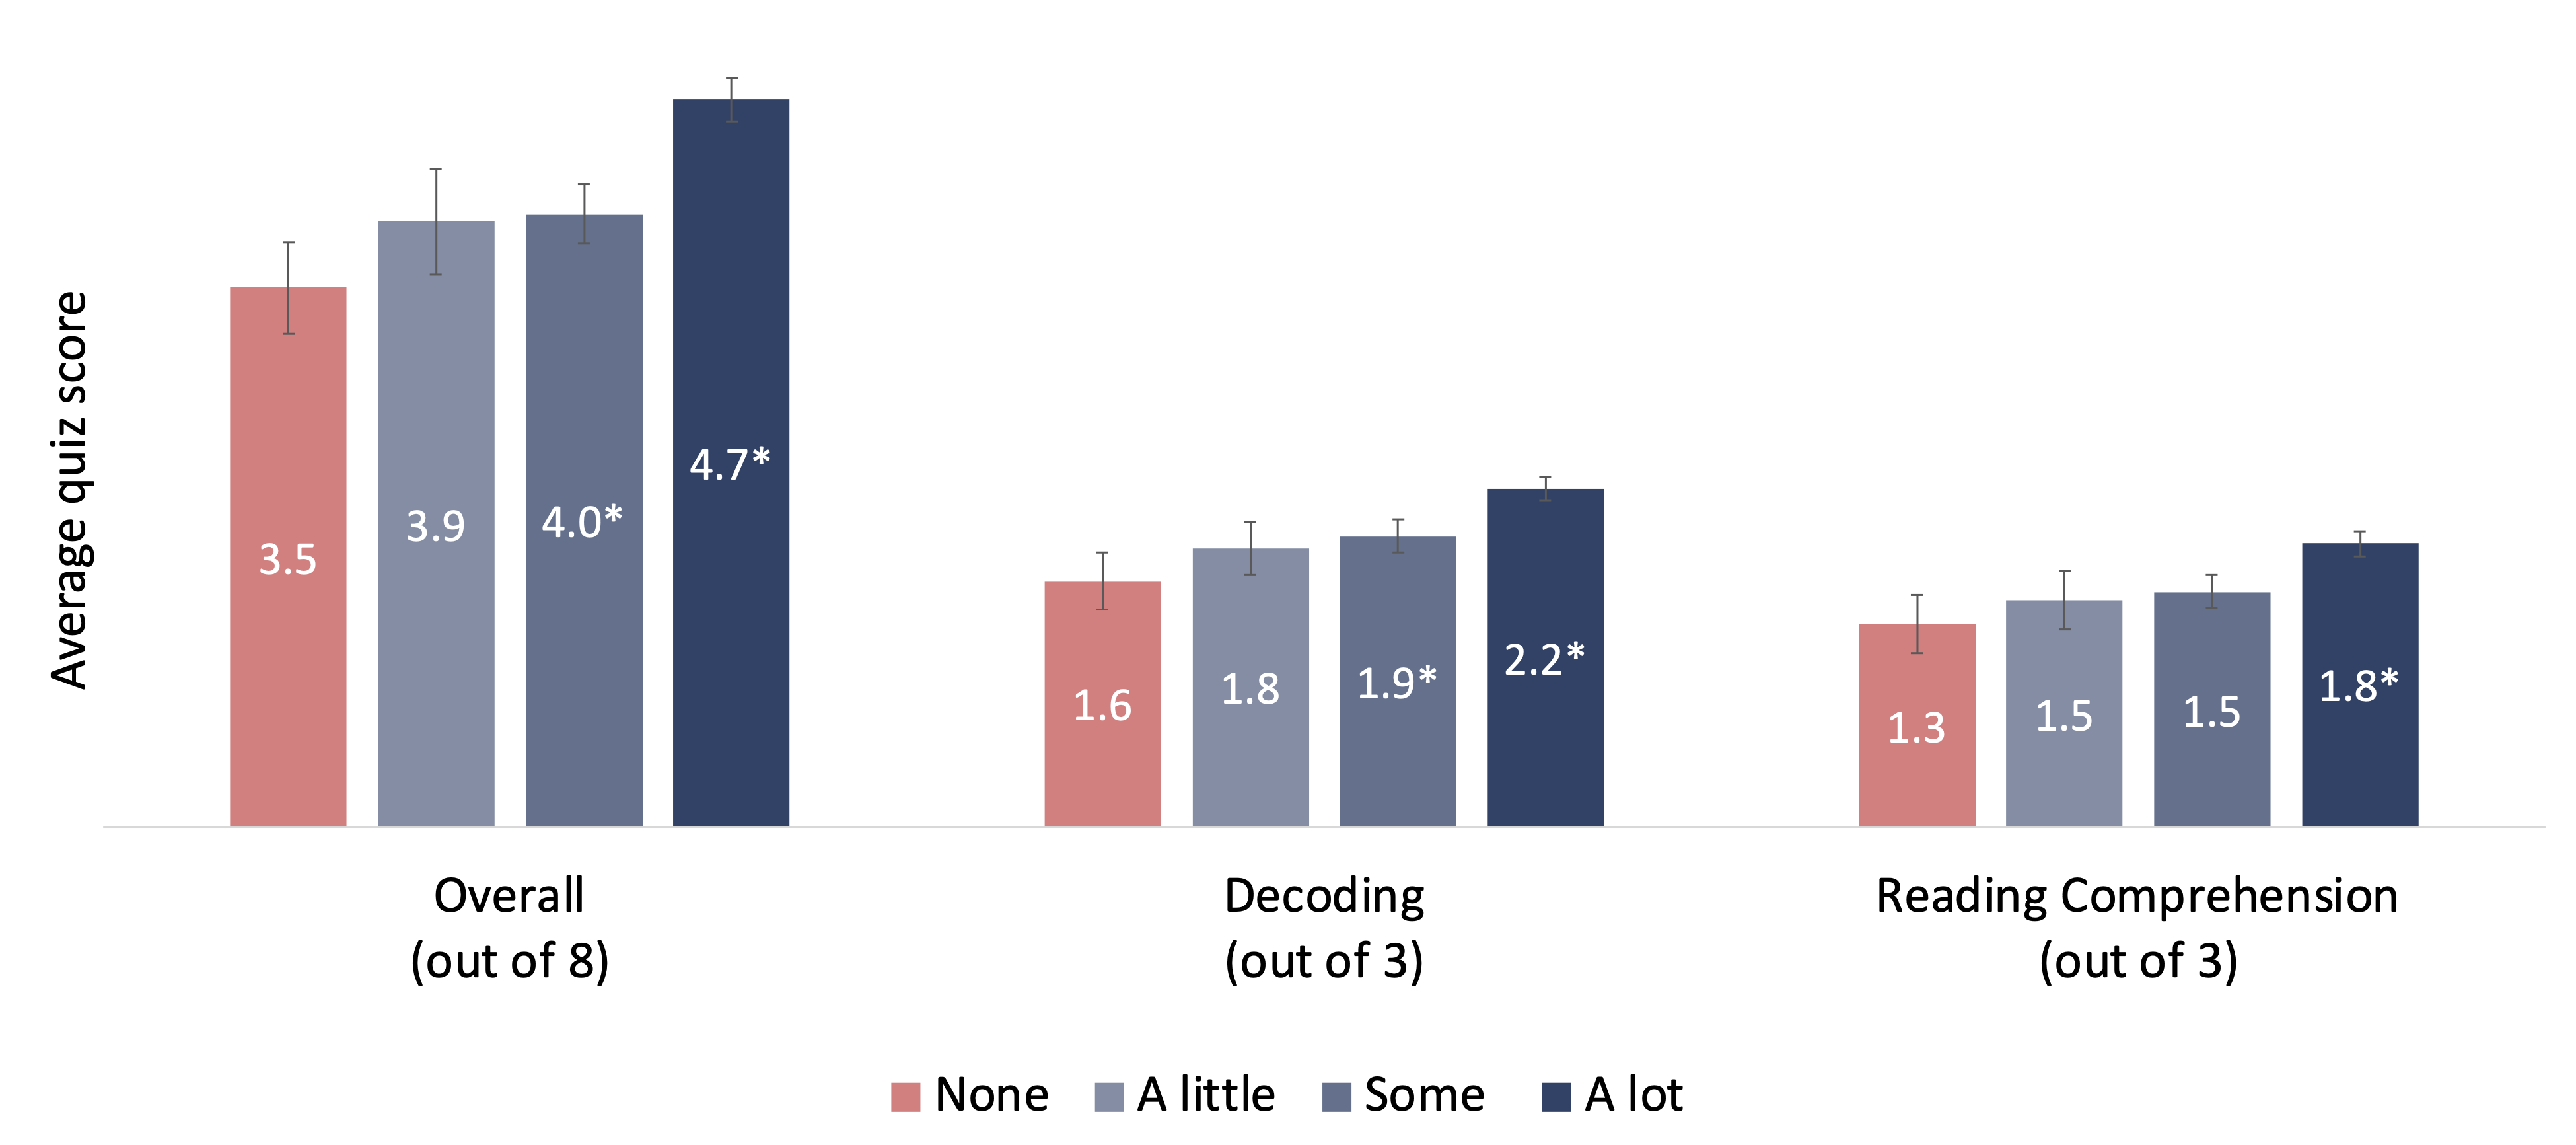
Note: Survey question: “How much emphasis has your professional development put on the science of reading?” An asterisk indicates a difference that is statistically significant at the 95 percent confidence level. Peach-colored bars (“None”) indicate the reference categories.
Notably, respondents who had completed the LETRS, UFLI Foundations, and/or Amplify CKLA (Core Knowledge Language Arts) trainings exhibited deeper knowledge of reading science than those who had had no professional development (“no PD”) related to the science of reading (Figure 17), as did those who had participated in any “state sponsored, SoR-aligned training.” As discussed below, it seems likely that the UFLI Foundations and Amplify CKLA results are at least partly attributable to the adoption of these curricula rather than the trainings that accompany them. However, this caveat does not apply to LETRS, which is not associated with any specific curriculum.
Figure 17. Teachers who have completed science of reading–aligned trainings know more about the topic.
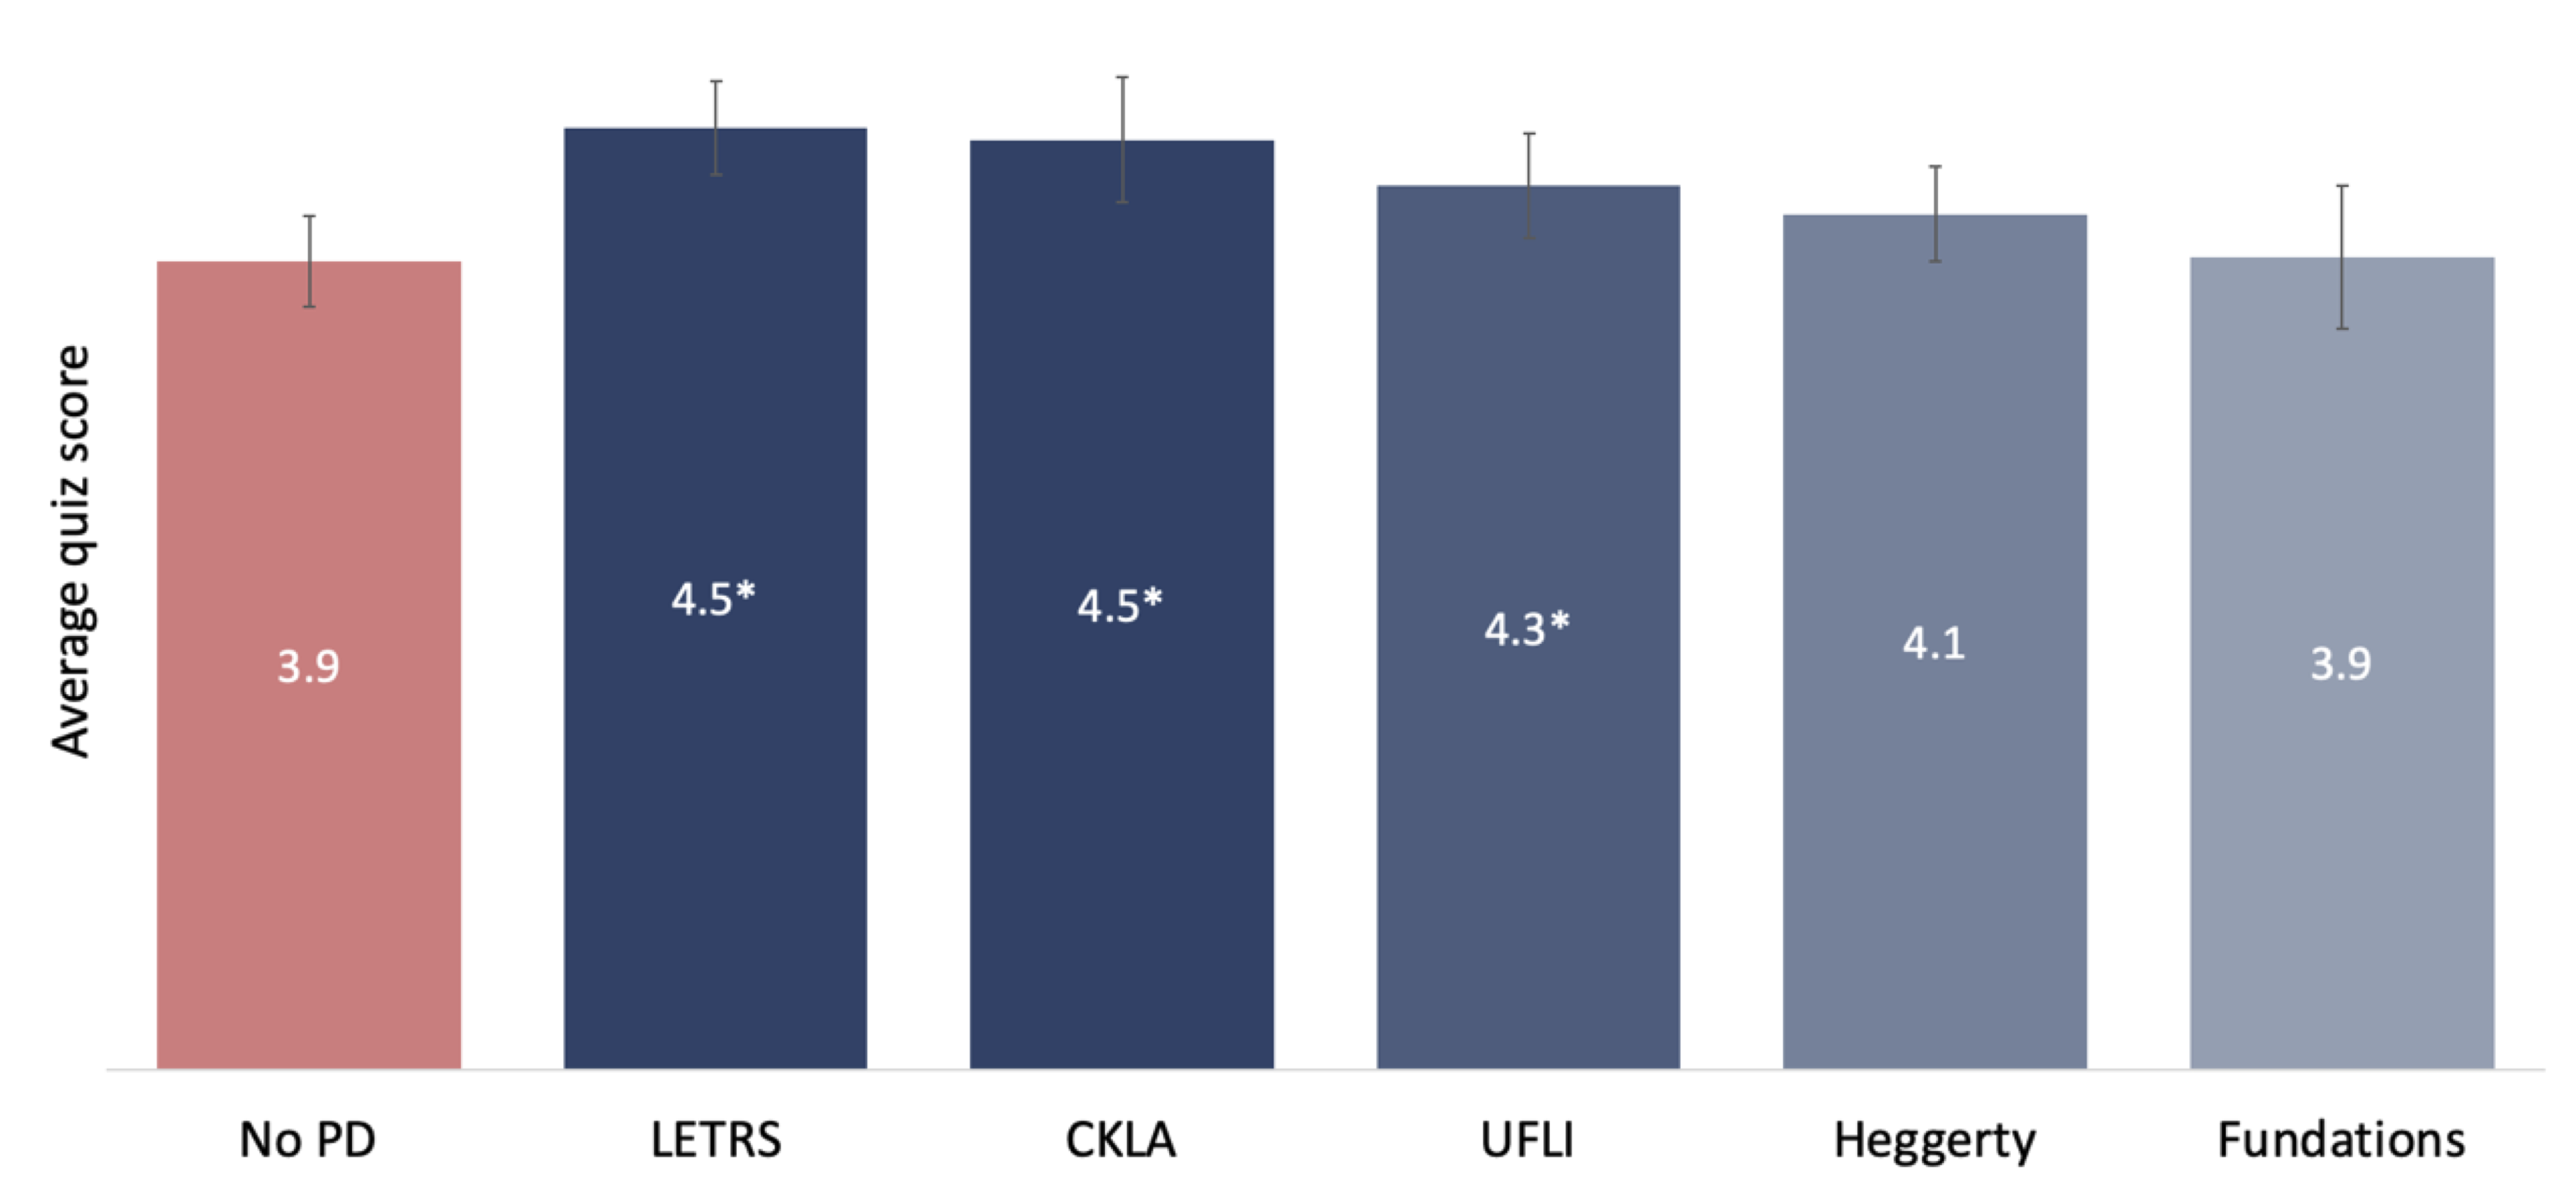
Note: An asterisk indicates a difference that is statistically significant at the 95 percent confidence level. The peach-colored bar (“No PD”) indicates the reference category. Total points are out of 8.
Finding 2d. Teachers who rely on their preservice preparation know less about the science of reading.
Overall, the results suggest that teachers who rely most heavily on the science of reading instruction provided by their preservice programs tend to have substandard knowledge of the science of reading. For example, teachers who cited their preservice teacher preparation program as the place where they learned the most about effective reading practices exhibited less knowledge of the science of reading than any other group (Figure 18).
Figure 18. Teachers who cite their preservice preparation program as their primary influence know less about the science of reading than those who cite other influences.
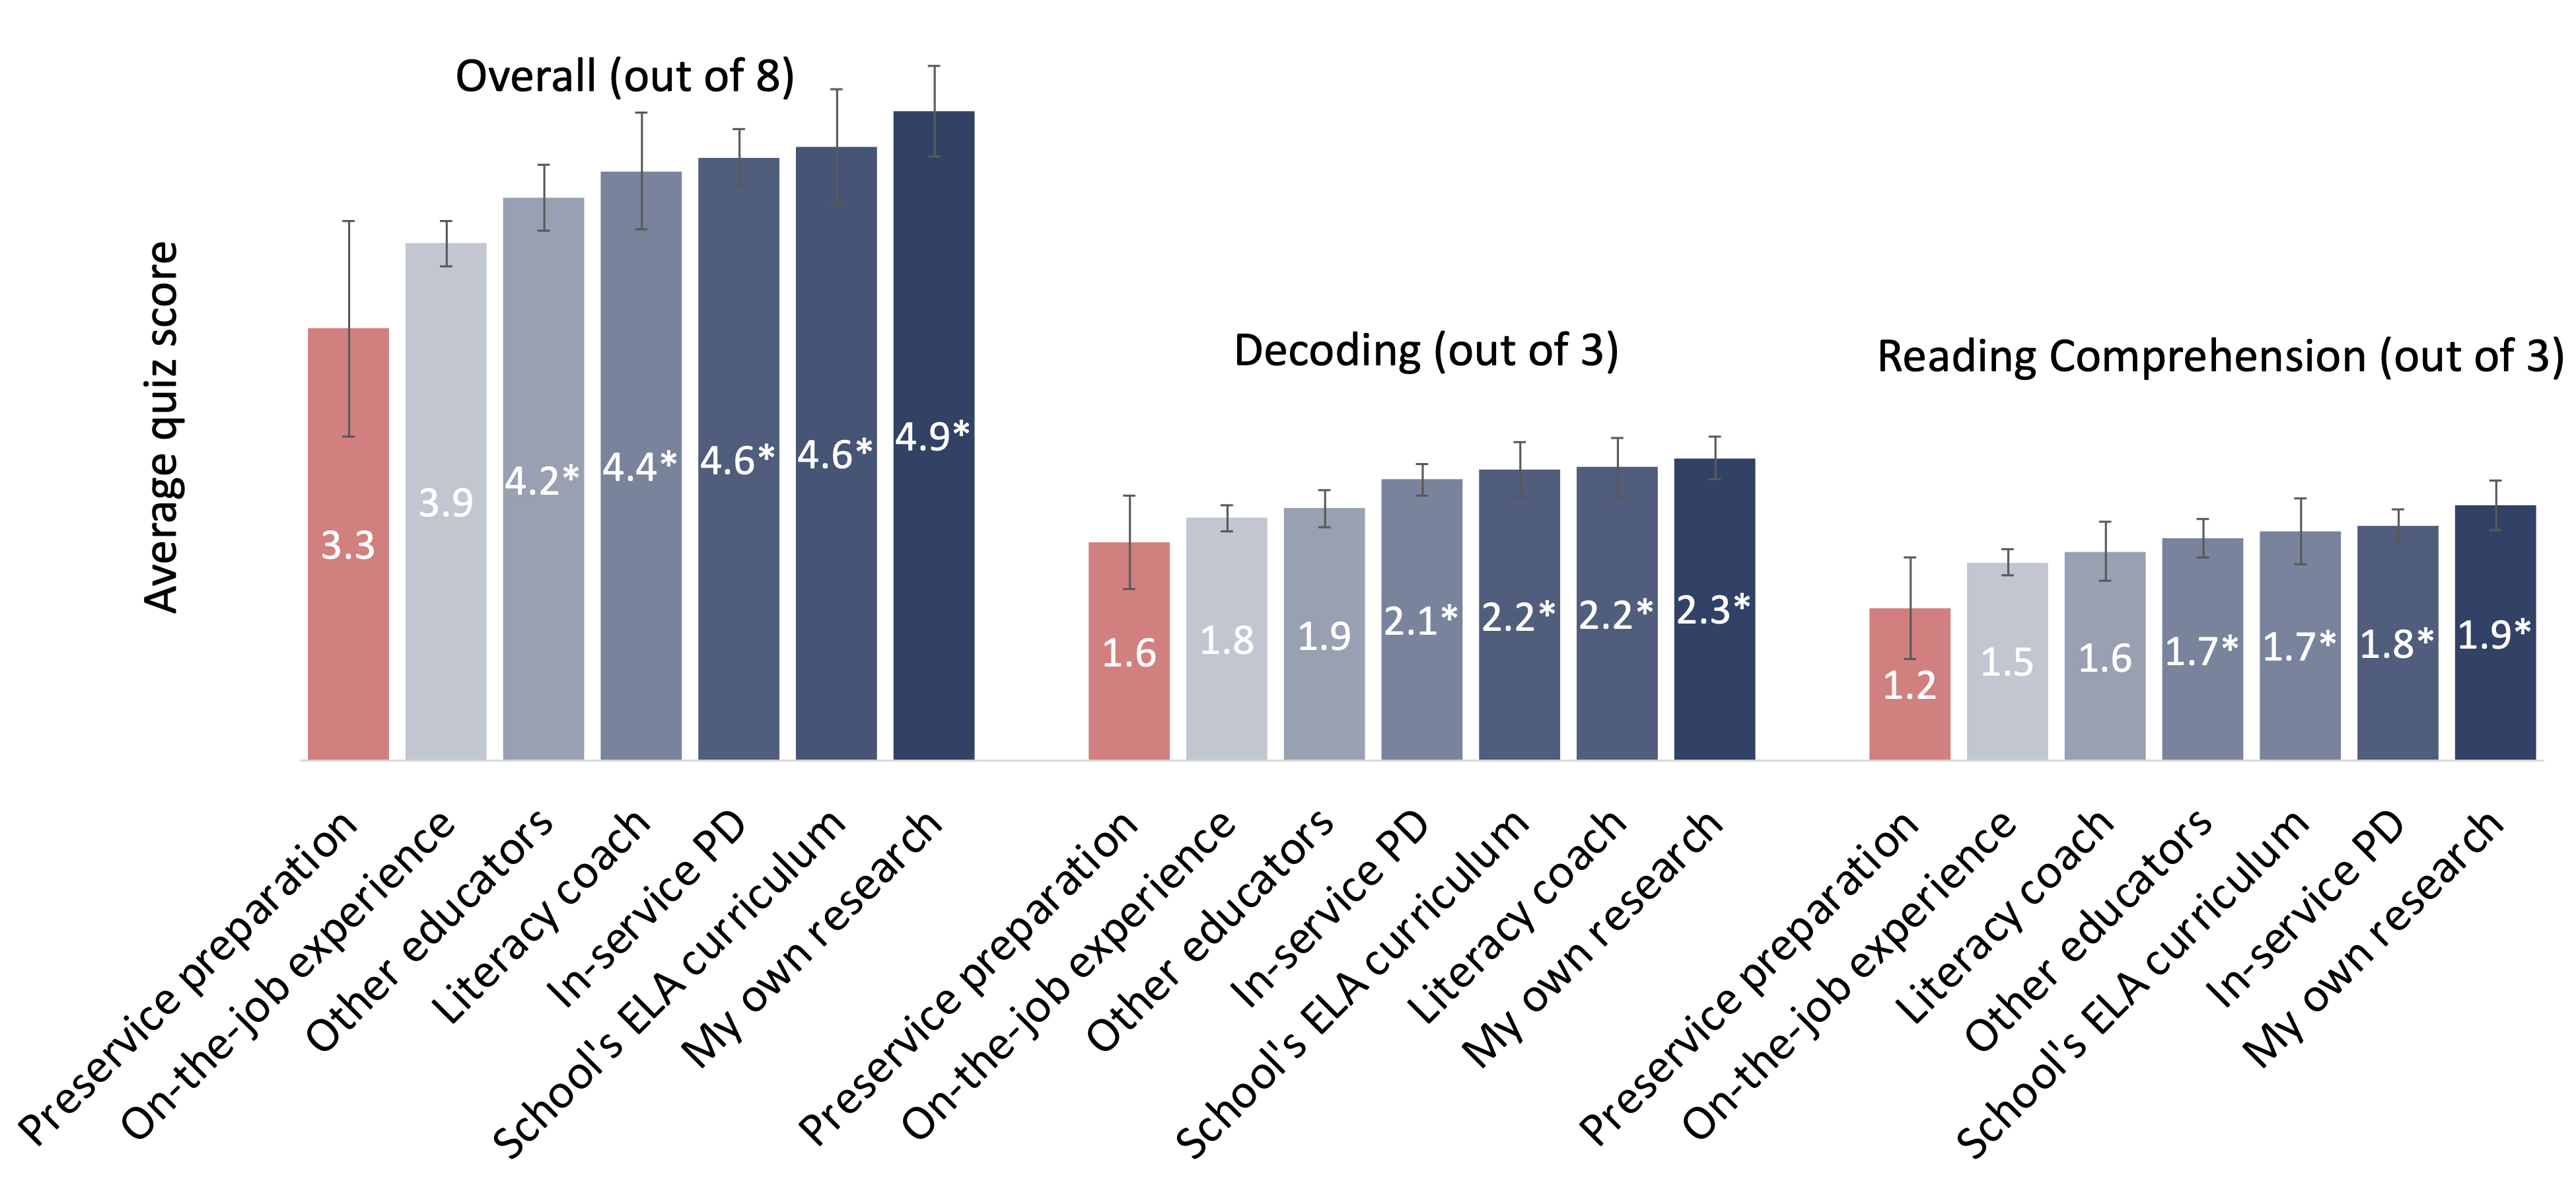
Note: Survey question: “Where have you learned the most about effective practices for teaching children to read?” An asterisk indicates a difference that is statistically significant at the 95 percent confidence level. The peach-colored bars (“Preservice preparation”) indicate the reference categories.
Moreover, teachers who reported that their preservice preparation programs had emphasized the science of reading exhibited less knowledge of reading science (Figure 19). In other words, there is some evidence that preservice preparation programs are detrimental to teachers’ understanding—or at least that teachers who think these programs taught them about the “science of reading” don’t really understand what that science says.[11]
Figure 19. Teachers who say their preservice preparation program emphasized the science of reading know less about it.
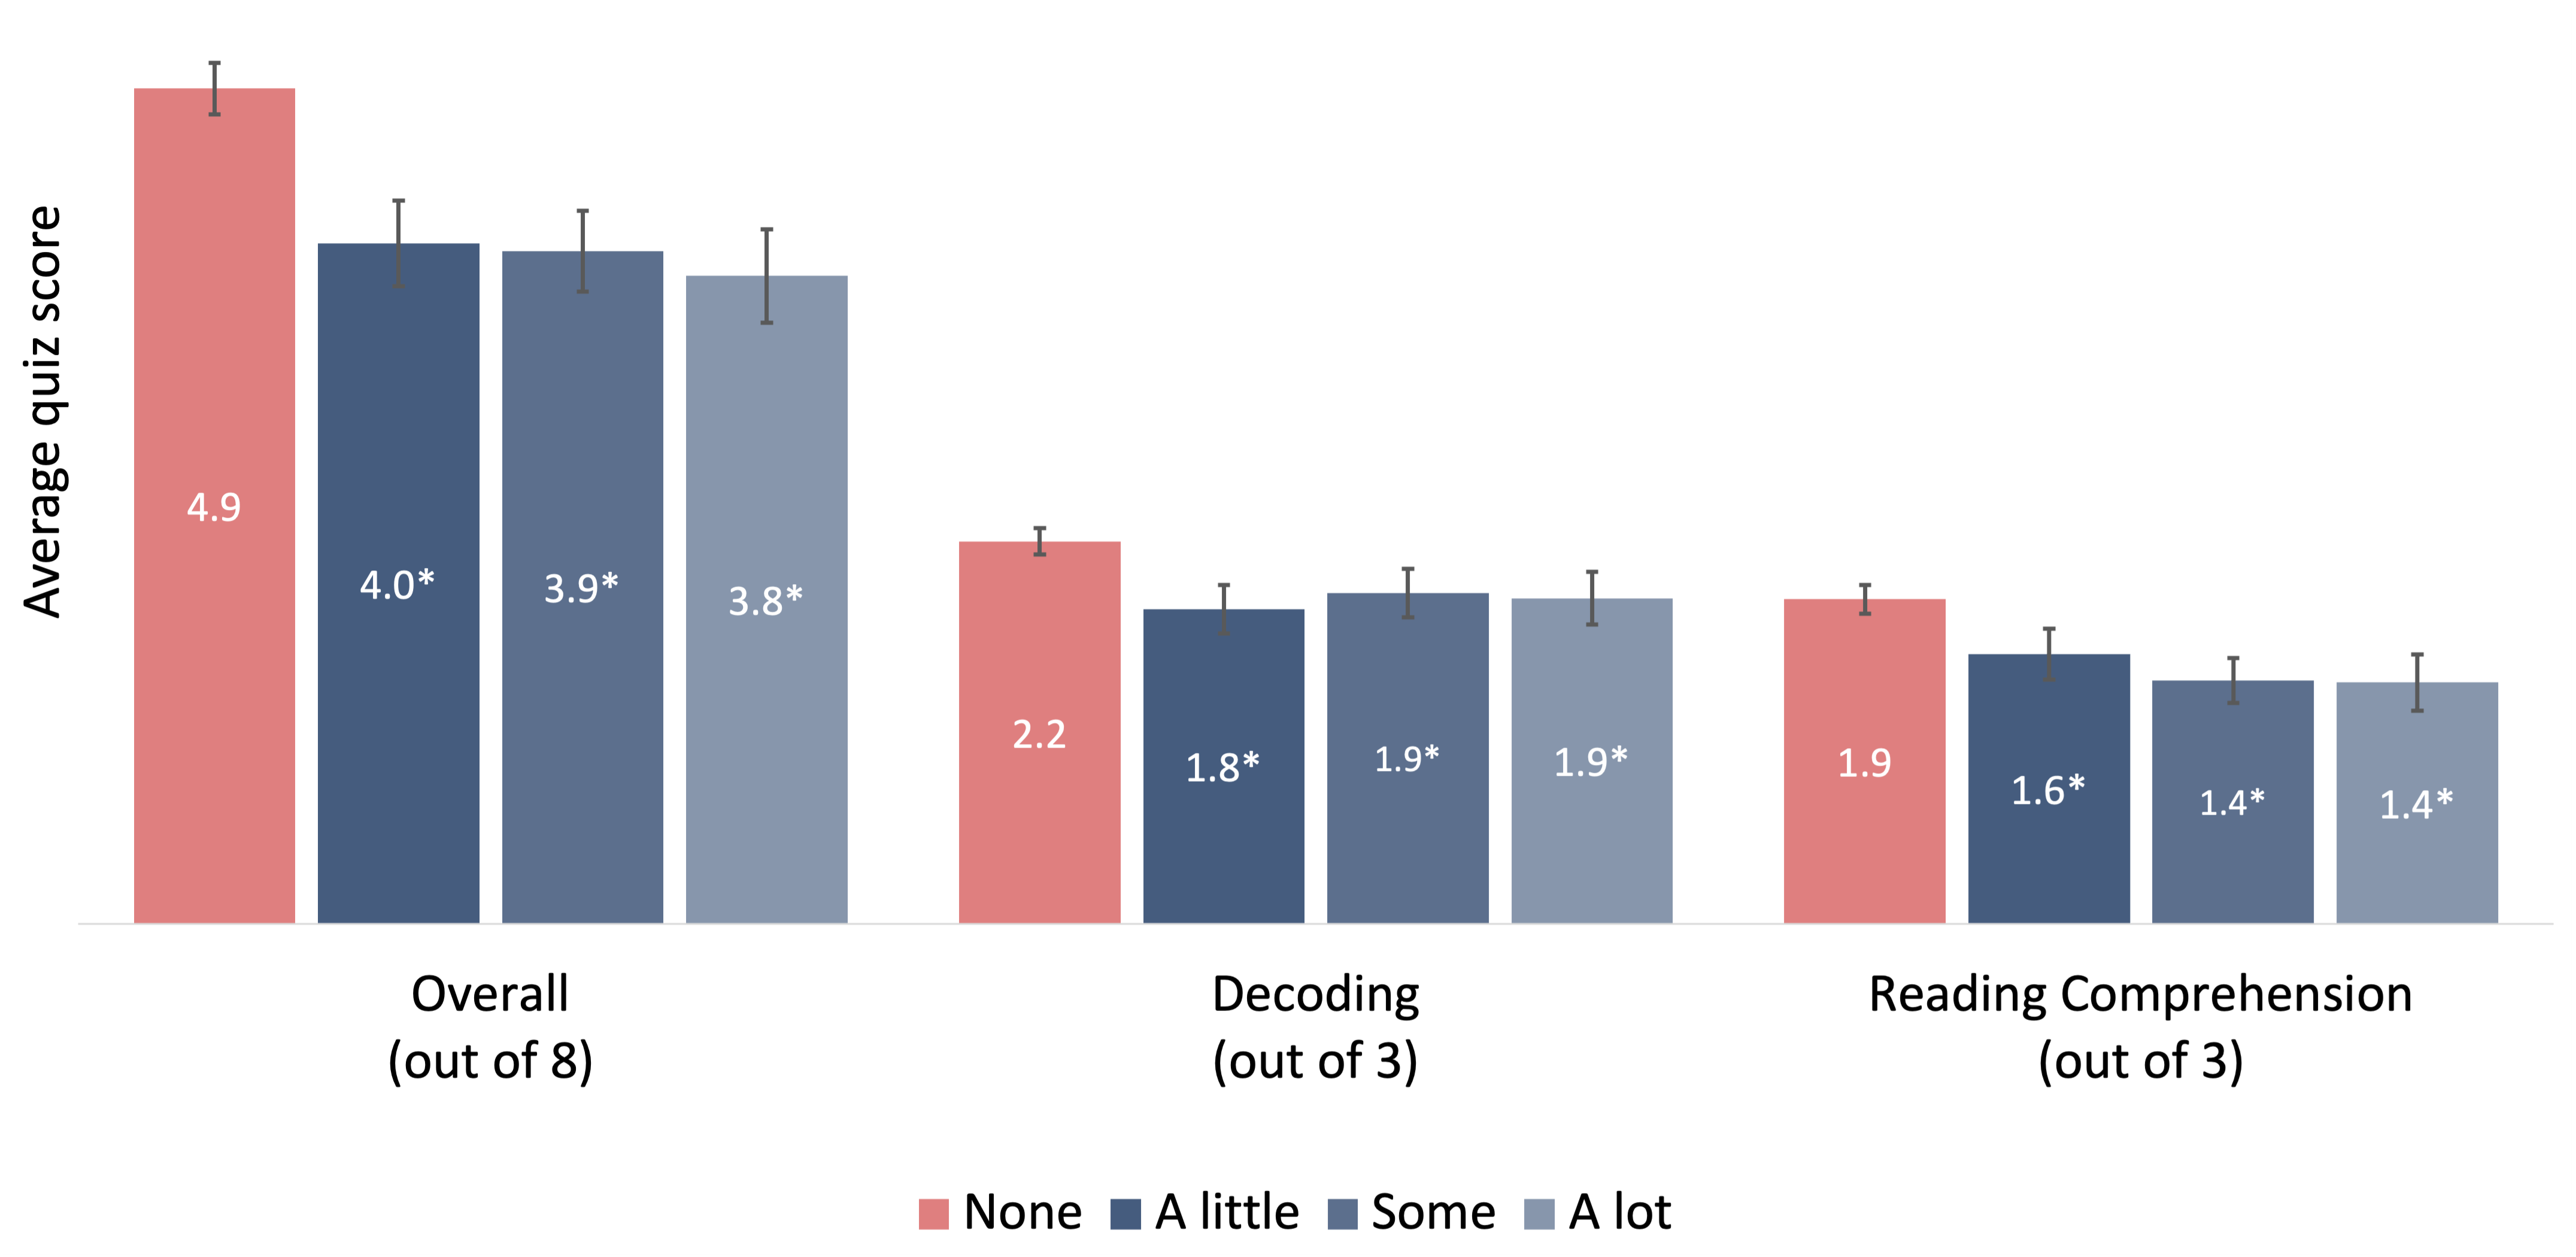
Note: Survey question: “How much emphasis did your preservice program put on the science of reading?” An asterisk indicates a difference that is statistically significant at the 95 percent confidence level. The peach-colored bars (“None”) indicate the reference categories.
Finding 3 Teachers in states with science of reading–aligned licensure tests know more about the science of reading.
Of the 18 state policies that ExcelinEd tracks, only one—“Educator Preparation Program (EPP) Assessment”—is associated with a significantly deeper understanding of the science of reading as measured by our survey. Other policies, such as three-cueing bans and third-grade retention, are not significantly related to teachers’ knowledge—though because of the correlational nature of the results, that does not mean that they are ineffective (see Do third grade reading guarantees work?).
According to ExcelinEd, a strong EPP policy is one that “align[s] initial candidate licensure tests to the science of reading and evidence-based instructional practices,” thus providing “an efficient and comprehensive way for teachers to demonstrate they possess the knowledge and skills needed to teach students to read.” Teachers in states that have strong EPP policy scored a half-point higher overall on our science of reading “quiz” (Figure 20).
Figure 20. Teachers in states with science of reading–aligned licensure tests know more about the science of reading.
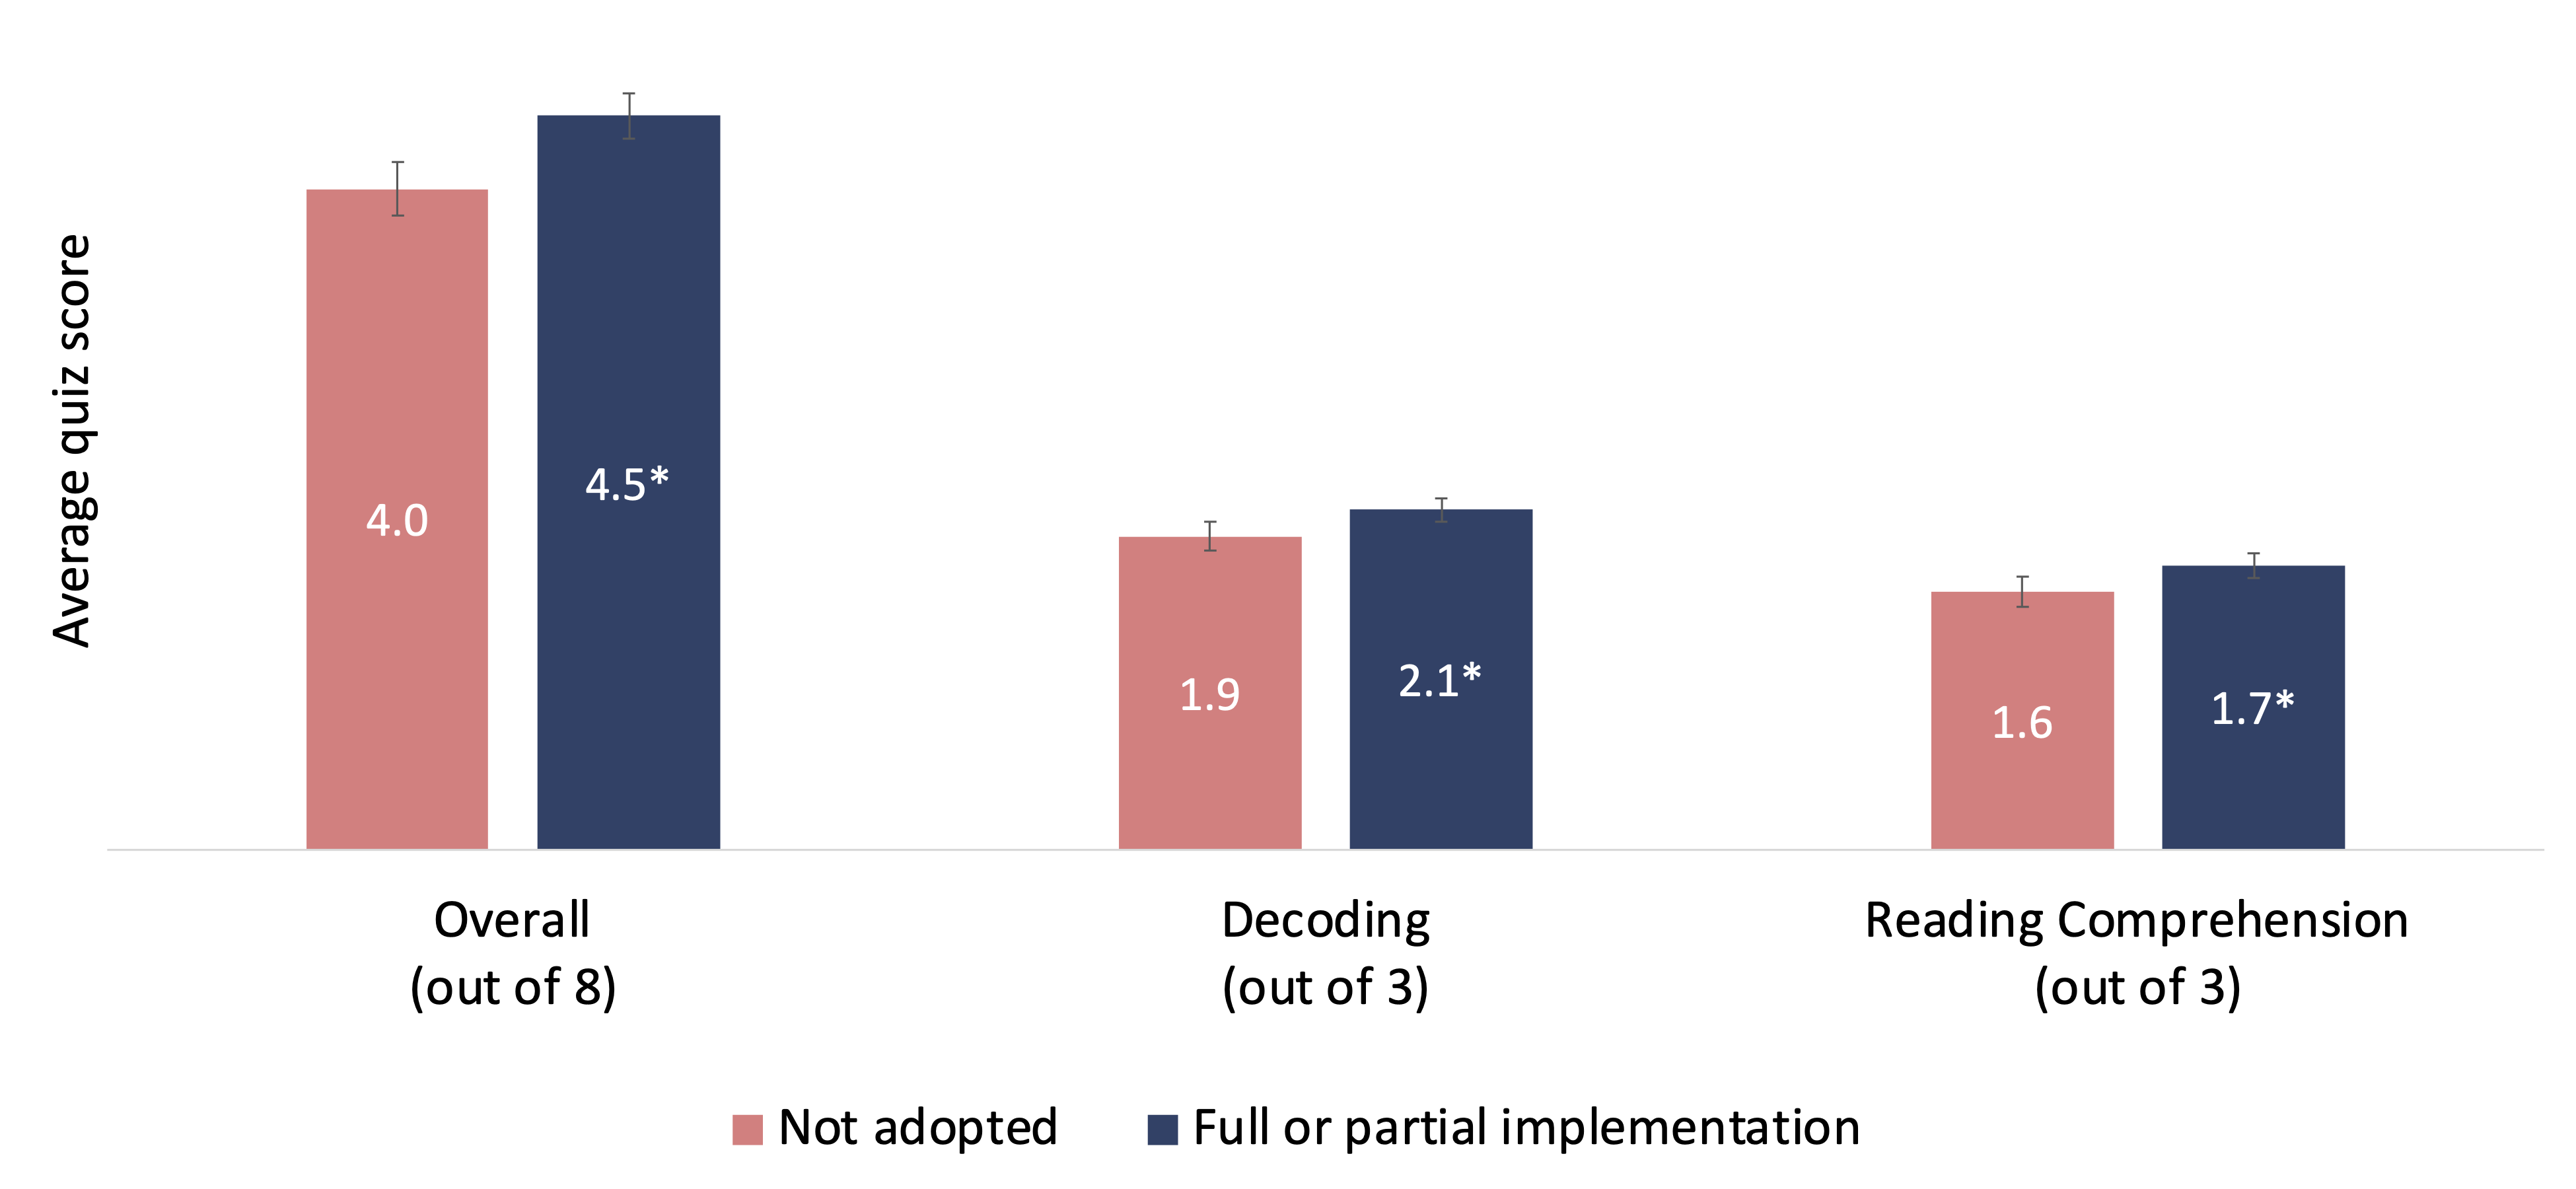
Note: An asterisk indicates a difference that is statistically significant at the 95 percent confidence level. The peach-colored bars (“Not adopted”) indicate the reference categories.
Do third grade reading guarantees work?
A growing body of research suggests that literacy-based retention policies, such as “third-grade reading guarantees,” can have a positive effect on student achievement, at least when they serve as a catalyst for focused interventions such as additional instructional time, tutoring, and other academic supports.[12] Still, even the most aggressive retention policies include numerous exceptions, which may provide parents and practitioners who oppose retention with the requisite cover.
Of the 54 percent in our survey who said they were familiar with their state’s grade retention policies, roughly a quarter said the policies had had a positive impact on students, about the same proportion who said they had had a negative impact, and the rest said these policies had had little impact “because everyone knows most students won’t really be retained” (Figure 21). In other words, about three-quarters of teachers either indicated that they were unfamiliar with their state’s retention policies or said that they had had little practical effect.
Figure 21. Many teachers say there is less to their state’s grade retention policies than meets the eye.
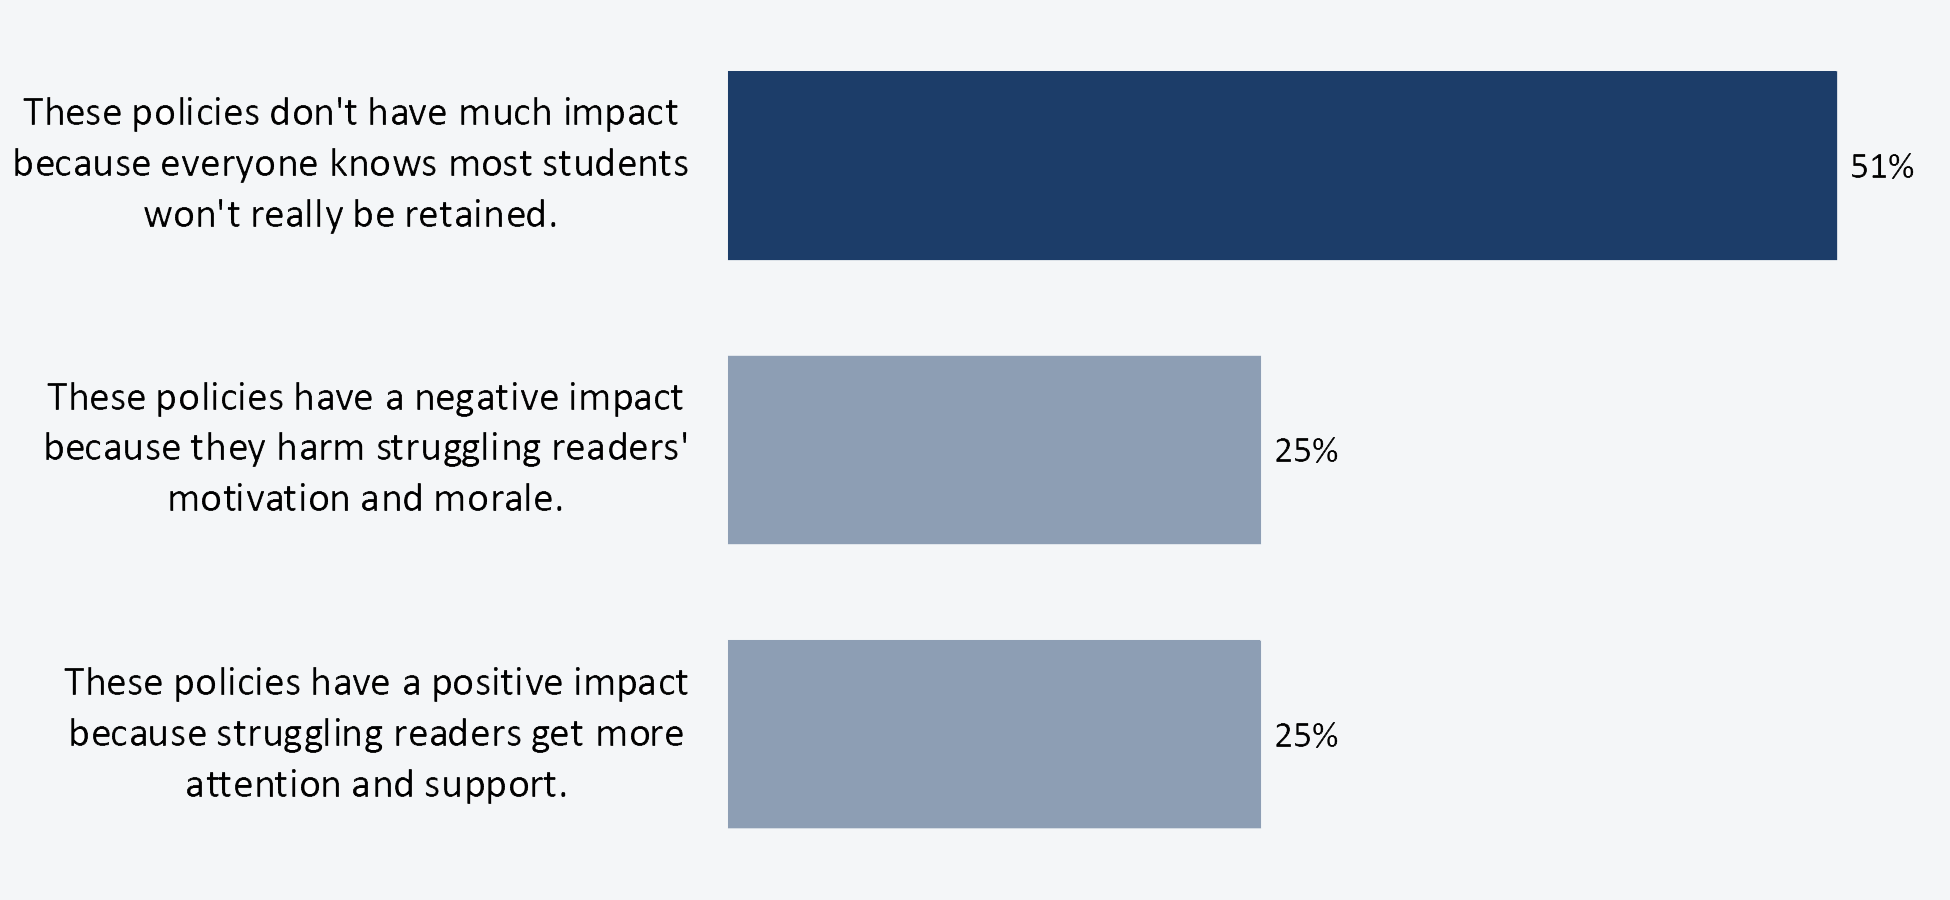
Note: Survey question: “Which statement best reflects your view of your state’s grade retention policies?”
Finding 4 Some reading/literacy curricula that science of reading advocates have criticized remain popular with teachers.
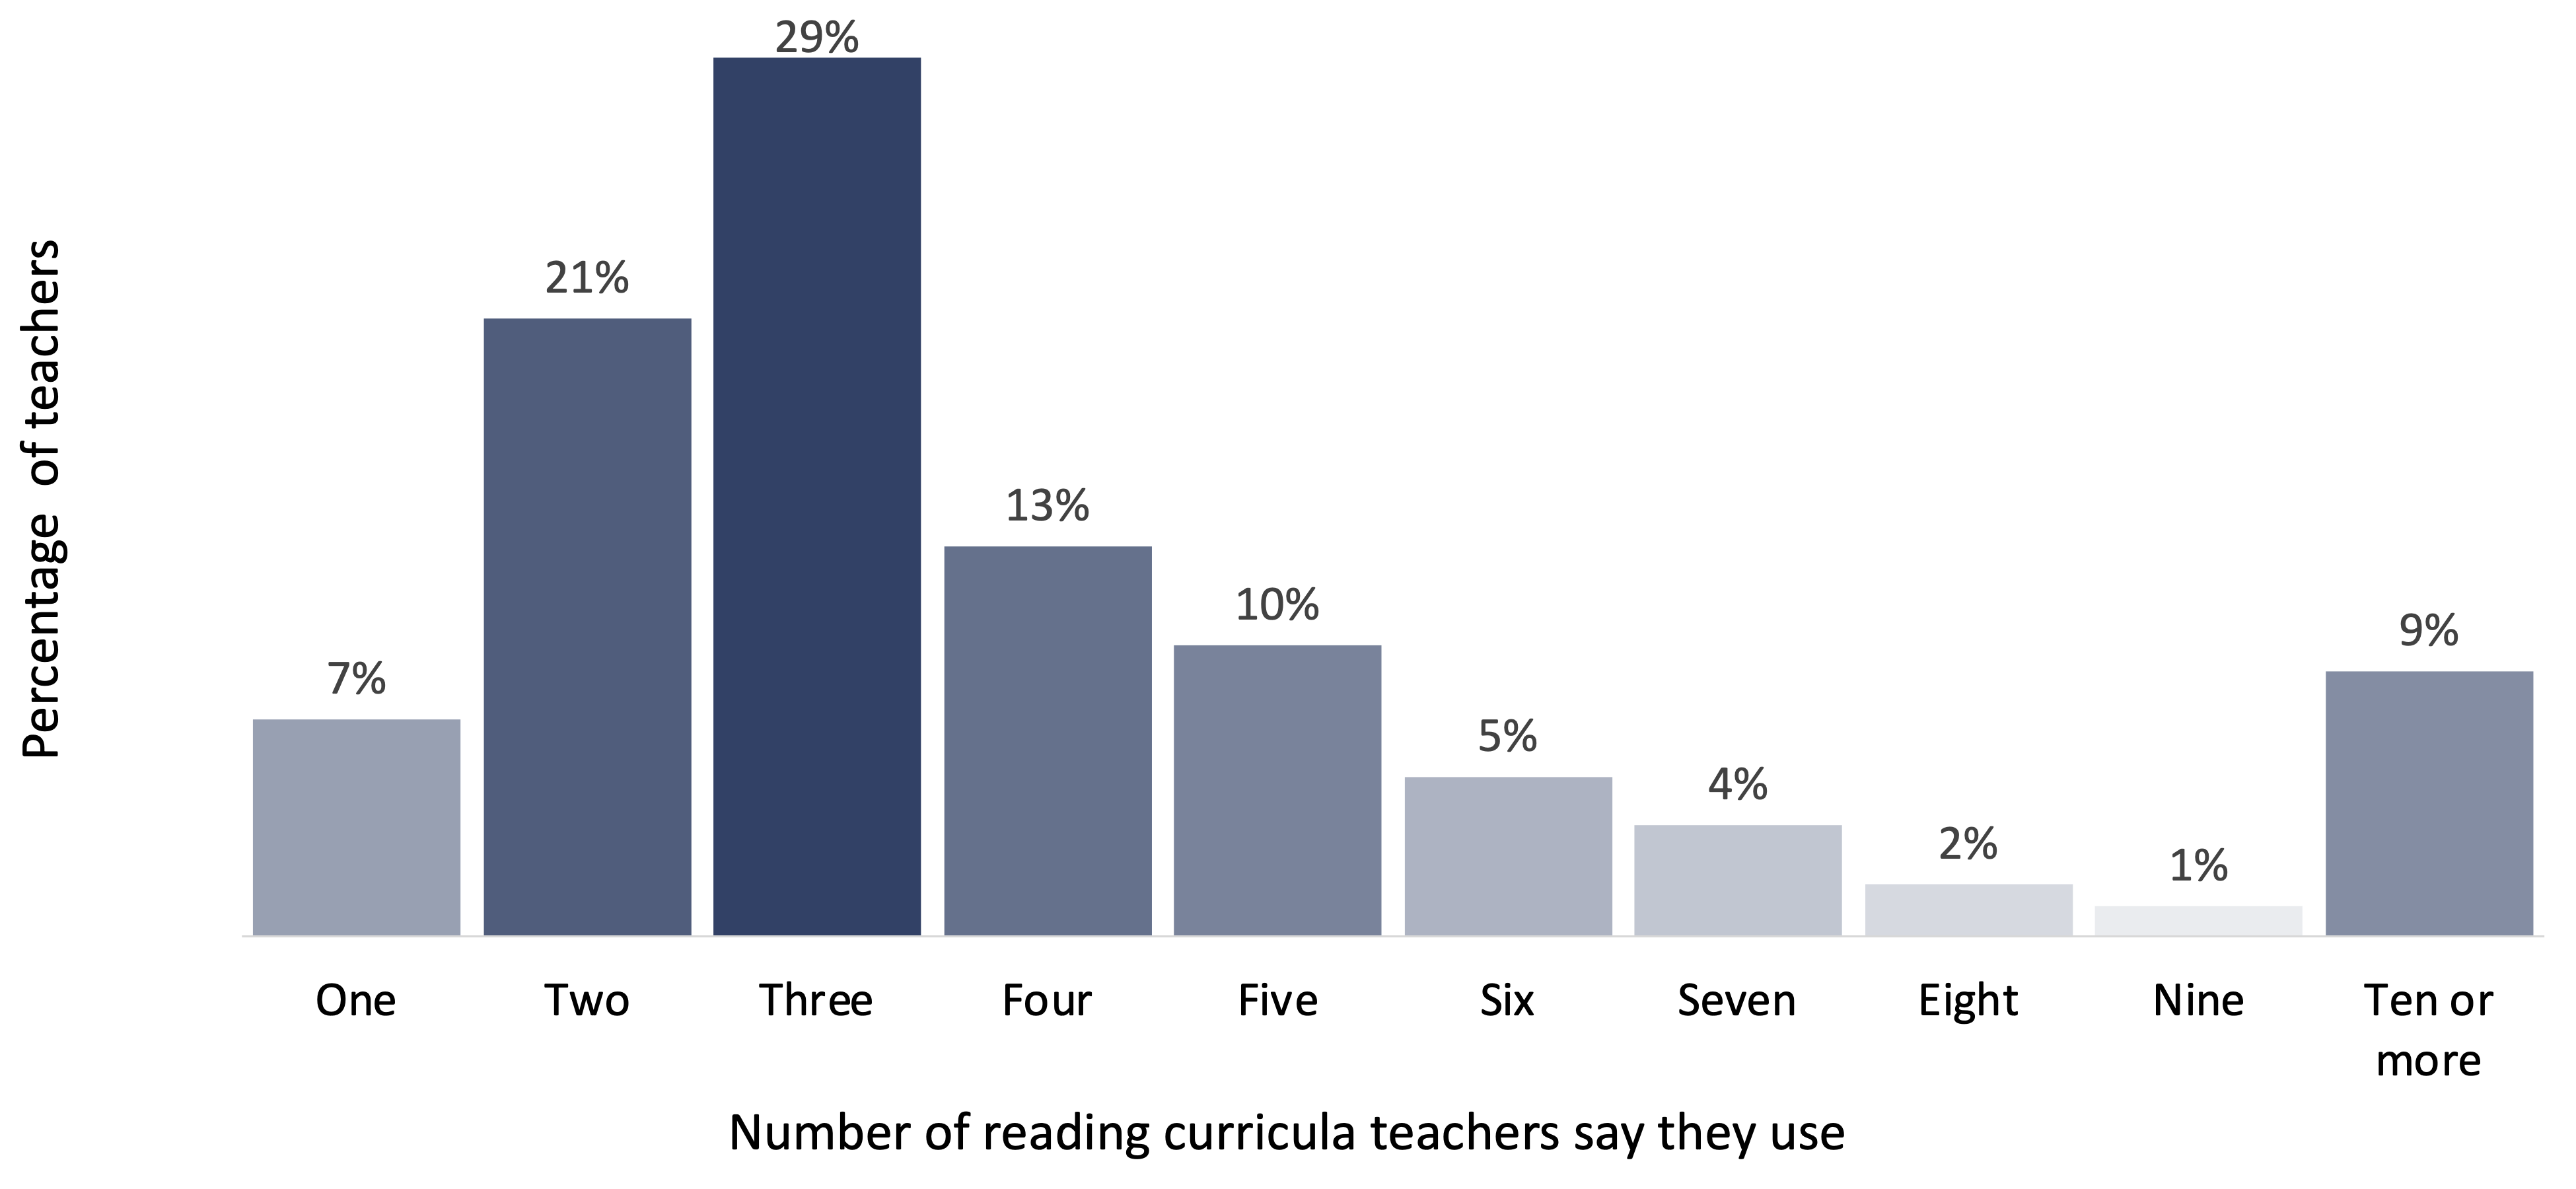
Our survey presented teachers with a list of 57 commonly used reading/literacy curricula and asked them to identify whether they used each as a primary, supplementary, or intervention curriculum. Teachers were instructed to select all that apply. And consistent with prior research, 93 percent chose multiple curricula, with 8 percent saying they used ten or more curricula (Figure 22).
Figure 22. More than 90 percent of K–3 teachers say they use multiple reading curricula.
Per Figure 23, the single most popular curriculum is UFLI Foundations (38 percent), followed by i-Ready Reading (33 percent) and Heggerty’s Bridge to Reading (31 percent).
Figure 23. The most popular reading curriculum among K–3 teachers is UFLI Foundations.
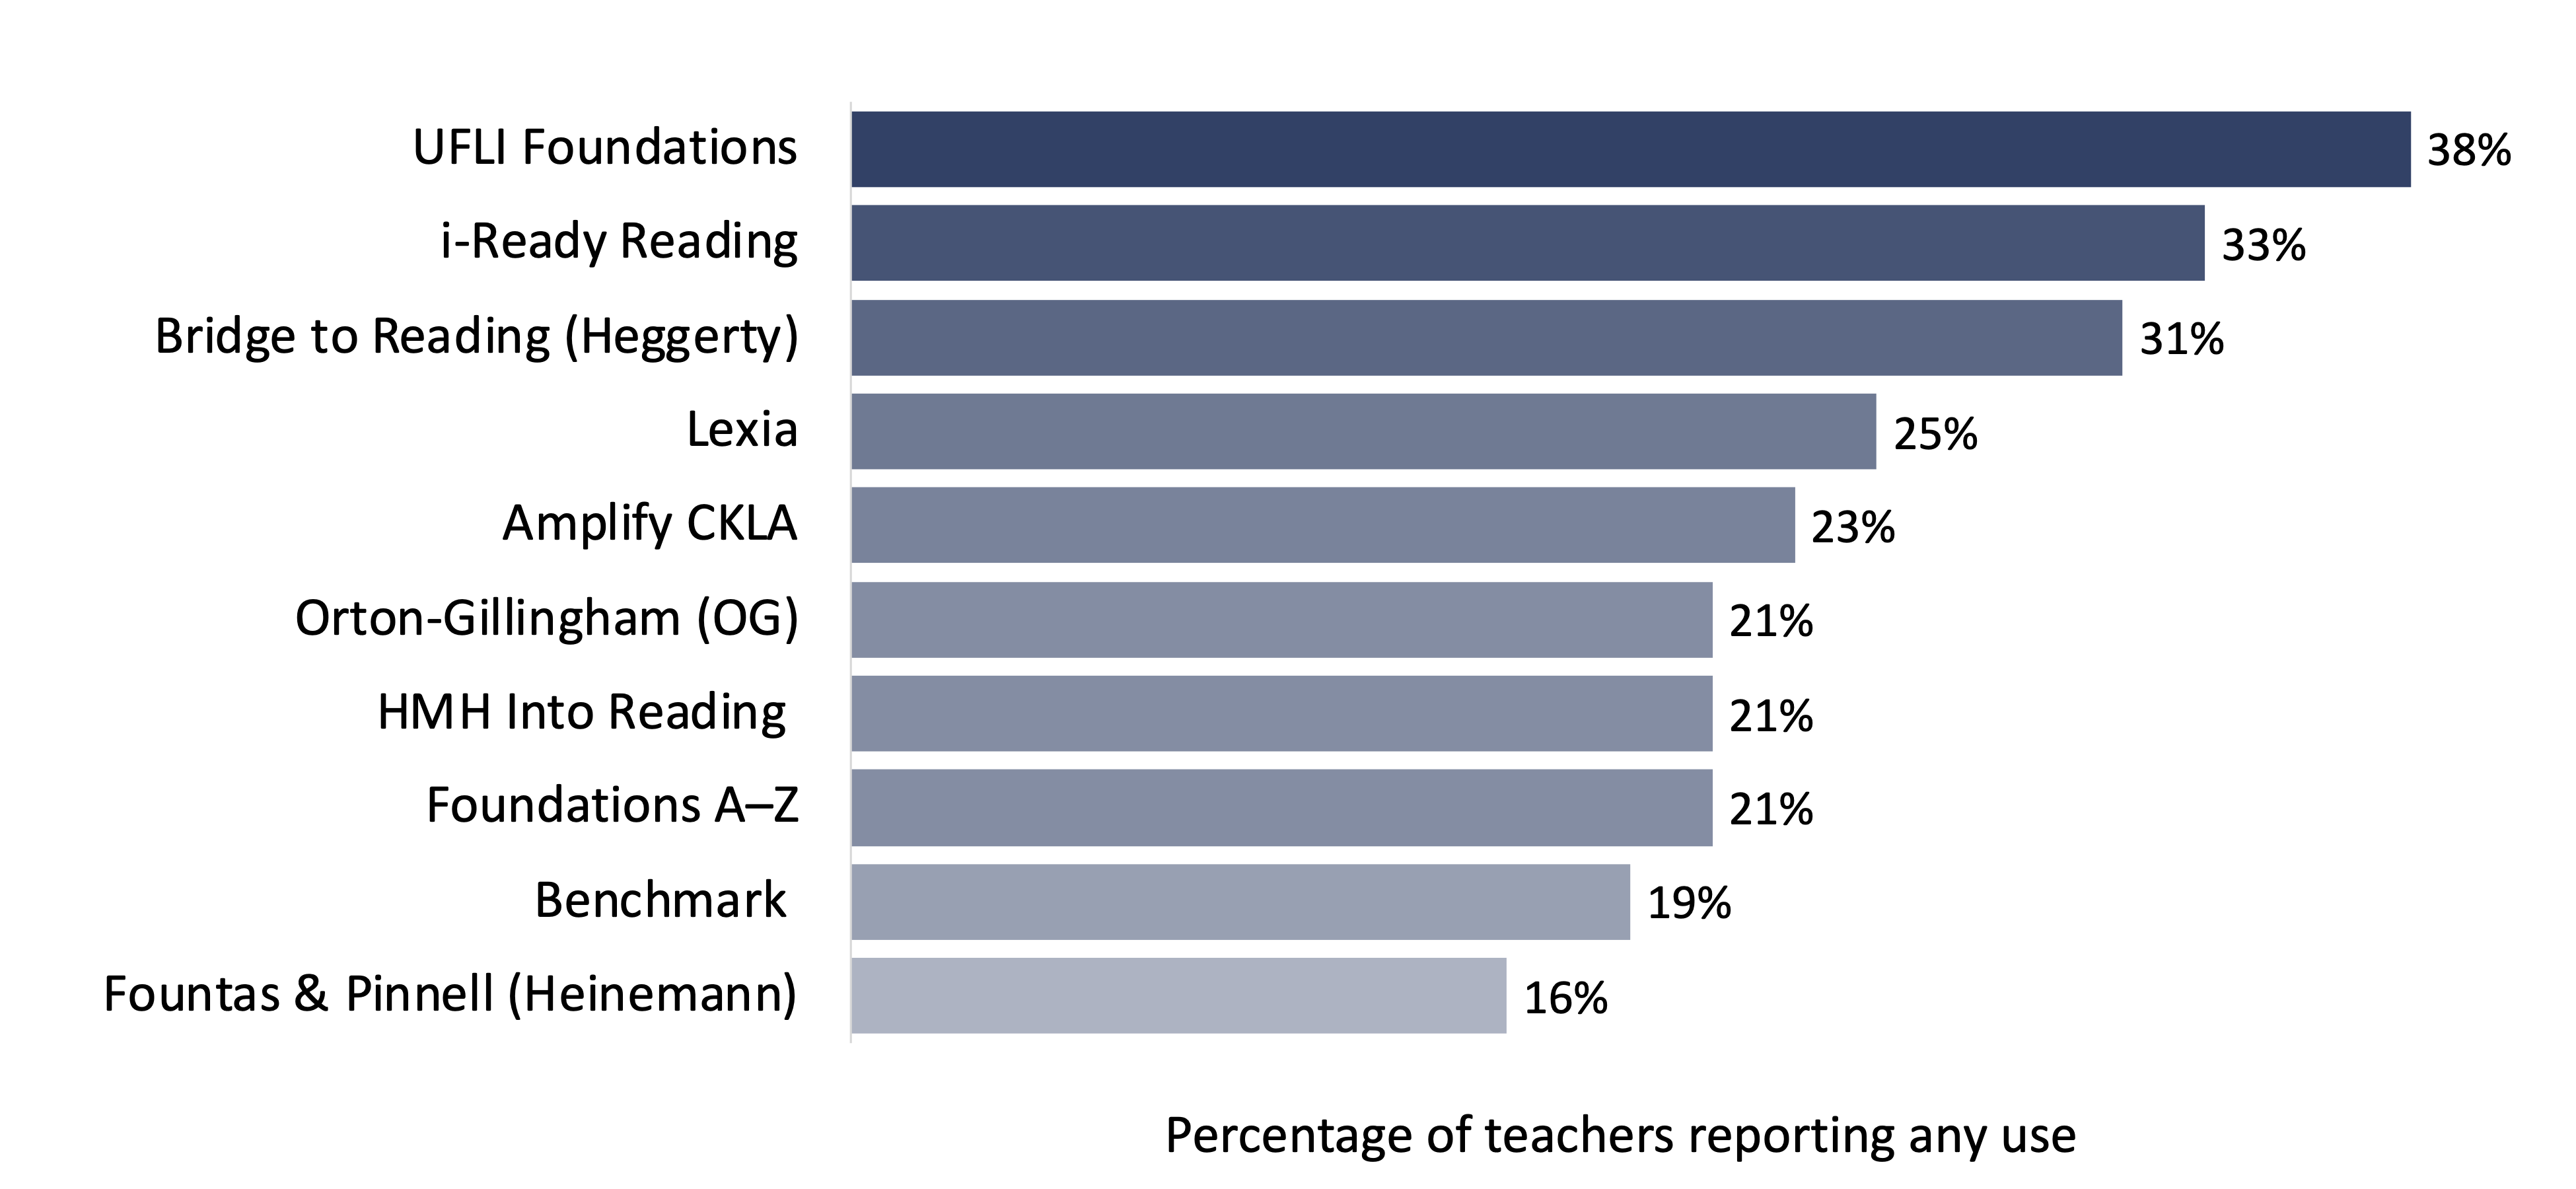
Note: Survey question: “Please select the 2–3 instructional materials in each row and column that you rely on to teach ELA skills.”
Encouragingly, teachers who reported using UFLI Foundations scored significantly higher on our science of reading quiz than the rest of the sample, as did teachers who reported using Amplify CKLA (Figure 24). In contrast, teachers who reported using i-Ready Reading, Benchmark Advance or Literacy, or Fountas & Pinnell scored below average.
Figure 24. Teachers who use UFLI Foundations and/or Amplify CKLA have more knowledge of reading science, while those who use i-Ready, Benchmark, and/or Fountas & Pinnell have less knowledge.
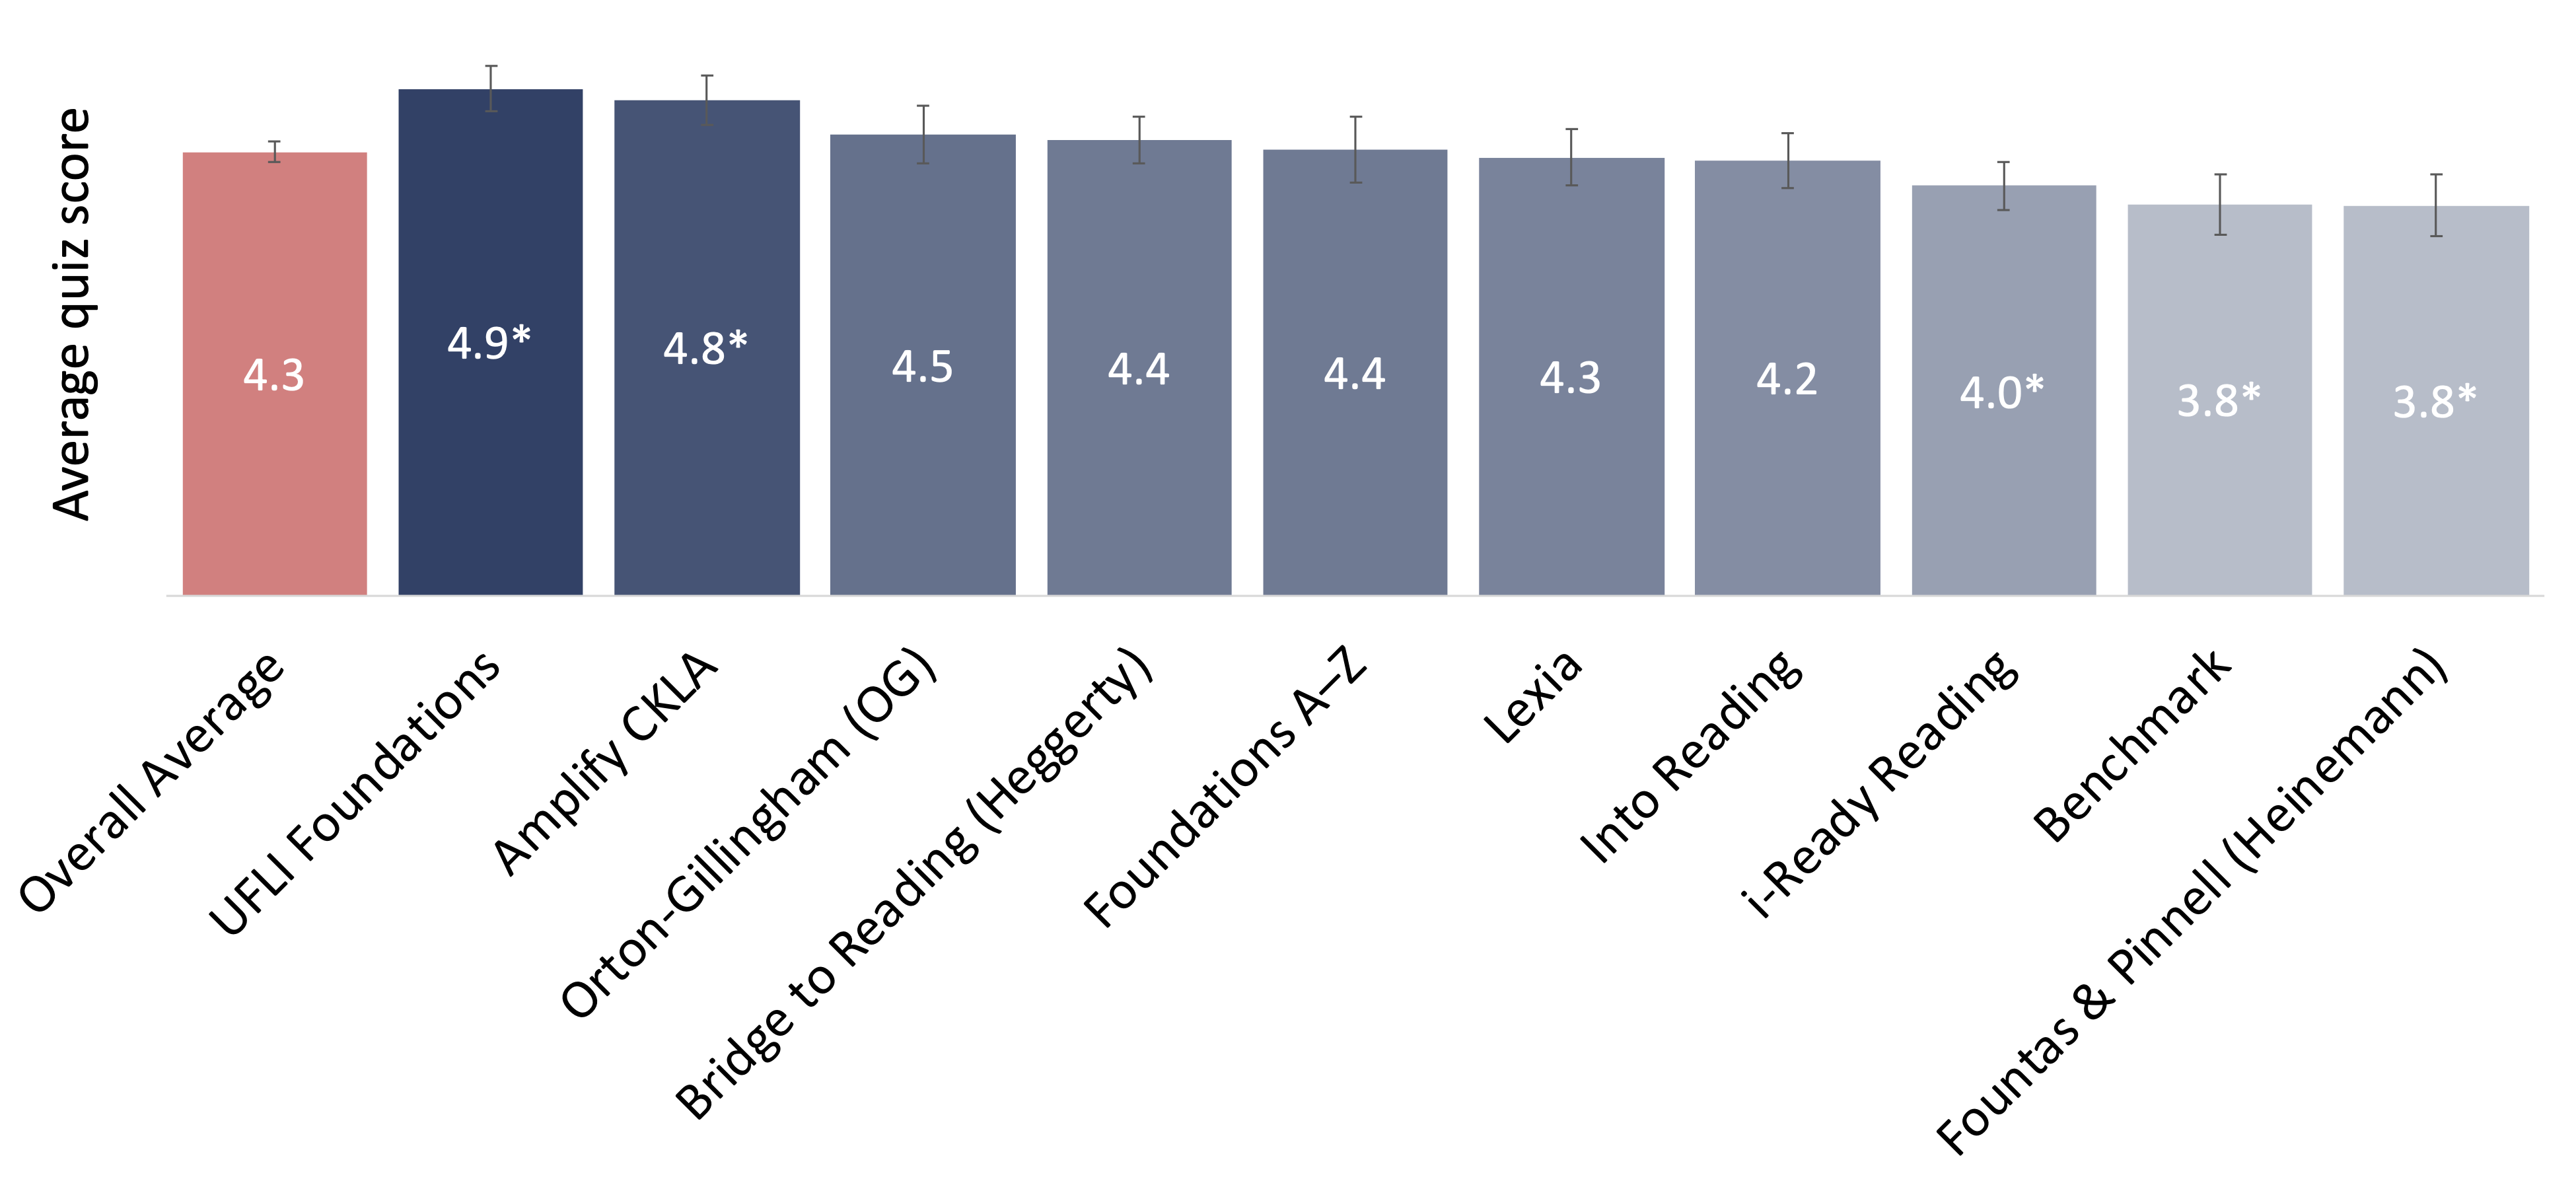
Note: An asterisk indicates a difference that is statistically significant at the 95 percent confidence level. The peach-colored bar indicates the reference category (“Overall Average”).
In general, these relationships are consistent with reading experts’ perceptions of the curricula in question. For example, UFLI Foundations is generally well regarded by reading experts, whereas Fountas & Pinnell has been criticized. Still, it’s important to recognize that these relationships are correlational.
Possibly, using UFLI Foundations and Amplify CKLA increases teachers’ knowledge of the science of reading. However, it could be that teachers with greater preexisting knowledge of reading science are more likely to use these curricula. Or perhaps, seeing as both curricula tend to be packaged with professional development that bears their names, it is the combination of professional development and access to an aligned curriculum that boosts teachers’ knowledge.
Recommendations
1. Require colleges of education and other teacher preparation programs to provide instruction aligned to the science of reading.
Perhaps nothing would have a bigger impact on the quality of reading instruction than improving preservice preparation. But unfortunately, colleges of education have developed a reputation for dragging their feet on this topic, and many continue to teach discredited practices such as three-cueing. To push them in the right direction, states should consider setting explicit instructional standards, inviting or requiring faculty members to participate in state-sponsored professional development, developing model courses on the science of reading, conducting periodic reviews of reading coursework and syllabi, and requiring institutions to publish their graduates’ first-time pass rates on state science of reading licensure exams.
2. Require new K–3 teachers to pass licensure exams that include comprehensive knowledge of the latest reading science.
Given the difficulty of achieving high-quality preservice preparation at scale, a strong licensure exam is critical to upholding standards of knowledge for new teachers and holding teacher preparation programs accountable for their treatment of reading science. Too often, professional development that is focused on the science of reading compensates for a lack of understanding among novice teachers. But our results suggest that a comprehensive licensure exam can improve novice teachers’ baseline understanding.
3. Require every K–3 teacher to complete at least one science of reading training in their first two to three years on the job.
Numerous science of reading–aligned teacher trainings are now available to districts and states that are looking to boost their teachers’ understanding. Although we haven’t examined the content of these trainings, our analysis shows that teachers who complete LETRS, UFLI Foundations, or Amplify CKLA have a clearer grasp of reading science than the rest of the sample, as do those who complete state-sponsored trainings (though we aren’t in a position to endorse specific states’ professional development–related choices).
4. Require districts to adopt a science of reading–aligned K–3 curriculum of their choosing from a state-approved list.
Like the other levers that policymakers can pull, this one doesn't work perfectly. Still, it makes sense for state departments of education to curate a list of curricula that are fully aligned with the science of reading yet diverse enough to fit the needs of all their students (including English learners and students with dyslexia). As noted, our results indicate that use of UFLI Foundations and/or Amplify CKLA is associated with deeper knowledge of reading science, whereas use of i-Ready, Benchmark, and/or Fountas & Pinnell is associated with less knowledge. But of course, it is important for researchers and states to regularly assess the content of these and other curricula directly.
Conclusion
The results suggest at least two related takeaways.
First, K–3 teachers’ knowledge of the science of reading is improving. Indeed, nearly all teachers said they had received at least some science of reading–focused professional development in the previous two to three years, and most had taken at least one nationally recognized science of reading–aligned training. Moreover, most teachers also said their professional development had been useful. Importantly, those who had received more science of reading–aligned professional development exhibited better knowledge of and commitment to the science of reading than other teachers, as did those who reported using science of reading–aligned curricula and those in states with strong science of reading–aligned licensure exams. In short, attempts to boost teachers’ knowledge of and commitment to reading science are working.
Yet there remains an urgent need for further improvement. After all, despite everything that has been said and written in the past few years, nearly a third of teachers still put phonics and cueing on equal footing, at least as many still seem to think of reading comprehension as a generalizable skill, and some are still using questionable reading/literacy curricula. Moreover, despite the progress that has been made in some locations, teachers in high-poverty, majority-nonwhite schools are still, on average, less informed about and committed to basic principles of reading science than teachers in whiter and/or more affluent settings.
In short, it is still far too soon to declare victory—and of course, we cannot accept defeat.
Appendices
Appendix A: Science of Reading Survey
We welcome future scholarly use of this instrument. Researchers who reproduce or adapt these survey items should cite this report as the original source.
Welcome to the science of reading survey.
Thank you for participating in the American Teacher Panel. This survey focuses on K–3 reading instruction and policy.
If you have responded to previous surveys, some items may look familiar. We are trying to understand whether your perceptions have changed over time, so please answer the items again.
If you are unsure about a question, please respond in a manner that most closely reflects your experiences. As a teacher, your careful and honest responses are critical to helping us better understand the instructional materials you use and how your school system supports your instruction.
This survey takes about 10 minutes to complete and you will receive $10 for your participation.
Please note that you must click the link titled “Click Here to Receive Your Gift Code” on the final page for your survey to be considered complete and to receive the gift code.
Tips for taking this survey:
We recommend completing this survey on a desktop or laptop for best viewing (not on a mobile device).
Please use only the on-screen “Next >>” and “Back” buttons to navigate the survey rather than using your browser’s back button or hitting Enter. You may find that the system slows down at times. We appreciate your patience in waiting for questions to load.
If you run into problems or have questions when completing the survey, please contact the American Teacher Panel helpdesk at [email protected] or 1-833-634-1533.
If you have questions about this study or your rights as a research participant, please contact the RAND Human Subjects Protection Committee toll-free at (866) 697-5620 or by email to [email protected]. When you contact the Committee, please reference Study 2021-N0159.
This school year (2025–26), what grade(s) do you teach?
Select all that apply.
- ☐ Pre-K
- ☐ Kindergarten
- ☐ 1st
- ☐ 2nd
- ☐ 3rd
- ☐ 4th
- ☐ 5th
- ☐ 6th
- ☐ 7th
- ☐ 8th
- ☐ 9th
- ☐ 10th
- ☐ 11th
- ☐ 12th
- ☐ Ungraded
- ☐ Other (please specify): __________
This school year (2025–26), in what subject is your MAIN teaching assignment (the subject in which you teach the most classes)?
Select one response.
- ☐ Elementary Education (including Pre-K)
- ☐ Special Education
- ☐ Arts and Music
- ☐ English and Language Arts (including English, language arts, reading, literature, writing, speech, etc.)
- ☐ English as a Second Language (ESL)
- ☐ Foreign Languages
- ☐ Health Education
- ☐ Mathematics (including general mathematics, algebra, geometry, calculus, etc.)
- ☐ Computer Science
- ☐ Natural Sciences (including general science, biology, chemistry, physics, etc.)
- ☐ Social Sciences (including social studies, geography, history, government/civics, etc.)
- ☐ Career or Technical Education
- ☐ Other (please specify): __________
Please indicate what subjects you teach as part of your elementary education or Pre-K teaching assignment this school year (2025–26).
Select all that apply.
- ☐ Special Education
- ☐ Arts and Music
- ☐ English and Language Arts (including English, language arts, reading, literature, writing, speech, etc.)
- ☐ English as a Second Language (ESL)
- ☐ Foreign Languages
- ☐ Health Education
- ☐ Mathematics (including general mathematics, algebra, geometry, calculus, etc.)
- ☐ Computer Science
- ☐ Natural Sciences (including general science, biology, chemistry, physics, etc.)
- ☐ Social Sciences (including social studies, geography, history, government/civics, etc.)
- ☐ Career or Technical Education
- ☐ Other (please specify): __________
Please indicate what subjects you teach as part of your special education teaching assignment this school year (2025–26).
Select all that apply.
- ☐ N/A – I do not teach other subjects
- ☐ Arts and Music
- ☐ English and Language Arts (including English, language arts, reading, literature, writing, speech, etc.)
- ☐ English as a Second Language (ESL)
- ☐ Foreign Languages
- ☐ Health Education
- ☐ Mathematics (including general mathematics, algebra, geometry, calculus, etc.)
- ☐ Computer Science
- ☐ Natural Sciences (including general science, biology, chemistry, physics, etc.)
- ☐ Social Sciences (including social studies, geography, history, government/civics, etc.)
- ☐ Career or Technical Education
- ☐ Other (please specify): __________
Please indicate any other subject(s) you teach as part of your regular teaching assignment this school year (2025–26).
Select all that apply.
- ☐ N/A – I do not teach other subjects
- ☐ Special Education
- ☐ Arts and Music
- ☐ English and Language Arts (including English, language arts, reading, literature, writing, speech, etc.)
- ☐ English as a Second Language (ESL)
- ☐ Foreign Languages
- ☐ Health Education
- ☐ Mathematics (including general mathematics, algebra, geometry, calculus, etc.)
- ☐ Computer Science
- ☐ Natural Sciences (including general science, biology, chemistry, physics, etc.)
- ☐ Social Sciences (including social studies, geography, history, government/civics, etc.)
- ☐ Career or Technical Education
- ☐ Other (please specify): __________
Section A1: Student & Teacher Characteristics
What is your primary role this school year?
Select one response.
- ☐ I teach a self-contained general education class. (I teach all core subjects to the same group of students.)
- ☐ I teach ELA or literacy (departmentalized model)
- ☐ I teach math and science (departmentalized model)
- ☐ I am a special education teacher
- ☐ Other (please specify): __________
Approximately how many students do you currently teach in a typical week?
Numeric response.
Of these students, approximately how many are…
- English learners __________
- Receiving special education services (IEP/504) __________
- Students who have been held back at least once __________
Section A2: Classroom Practice
Which of the following best describes your approach to reading instruction?
Select one response.
- ☐ Structured: systematic and explicit instruction in phonics, decoding, and related skills.
- ☐ Balanced: a mix of phonics, leveled texts, and guided reading with cueing support.
- ☐ Immersive: emphasis on literature-rich environments, read-alouds, and student choice.
- ☐ Eclectic: a variety of instructional approaches depending on the needs of the student.
Do you generally favor the use of phonics (i.e., encouraging students to sound out words) or cueing (i.e., encouraging students to use context clues) when teaching?
Select one response.
- ☐ Phonics
- ☐ Cueing
- ☐ Both equally
- ☐ Neither
On a scale of 1 to 5, how comfortable do you feel teaching each of the following?
Select one response in each row.
| 1 Not at all |
2 Slightly |
3 Moderately |
4 Very |
5 Extremely |
|
|---|---|---|---|---|---|
| Phonemic/Phonological awareness | ☐ | ☐ | ☐ | ☐ | ☐ |
| Phonics | ☐ | ☐ | ☐ | ☐ | ☐ |
| Vocabulary | ☐ | ☐ | ☐ | ☐ | ☐ |
| Reading comprehension | ☐ | ☐ | ☐ | ☐ | ☐ |
| Students who are English learners | ☐ | ☐ | ☐ | ☐ | ☐ |
| Students with learning differences (e.g., dyslexia) | ☐ | ☐ | ☐ | ☐ | ☐ |
Which statement do you agree with more?
Select one response.
- ☐ Reading comprehension depends on a set of generalizable skills (like finding the main idea and making inferences) that can be applied to most texts.
- ☐ Reading comprehension depends on what students already know about the topic and the specific vocabulary used in a text.
Which statement do you agree with more?
Select one response.
- ☐ Elementary curricula should take a systematic approach to subjects like history and science to ensure consistent knowledge-building.
- ☐ Elementary curricula should give students opportunities to explore a wide range of history and science topics that spark their interest and engagement.
In your opinion, which of the following is the best way to build vocabulary?
Select one response.
- ☐ Assigning weekly word lists for memorization and assessment
- ☐ Encouraging students to read age-appropriate fiction independently
- ☐ Embedding explicit vocabulary instruction in content-rich nonfictional texts
- ☐ Teaching students to use context clues to infer the meaning of unfamiliar words
In your opinion, which of the following is the best way to improve reading comprehension?
Select one response.
- ☐ Using leveled texts that are matched to students’ reading levels
- ☐ Teaching students how to identify the main idea and supporting details
- ☐ Providing content-rich instruction to build background knowledge across subjects
- ☐ Encouraging students to read independently on a regular basis (e.g., Sustained Silent Reading)
A student in your class is having trouble reading an unfamiliar word during small-group instruction. In your opinion, what should a teacher do first?
Select one response.
- ☐ Model correct pronunciation and prompt the student to reread the sentence
- ☐ Ask the student what word would make sense in the context of the sentence
- ☐ Help the student break the word into parts to identify syllables or phonics patterns
- ☐ Allow the student to keep reading and return to the word later to support fluency
In your opinion, which of the following are effective ways to meet the needs of English learners?
Select all that apply.
- ☐ Building vocabulary through conversation and read alouds
- ☐ Using visuals and oral explanations to support comprehension
- ☐ Delaying explicit phonics instruction until oral English proficiency is strong
- ☐ Avoiding academic language and syntax until students achieve conversational fluency
Based on your understanding of the condition, which of the following claims about dyslexia are accurate?
Select all that apply.
Students with dyslexia…
- ☐ Do not typically benefit from explicit phonics instruction
- ☐ Often struggle with decoding despite strong oral language skills
- ☐ Often have difficulty identifying and manipulating the sounds in words
- ☐ Have difficulty reading because they confuse or reverse letters and words
Section A3: Policy
Please select the 2-3 instructional materials in each row and column that you rely on to teach ELA skills, if any.
Select 2-3 instructional materials in each row and column.
| Primary Core Program (if any) |
Supplemental Program/Material (if any) |
Intervention Program/Material (if any) |
|
|---|---|---|---|
| All About Reading | ☐ | ☐ | ☐ |
| ARC Core (American Reading Company) | ☐ | ☐ | ☐ |
| Benchmark Advance or Literacy | ☐ | ☐ | ☐ |
| Bookworms (Comprehensive Reading Solutions or Open Up Resources) | ☐ | ☐ | ☐ |
| Bridge to Reading (Heggerty) | ☐ | ☐ | ☐ |
| EL Education | ☐ | ☐ | ☐ |
| Calvert Learning (Edmentum) | ☐ | ☐ | ☐ |
| Collaborative Literacy (Center for Collaborative Classroom) | ☐ | ☐ | ☐ |
| CommonLit | ☐ | ☐ | ☐ |
| Core Knowledge Language Arts (CKLA) (Amplify) | ☐ | ☐ | ☐ |
| Core Knowledge Language Arts (CKLA) (Core Knowledge) | ☐ | ☐ | ☐ |
| EL Education or Expeditionary Learning (Open Up Resources, EL Education, or Imagine Learning, formerly LearnZillion) | ☐ | ☐ | ☐ |
| Engage NY (NYSED) | ☐ | ☐ | ☐ |
| English Language Arts Guidebook Units (Imagine Learning, formerly LearnZillion) | ☐ | ☐ | ☐ |
| Fast ForWord | ☐ | ☐ | ☐ |
| FishTank (William H. Sadlier, Inc) | ☐ | ☐ | ☐ |
| Foundations A-Z (Learning A-Z) | ☐ | ☐ | ☐ |
| Fountas and Pinnell (Heineman) | ☐ | ☐ | ☐ |
| From Phonics to Reading | ☐ | ☐ | ☐ |
| Fundations (Wilson Language Training) | ☐ | ☐ | ☐ |
| Geodes | ☐ | ☐ | ☐ |
| Great Leaps | ☐ | ☐ | ☐ |
| Into Reading (Houghton Mifflin Harcourt) | ☐ | ☐ | ☐ |
| i-Ready | ☐ | ☐ | ☐ |
| Jolly Phonics (Jolly Learning, LTD) | ☐ | ☐ | ☐ |
| Journeys (Houghton Mifflin Harcourt) | ☐ | ☐ | ☐ |
| Lexia | ☐ | ☐ | ☐ |
| Lindamood Phoneme Sequencing (LiPS) | ☐ | ☐ | ☐ |
| Lucy Calkins Units of Study or Teacher's College Reading and Writing Project – 2018 | ☐ | ☐ | ☐ |
| Revised Lucy Calkins Units of Study or Teacher's College Reading and Writing Project – 2022 | ☐ | ☐ | ☐ |
| Magnetic Reading (i-Ready + Curriculum Associates) | ☐ | ☐ | ☐ |
| MyView Literacy (Savvas) | ☐ | ☐ | ☐ |
| Open Court Reading (McGraw-Hill Education) | ☐ | ☐ | ☐ |
| Open Court Reading Foundational Skills Kits (McGraw-Hill Education) | ☐ | ☐ | ☐ |
| Orton-Gillingham (OG) | ☐ | ☐ | ☐ |
| Pathways to Reading | ☐ | ☐ | ☐ |
| Peer Assisted Learning Strategies (PALS) | ☐ | ☐ | ☐ |
| Phonics First | ☐ | ☐ | ☐ |
| Reading Horizons Discovery | ☐ | ☐ | ☐ |
| Reading Street Common Core (Savvas Learning Company, formerly Pearson) | ☐ | ☐ | ☐ |
| Read Naturally | ☐ | ☐ | ☐ |
| Reading Wonders (McGraw-Hill Education) | ☐ | ☐ | ☐ |
| ReadyGEN (Savvas Learning Company, formerly Pearson) | ☐ | ☐ | ☐ |
| Ready Reading (Curriculum Associates) | ☐ | ☐ | ☐ |
| Reach for Reading (National Geographic Learning, Cengage) | ☐ | ☐ | ☐ |
| Really Great Reading [Launchpad, Countdown, Blast, or HD Word] | ☐ | ☐ | ☐ |
| Savvas Essentials: Foundational Reading | ☐ | ☐ | ☐ |
| Saxon Phonics and Spelling (Houghton Mifflin Harcourt) | ☐ | ☐ | ☐ |
| SRA Reading Mastery Transformations (McGraw-Hill) | ☐ | ☐ | ☐ |
| Success For All | ☐ | ☐ | ☐ |
| Superkids (Zaner-Bloser) | ☐ | ☐ | ☐ |
| SPIRE The Fountas & Pinnell Classroom (Heinemann) | ☐ | ☐ | ☐ |
| Treasures (Macmillan/McGraw-Hill) | ☐ | ☐ | ☐ |
| UFLI Foundations (University of Florida Literacy Institute) | ☐ | ☐ | ☐ |
| Wilson Reading System | ☐ | ☐ | ☐ |
| Wit & Wisdom (Great Minds) | ☐ | ☐ | ☐ |
| 95 Phonics Core Program | ☐ | ☐ | ☐ |
| Unpublished materials developed by the district | ☐ | ☐ | ☐ |
| Unpublished materials developed by the school | ☐ | ☐ | ☐ |
| Unpublished materials developed by the teacher | ☐ | ☐ | ☐ |
| Other published materials (Please specify below) | ☐ | ☐ | ☐ |
Which of the following science of reading–aligned trainings have you completed in the last 2-3 years?
Select all that apply.
- ☐ LETRS (Language Essentials for Teachers of Reading and Spelling)
- ☐ IMSE Orton-Gillingham (any variation, level, or certification)
- ☐ 95 Percent Group (Top 10 Tools)
- ☐ Fundations (Wilson Reading System)
- ☐ Keys to Literacy
- ☐ Lindamood-Bell
- ☐ Heggerty Phonemic Awareness
- ☐ Really Great Reading (e.g., HD Word, Blast Foundations)
- ☐ UFLI (University of Florida Literacy Institute)
- ☐ Core Knowledge Language Arts (CKLA)
- ☐ State-sponsored SoR-aligned training (e.g., PD from your state DOE)
- ☐ Other training you believe is SoR-aligned (please specify): ________
- ☐ I have not participated in any of these.
What types of reading/literacy instructional support have you received in the past 2–3 years?
Select all that apply.
- ☐ Professional learning sessions or workshops
- ☐ Modeling of lessons (e.g., demonstration teaching)
- ☐ Classroom observation with feedback
- ☐ Instructional coaching or mentoring
- ☐ Support with implementing a new reading/literacy curriculum or programs
- ☐ Collaboration with peers or PLCs (Professional Learning Communities)
- ☐ Other (please specify): _________
- ☐ I have not received any reading/literacy instructional support
Overall, how much emphasis has your professional development put on each of the following reading-related topics in the past 2-3 years?
Select one response in each row.
| A lot | Some | A little | None | I don’t remember | |
|---|---|---|---|---|---|
| 1 The science of reading | ☐ | ☐ | ☐ | ☐ | ☐ |
| 2 Oral language development | ☐ | ☐ | ☐ | ☐ | ☐ |
| 3 Phonemic/Phonological awareness | ☐ | ☐ | ☐ | ☐ | ☐ |
| 4 Phonics | ☐ | ☐ | ☐ | ☐ | ☐ |
| 5 Vocabulary | ☐ | ☐ | ☐ | ☐ | ☐ |
| 6 Reading comprehension | ☐ | ☐ | ☐ | ☐ | ☐ |
| 7 Content/Background knowledge | ☐ | ☐ | ☐ | ☐ | ☐ |
| 8 High-quality reading curricula/instructional materials | ☐ | ☐ | ☐ | ☐ | ☐ |
| 9 Supports for English learners | ☐ | ☐ | ☐ | ☐ | ☐ |
| 10 Supports for students with IEPs and/or learning differences (e.g., dyslexia) | ☐ | ☐ | ☐ | ☐ | ☐ |
On a scale of 1 to 5, how useful has the professional development you’ve received in the last 2-3 years been when it comes to helping students learn to read?
Select one response.
- ☐ 1 Not at all
- ☐ 2 Slightly
- ☐ 3 Moderately
- ☐ 4 Very
- ☐ 5 Extremely
How much emphasis did your preservice teacher preparation program put on the following topics?
Select one response in each row.
| A lot | Some | A little | None | I don’t remember | |
|---|---|---|---|---|---|
| 1 The science of reading | ☐ | ☐ | ☐ | ☐ | ☐ |
| 2 Oral language development | ☐ | ☐ | ☐ | ☐ | ☐ |
| 3 Phonemic/phonological awareness | ☐ | ☐ | ☐ | ☐ | ☐ |
| 4 Phonics | ☐ | ☐ | ☐ | ☐ | ☐ |
| 5 Vocabulary | ☐ | ☐ | ☐ | ☐ | ☐ |
| 6 Reading comprehension | ☐ | ☐ | ☐ | ☐ | ☐ |
| 7 Content/background knowledge | ☐ | ☐ | ☐ | ☐ | ☐ |
| 8 High-quality reading curricula/instructional materials | ☐ | ☐ | ☐ | ☐ | ☐ |
| 9 Supports for English learners | ☐ | ☐ | ☐ | ☐ | ☐ |
| 10 Supports for students with IEPs and/or learning differences (e.g., dyslexia) | ☐ | ☐ | ☐ | ☐ | ☐ |
Where have you learned the most about effective practices for teaching children to read—practices you actually use in your classroom?
Select one response.
- ☐ My preservice teacher preparation program
- ☐ In-service professional development (e.g., workshops, professional learning communities)
- ☐ My reading/literacy coach
- ☐ My school’s ELA curriculum or publisher-provided training
- ☐ My own research (e.g., books, articles, podcasts, Google, ChatGPT)
- ☐ Other educators (e.g., mentors, colleagues, grade-level teams)
- ☐ On the job experiences with students
- ☐ Other (please specify): _________
Are you familiar with your state’s policies on grade retention (e.g., for struggling third-grade readers)?
Select one response.
- ☐ Yes
- ☐ No
- ☐ Not sure
Which statement best reflects your view of your state’s grade retention policies?
Select one response.
- ☐ These policies have a positive impact because struggling readers get more attention and support.
- ☐ These policies have a negative impact because they harm struggling readers’ motivation and morale.
- ☐ These policies don’t have much impact because everyone knows most students won’t really be retained.
Final thoughts
In your own words, please describe the most significant changes in early reading or ELA instruction that you have experienced in recent years.
Open text box.
Appendix B: Science of Reading “Quiz”
Part 1: Decoding (3 points)
Q1. Which of the following best describes your approach to reading instruction?
- 01 Structured: systematic and explicit instruction in phonics, decoding, and related skills.
- 02 Balanced: a mix of phonics, leveled texts, and guided reading with cueing support.
- 03 Immersive: emphasis on literature-rich environments, read-alouds, and student choice.
- 04 Eclectic: a variety of instructional approaches depending on the needs of the student.
Teachers got 1 point for selecting “Structured” and 0 points for any other response.
Q2. Do you generally favor the use of phonics (i.e., encouraging students to sound out words) or cueing (i.e., encouraging students to use context clues) when teaching?
- 01 Phonics
- 02 Cueing
- 03 Both equally
- 04 Neither
Teachers got 1 point for selecting “Phonics,” 0 points for selecting “Both equally,” and -1 point for selecting “Cueing.”
Q3. A student in your class is having trouble reading an unfamiliar word during small-group instruction. In your opinion, what should a teacher do first?
- 01 Model correct pronunciation and prompt the student to reread the sentence
- 02 Ask the student what word would make sense in the context of the sentence
- 03 Help the student break the word into parts to identify syllables or phonics patterns
- 04 Allow the student to keep reading and return to the word later to support fluency
Teachers got 1 point for selecting “Help the student break the word into parts to identify syllables or phonics patterns” and 0 points for any other response.
Part 2: Reading Comprehension (3 points)
Q4. Which statement do you agree with more?
- 01 Reading comprehension depends on a set of generalizable skills (like finding the main idea and making inferences) that can be applied to most texts.
- 02 Reading comprehension depends on what students already know about the topic and the specific vocabulary used in a text.
Teachers got 1 point for selecting “Reading comprehension depends on what students already know about the topic and the specific vocabulary used in a text” and 0 points for any other response.
Q5. In your opinion, which of the following is the best way to build vocabulary?
- 01 Assigning weekly word lists for memorization and assessment
- 02 Encouraging students to read age-appropriate fiction independently
- 03 Embedding explicit vocabulary instruction in content-rich nonfictional texts
- 04 Teaching students to use context clues to infer the meaning of unfamiliar words
Teachers got 1 point for selecting “Embedding explicit vocabulary instruction in content-rich nonfictional texts” and 0 points for any other response.
Q6. In your opinion, which of the following is the best way to improve reading comprehension?
- 01 Using leveled texts that are matched to students’ reading levels
- 02 Teaching students how to identify the main idea and supporting details
- 03 Providing content-rich instruction to build background knowledge across subjects
- 04 Encouraging students to read independently on a regular basis (e.g., Sustained Silent Reading)
Teachers got 1 point for selecting “Providing content-rich instruction to build background knowledge across subjects” and 0 points for any other response.
Part 3: English Learners (1 point)
Q7. In your opinion, which of the following are effective ways to meet the needs of English learners? (SELECT ALL THAT APPLY)
- 01 Building vocabulary through conversation and read alouds
- 02 Using visuals and oral explanations to support comprehension
- 03 Delaying explicit phonics instruction until oral English proficiency is strong
- 04 Avoiding academic language and syntax until students achieve conversational fluency
Teachers got 1 point for selecting only the correct responses (items 01 and 02) and 0 points otherwise.
Part 4: Dyslexia (1 point)
Q8. Based on your understanding of the condition, which of the following claims about dyslexia are accurate? (SELECT ALL THAT APPLY)
Students with dyslexia…
- 01 Do not typically benefit from explicit phonics instruction
- 02 Often struggle with decoding despite strong oral language skills
- 03 Often have difficulty identifying and manipulating the sounds in words
- 04 Have difficulty reading because they confuse or reverse letters and words
Teachers got 1 point for selecting only the correct responses (items 02 and 03) and 0 points otherwise.
Appendix C: ExcelinEd State Literacy Policies
To examine the policy environment in which teachers work, survey data were merged with policy indicators from the ExcelinEd Early Literacy Matters initiative. This data set tracks state adoption of 18 policies aligned with the science of reading, including requirements for science of reading–related professional development, restrictions on three-cueing, and guidance on high-quality instructional materials.
We made only one adjustment to ExcelinEd’s categories (listed in Table C1): All states that have implemented an initial determinant retention at third grade based on a state assessment also have multiple routes to promotion and a good-cause exemption for some students. Because these policies perfectly overlapped, we collapsed all three into a simple indicator for whether states have used assessments to retain students in third grade.
Table C1: Fundamental Principles of Early Literacy
| Category name | Description | Number of implementing states (full or partial) |
|
|---|---|---|---|
| 1 | Science of Reading Training | States, districts, and individual schools should establish the science of reading as the common language for literacy instruction and then provide training to teachers to build their capacity to teach the foundational skills that all students need to become skilled readers. ExcelinEd’s Science of Reading Professional Learning Rubric is designed to assist state education agencies (SEAs) in their evaluation and selection of professional learning grounded in the science of reading. This rubric is intended for use by evaluators who have completed in-depth professional learning in the science of reading and have experience applying this knowledge in the classroom. As a result, SEAs can make informed decisions about the best professional learning providers for educators in their states. |
44 |
| 2 | Literacy/Reading Coaches | Literacy coaches are an important support mechanism for teachers in the classroom because they work directly with teachers to improve classroom practice and, ultimately, student reading achievement schoolwide. | 29 |
| 3 | Educator Preparation Program (EPP) Alignment | Aligning teacher preparation programs to the science of reading ensures that elementary school, early childhood, and special education educators licensed in a state have been provided with a strong foundation in evidence-based literacy instruction. | 45 |
| 4 | EPP Assessment | Aligning initial candidate licensure tests to the science of reading and evidence-based instructional practices is an efficient and comprehensive way for teachers to demonstrate that they possess the knowledge and skills needed to teach students to read. | 33 |
| 5 | Funding for Literacy Efforts | The primary grades are the least expensive and most timely opportunity to ensure every student is a successful reader. States should look for ways to reprioritize existing local, state, and federal funds to support reading instruction and intervention statewide. | 45 |
| 6 | Universal Reading Screener | An approved universal screener administered three times per year is a key step to identifying students who are at risk for reading difficulties, including dyslexia. | 43 |
| 7 | Screener for Characteristics of Dyslexia | For early interventions to target areas of need, a student must be identified as being at risk for a reading difficulty, including having characteristics consistent with someone who has dyslexia. | 38 |
| 8 | Parental Notification | Parents should be notified immediately if their children have been identified as having reading deficiencies. As trusted partners, parents need to be part of instructional decisions for their children and be provided with support on how to help their children with literacy at home. | 42 |
| 9 | District Adoption of High-Quality Instructional Materials | The materials that districts choose for reading instruction affect student learning and teacher practice. High-quality instructional materials aligned to the science of reading and the respective state standards give teachers access to high-quality content and assignments. | 42 |
| 10 | Eliminating Three-Cueing Instructional Materials | Three-cueing is a flawed practice that teaches students to read based on meaning, structure and syntax, and visual cues (MSV). This instructional model should be eliminated from curricula because it encourages students to guess, not sound out, words they do not know based on pictures or what they think might make sense given the context of the sentence. | 20 |
| 11 | Individualized Reading Plans | Students who have reading deficiencies should have individualized reading plans created for them. Each plan should include intervention services the student will receive and strategies for the child’s parents to use at home. | 32 |
| 12 | Regularly Monitor Student Progress | Progress monitoring helps teachers track a student’s progress in reading and adjust instruction to meet the student’s needs in a timely manner. Monitoring can take many forms and can be embedded in classroom instruction. | 47 |
| 13 | Evidence-Based Interventions | Interventions grounded in the science of reading should begin by targeting each student’s lowest-deficit skill as identified by data. | 40 |
| 14 | Summer Reading Camps | Reading skills being lost during the summer slows progress toward reading proficiency by the end of third grade. Children in low-income families lose one to three months’ worth of reading skills each summer. Reading camps can both remediate learning loss and build skills at the same time. | 20 |
| 15 | Parent Read-at-Home Plans | Read-at-home plans help families support their children’s literacy skills at home and are often included in individualized reading plans (IRPs). As soon as a student is identified as having a reading deficiency, a read-at-home plan should be provided to the student’s parents, and the parents of students who may face retention in third grade should also get read-at-home plans. | 35 |
| 16 | Initial Determinant Retention at Third Grade Based on a State Assessment | A student who is unable to demonstrate sufficient reading skills on a state test—and does not meet a good-cause exemption—should be retained. | 18 |
| 17 | Multiple Options for Promotion | The state offers at least three pathways for promotion to fourth grade, including achieving a predetermined level on the state reading assessment, passing an alternative assessment or retest, and successfully demonstrating sufficient third-grade reading skills through a portfolio of student work. | 20 |
| 18 | Good-Cause Exemptions for Some Students | Most students with disabilities and English language learners should be able to read on grade level if provided with effective instruction and specialized support. However, there should be good-cause exemptions that recognize the special needs of some students with disabilities, English language learners, and students who were previously retained. | 18 |
The report relies primarily on descriptive statistics to summarize teachers’ responses and knowledge levels. Survey weights were applied to produce nationally representative estimates.
To examine relationships between teachers’ knowledge of the science of reading and potential explanatory factors—including professional development, instructional materials, and state policies—we estimated simple bivariate correlations and regression models. These analyses were used to identify associations between teachers’ quiz scores and exposure to specific supports or policy environments. Because the analyses are observational and largely cross-sectional, the results should be interpreted as associational rather than causal.
All regressions are ordinary least squares estimates predicting respondents’ scores on our science of reading quiz, which range from zero to eight and fall on a normal distribution (see Figure D1). Each regression was calculated using heteroskedastic-robust standard errors. Estimates of significance were all calculated using a probability value cutoff of 0.05, and all confidence intervals are at the 95 percent level.
Figure D1. Distribution of Science of Reading Quiz Scores
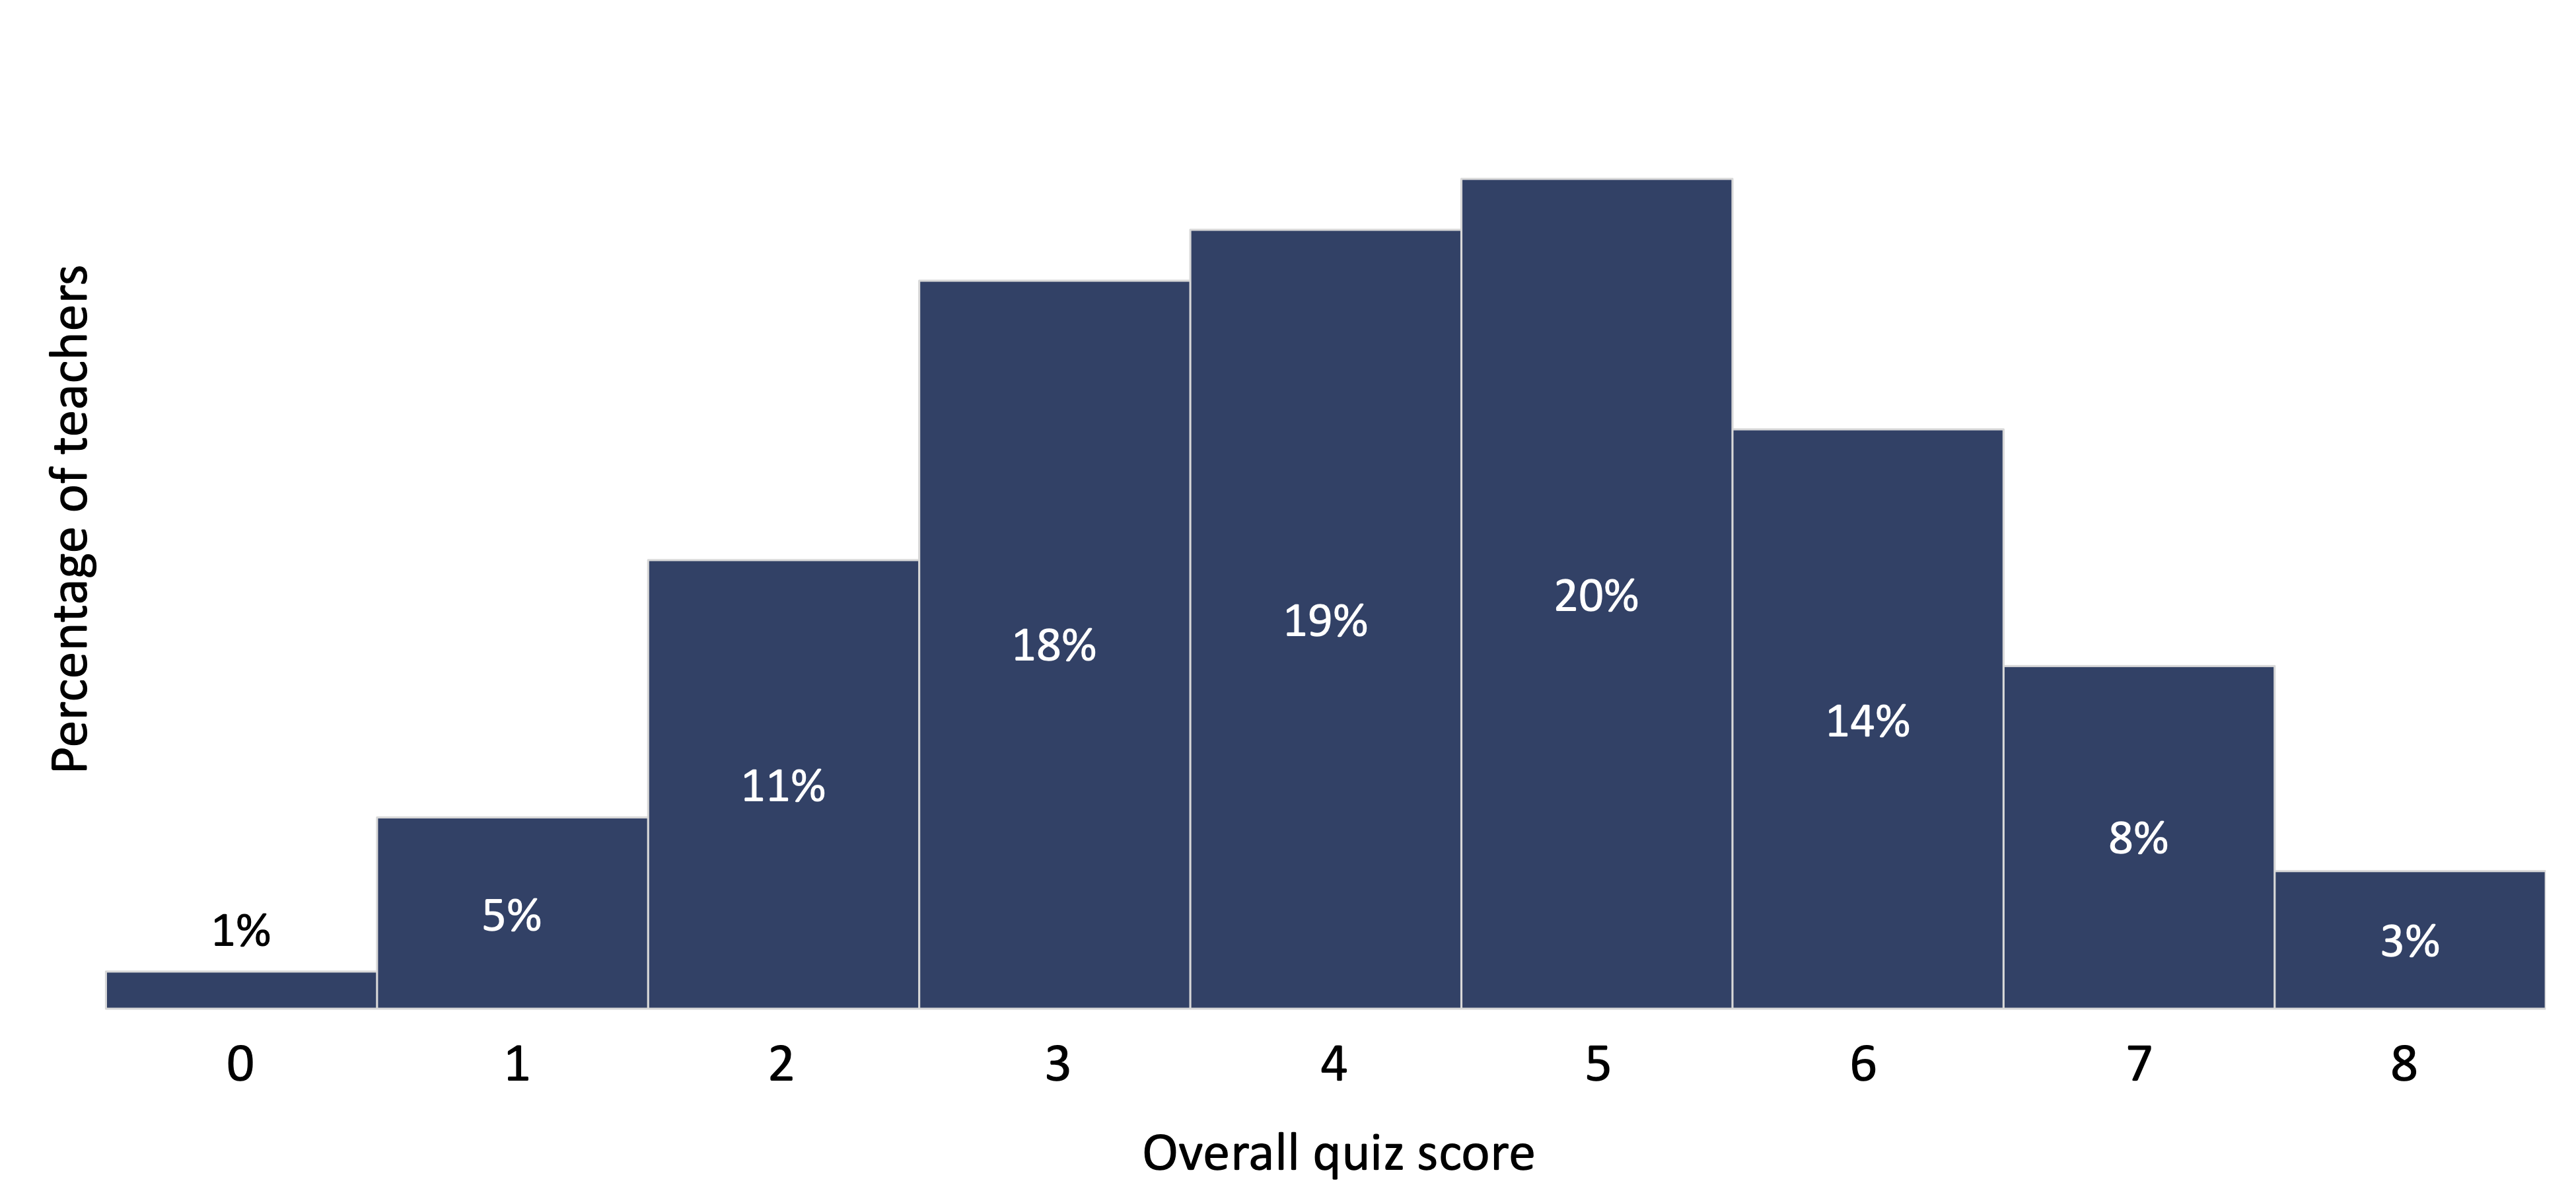
Endnotes
[1] Compared with their white colleagues, teachers of color are more likely to report using these same curricula: i-Ready (45 percent versus 29 percent), Fountas & Pinnell (21 percent versus 15 percent), and Benchmark Advance (24 percent versus 18 percent).
[2] For the sake of readers who are unfamiliar with the Simple View of Reading, we use “reading comprehension” to describe what the Simple View of Reading refers to as “language comprehension.”
[3] Specifically, the sample closely matches national benchmarks on key characteristics, including teachers’ gender, race/ethnicity, and years of experience, as well as their schools’ urbanicity, their student bodies’ racial/ethnic compositions, and their schools’ neighborhood poverty levels (measured by income-to-poverty ratio categories).
[4] The classic formula, first proposed by Gough and Tunmer (1986), defines reading comprehension (R) as the product of decoding (D) and language comprehension (C): R = D × C. In this formulation, “language comprehension” refers to understanding spoken language (e.g., vocabulary, background knowledge, and syntax), separate from decoding print. However, in our survey of teachers, we used the more familiar term “reading comprehension.” Although this reflects common usage, it is technically imprecise; the original model distinguishes between understanding language and decoding text, both of which are necessary for reading comprehension.
[5] Literacy Map - EarlyLiteracyMatters. (2024, February 21). EarlyLiteracyMatters. https://earlyliteracymatters.org/literacy-map
[6] In the ExcelinEd documentation, every state that implemented an “initial determinant for retention at third grade based on a state assessment” also had “multiple options for promotion” and “good-cause exemptions for some students” related to third-grade retention. Because the latter two also only applied to states rated as having implemented the former, we combined these categories to indicate “full implementation of a third-grade retention system.”
[7] According to ExcelinEd’s definitions, “full implementation” is when “the fundamental principle is adopted in policy and there is evidence of full implementation”; “partial implementation” is when “the fundamental principle is not adopted in policy, does not meet minimum implementation requirements, or is grant-based and not sustainable.” “Principle not adopted” was defined as “the fundamental principle is not adopted in policy, does not meet minimum implementation requirements, or is grant-based and not sustainable”; “future implementation,” which we treated as identical to “principle not adopted,” is when “the fundamental principle is adopted in policy with a future date for implementation.”
[8] Chetty, Raj, John N. Friedman, and Jonah E. Rockoff. “Measuring the impacts of teachers II: Teacher value-added and student outcomes in adulthood.” American Economic Review 104.9 (2014): 2633–2679.
[9] Jackson, C. Kirabo, Rucker C. Johnson, and Claudia Persico. The effects of school spending on educational and economic outcomes: Evidence from school finance reforms. No. w20847. National Bureau of Economic Research, 2015.
[10] The state-sponsored category should be interpreted with caution, as teachers in this category may have taken a branded course without knowing its name.
[11] Because only current teachers are included in the survey, this finding does not reflect the most recent pushes to reform college of education literacy instruction, such as those taking place in Indiana, Ohio, and California.
[12] Berne, Jordan S., Brian A. Jacob, Christina Weiland, and Katharine O. Strunk. The Impacts of Grade Retention Policy with Minimal Retention. NBER Working Paper no. 33764 (Cambridge, MA: National Bureau of Economic Research, May 2025). https://www.nber.org/system/files/working_papers/w33764/w33764.pdf
About this Study
This report was made possible through funding from Oak Foundation and the Charles and Lynn Schusterman Family Philanthropies, as well as our sister organization, the Thomas B. Fordham Foundation. The efforts of numerous individuals are reflected in it, foremost among them the authors, David Griffith and Brian Fitzpatrick. External advisers Kelly Butler and Kim Benton provided clear and thoughtful feedback on the draft report. Here at Fordham, we thank Chester E. Finn, Jr., Michael J. Petrilli, and Amber M. Northern for providing feedback on the draft, Stephanie Distler for managing report production and design, and Victoria McDougald for overseeing media dissemination. The views expressed are those of the authors alone and do not necessarily reflect those of the foundations that supported this work. The Thomas B. Fordham Institute retains sole discretion over the content of this report.