
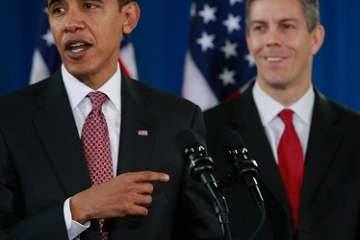
President Obama's meaningless pledge to reduce school tests
Over the weekend, President Barack Obama received high praise from parents and teachers for acknowledging that testing is taking too much time away from teaching, learning and fostering creativity in schools, and recommending that standardized tests take up no more than 2 percent of total school instructional time. Frankly, this is arrant nonsense.
From time to time, I'm asked to give a talk about education. If I look at how I spend my time over the course of a year, giving presentations and speeches is a very small part of my job—less than 2 percent. However, if my effectiveness were to be judged on the audience response to the handful of talks I give each year, I'd spend a lot more time writing and practicing speeches. I'd fret endlessly over my PowerPoint slides and leave-behinds. I'd sprinkle in more jokes to be entertaining; I'd probably say whatever I thought would get audiences to like me more, rather than challenging my listeners. I'd definitely spend a lot more on suits and dry cleaning than I do now.
But most critically, I'd spend far less time on all the other things I do—writing, reading, teaching and learning, visiting schools to stay current—that might make any talk I give worth listening to in the first place. In short, if this minor part of my job, however useful, were to become the alpha and omega of how my effectiveness was measured, it would quickly change nearly everything else about my work. And not necessarily for the better.
It's the same with testing. First of all, reports that Obama "plans to limit standardized testing to no more than 2 percent of class time," are simply wrong. The federal government has virtually no say about how much time schools spend testing. The vast majority of tests that our children take are driven by states and school districts, as well individual schools and teachers—not by Washington. The best the president can do is use the bully pulpit to encourage less testing, and even then, there's reason to be skeptical.
The amount of time kids spend on testing is not the issue. It's what the tests are used for that matters. Like my speech example, when you use standardized tests to make high-stakes judgments about schools and teachers, they are no longer a mere diagnostic. The testing tail wags the schooling dog.
"I still have no question that we need to check at least once a year to make sure our kids are on track or identify areas where they need support," said Education Secretary Arne Duncan, thereby demonstrating that the administration doesn't understand or thinks it can elide the effect of testing on schools. If there are stakes attached to those tests for schools or teachers, then there will be little or no change in current classroom practice.
To be clear, I am not anti-testing. Far from it: The data from tests are some of the most valuable intelligence we can access in the struggle to improve our education system. Test data have created the demand for school choice and charter schools. They supply the proof point demonstrating how poorly we've historically served low-income children of color. The field of education simply cannot advance without testing; it provides one of the few empirical bits of data we have to give insight into the effectiveness of changes in any number of school-based inputs, from curriculum to education technology.
But the moment you set out to trigger corrective actions and interventions using tests (which are, after all, designed merely to measure student performance), you are fundamentally shifting their function from providing evidence of student performance to something closer to the very purpose of schooling. This is precisely what has been occurring in our schools over the last decade or more. When parents complain about over-testing, what they are responding to is not the tests themselves—which take up a vanishingly small amount of class time—but the effects of test-and-prep culture, which has fundamentally altered the experience of schooling for our children.
The Obama talk on testing seeks to curry favor with parents and teachers (and their unions) while doing nearly nothing to change the fundamental role of testing and its effect on schooling. It's all well and good to "encourage" states, districts, and schools to limit testing. But as long as test-driven accountability measures are used trigger corrective measures in schools instead of providing feedback to parents and other stakeholders, it won't matter if children take two tests or two thousand; the effects will be the same. And here, Obama and Duncan are on the horns of a dilemma: Testing is retained in both the House and Senate versions of the Elementary and Secondary Education Act currently up for reauthorization. But if you do away with it, there will be hell to pay among key Democrat constituents worried (rightfully) about equal educational opportunity for minority children and families.
It is nearly irrational to be "anti-testing." Education cannot be a serious discipline without the sunshine created by testing data. But our present relationship with testing is like holding a wolf by its ears: We don't like it, but we can't let go. The president's—and Duncan's—remarks this weekend get us no closer to rectifying our relationship with testing.
Editor’s note: A slightly different version of this article originally ran in U.S. News & World Report.
Scott Olson/Getty Images News/Thinkstock

The administration wants it both ways on testing
President Obama and Secretary of Education Arne Duncan deserve credit for acknowledging this weekend that there’s too much testing in our schools today and that “the administration bears some of the responsibility.”
Indeed it does. That’s because its decision to condition ESEA flexibility on state adoption of teacher evaluation systems has not only raised the stakes of reading and math tests (making them less popular and potentially more damaging to the educational enterprise). It’s also led to a proliferation of tests in “non-tested subjects”—everything from P.E. to social studies and beyond—for the sole purpose of collecting data to judge teachers’ effectiveness.
Yet, as Matt Barnum argues persuasively at the Seventy Four, the feds aren't willing to actually fix this problem:
The new report did not capture a precise measure on what proportion of tests were required by teacher evaluation, but it does point out that many states have put in place new assessments “to satisfy state regulations and laws for teacher and principal evaluation driven by and approved by U.S. Department of Education policies.”
But an initial reading of the department’s guidance suggests it is sticking to these policies: “The Department will work with states that wish to amend (their federal) flexibility waiver … while still maintaining teacher and leader evaluation and support systems that include growth in student learning.” (emphasis added)
The problem the administration faces is that it is incredibly difficult to measure a teacher’s contribution to student growth in the absence of a standardized test.
The administration is committing a cardinal sin of policy making by demonstrating an unwillingness to acknowledge trade-offs. This is one of those instances in which you can’t have it all: Either you can reduce testing, or you can continue to demand test-based teacher evaluations in all subjects. It’s one or the other.
Contrast this approach with Ohio’s. Last year, State Superintendent Dick Ross published a report on the testing load in the state’s schools that showed strikingly similar results as the new Council for Great City Schools study. It found that about one-quarter of the testing in the Buckeye State was linked solely to the need for data for teacher evaluations in subjects other than math and reading. To his credit, Ross proposed that districts simply dump those tests. He made a choice, in other words.
Regrettably, the Ohio General Assembly did not go along with his recommendation—but for an understandable reason. Because of Ohio’s federal waiver, Buckeye State districts couldn’t just move to evaluations based on teacher observations and the like. If they had gotten rid of excess tests, they would have had to use reading and math scores to evaluate all teachers—gym teachers, art teachers, the whole crew. This is quite obviously inane, and it demands a change in federal policy.
The Obama administration is trying to have it both ways. It wants fewer tests but isn’t willing to give up on test-based teacher evaluations. Meaning that, alas, it has failed this test.
eabff/iStock/Thinkstock

The lost boys
- The plight of boys in school, and particularly boys from underprivileged backgrounds, is a story we’ve all gotten used to hearing about. Whether in our home state of Ohio or in international educational utopias like Finland, young men are lagging behind their female classmates in testing performance, high school graduation, college attendance, and a slew of disciplinary issues. The New York Times’s Upshot blog has an article on the academic gender gap that delves into the existing research to reach a distressing conclusion: The cumulative stress of all social hindrances, from domestic violence to parental absence to poverty, impose a greater toll on boys than girls. Although girls in every setting are more likely than boys to be adequately prepared for kindergarten (and less likely to rack up absences once they begin), their comparative edge grows much wider within deprived populations like immigrant and low-income families. With forces like this arrayed against them, perhaps it’s no wonder that these boys are underrepresented in selective high schools and colleges.
- Let’s take a moment to lavish some praise on a state whose merits are too seldom celebrated: Delaware. Last week, the First State became just the sixth state (wait, what?) to release detailed report cards on the quality of its teacher preparation programs. The assessments, which grew out of a comprehensive 2013 overhaul of Delaware’s teacher preparation sector, rate education schools on a 1–4 scale based on diversity and selectivity, how long program graduates spend teaching in the state, and how well those teachers’ students perform academically. The mighty Wilmington University and the University of Delaware earned top scores this year, although many smaller schools produced too few graduates to be fully assessed. The programs themselves aren’t too happy to be publicly grouped in tiers (imagine that), but teacher quality is way too important to go without vital data like these.
Promises and pitfalls of using NAEP data to assess states’ roles in student achievement
OK, everyone, back away from the ledge. With the release of NAEP data this week, the predictable deluge of commentary is well underway—mainly of the gnashing-of-teeth, rending-of-garments variety. NAEP may be the nation’s report card, but it is also the nation’s Rorschach test. Perception is in the eye of the beholder, and many see darkness and misery: “A Decade of Academic Progress Halts,” says the Los Angeles Times. “Student Score in Reading and Math Drop,” says U.S. News & World Report.
One of the frequent criticisms of NAEP punditry is “misNAEPery”—the sin of attributing fluctuations to particular policies, for example. One particularly virulent form of this fallacy—failure to account demographic changes in states over time—has become slightly less tenable this week, courtesy of this illuminating analysis by Matthew Chingos of the Urban Institute.
Not every state is the same. States with higher concentrations of black and Hispanic children, low-income families, and English language learners (ELLs) have a harder time rising to the top because they have more students mired at the bottom. But when you adjust for these demographic realities, a different NAEP emerges. There’s Massachusetts, still sitting pretty atop the tables. But Texas and Florida, states with higher concentrations of traditionally low-performing subgroups, suddenly look like standouts. Well-regarded high-fliers like New Hampshire, Minnesota, and Vermont begin to look fairly pedestrian, while curve-busting states like Mississippi, Louisiana, and New Mexico—though still low in absolute terms—strongly outperform their peers given where you’d expect states with their particular demographic mix to land.
Perhaps the bigger piece of news, and one that should give cheer in the face of the dismal NAEP results, is this: Between 2003 and 2013, NAEP scores in all fifty states have increased more than would be expected based on demographic shifts over that time period. In other words, with low-income kids and other challenging demographic groups making up an increasing share of the country’s K–12 population, it’s been great and surprising news that NAEP scores have increased. All other things being equal, we should have expected them to go down.
Although the adjusted figures allow for more meaningful comparisons between states, “they are still unlikely to reveal the causal impact of particular education policies,” Chingos warns. “There remain a number of unmeasured student characteristics and differences in non-education policies that could shed further light on these data,” he observes.
The report was published in anticipation of this week’s NAEP release; Chingos has rerun some of the data on the Urban Institute’s website. In all, it’s a fascinating contribution that makes the sin of misNAEPery slightly harder to commit. Or abide.
Now that we’ve seen NAEP through this new and pertinent set of lenses, I’m going to wait before opting to defenestrate. I suggest you do the same.
SOURCE: Matthew Chingos, “Breaking The Curve: Promises And Pitfalls Of Using NAEP Data To Assess The State Role In Student Achievement,” Urban Institute (October 2015).
Common Core's alignment with the 2015 NAEP math assessment
A new study by the NAEP Validity Studies Panel analyzes the alignment of the assessment’s 2015 Math Items (the actual test questions) for grades four and eight to the math Common Core State Standards (CCSS).
To do so, the panel enlisted as reviewers eighteen mathematicians, teachers, math educators, and supervisors who have familiarity with Common Core. This group classified all 150 items in the 2015 NAEP math pool for each grade as either matching a CCSS standard or not.
The reviewers determined that the Common Core and NAEP were reasonably aligned at both grade levels— not surprising, since CCSS writers had the NAEP frameworks at their disposal. Further, NAEP is by design broader than the CCSS and is supposed to maintain a degree of independence relative to the “current fashions in instruction and curriculum.”
Panelists found that 79 percent of NAEP items were matched to the content that appears in the CCSS at or below grade 4. The overall alignment of NAEP to CCSS standards at or below grade eight is even closer, 87 percent.
There is, however, variation in matches across content areas. In fourth grade, the least aligned content area was data analysis, statistics, and probability, in which only 47 percent of the NAEP items matched a Common Core Standard. There’s also little agreement between the CCSS and NAEP when it comes to algebra and geometry. For example, just over half of all third- and fourth-grade CCSS standards in the algebra domain have at least one NAEP item aligned to it.
The authors say that it’s been ten years since NAEP conducted a review of its math framework (a framework that is rather mediocre by our estimation) and recommend that they do so in light of both the Common Core and other college- and career-ready standards. But not so fast. Should we open that can of worms if independence is indeed prized—especially when the alignment between the two is already pretty high?
SOURCE: Phil Daro, Gerunda B. Hughes, and Fran Stancavage, “Study of the Alignment of the 2015 NAEP Mathematics Items at Grades 4 and 8 to the Common Core State Standards (CCSS) for Mathematics,” American Institutes for Research (October 2015).
Public charter schools must become even more innovative
Although the charter sector has grown rapidly in both size and quality in recent years, there are still myriad issues holding it back from substantially improving public education. Most worrisome is the way charters have begun to resemble the district schools they were designed to differ from. In this new paper, the Mind Trust teams up with Public Impact to shine a light on how the sector can embrace its innovative roots in order to improve. The report outlines three key ideas: The sector must get better (slightly edging out traditional public schools isn’t good enough); the sector must get broader (underserved groups like at-risk students, special education students, English language learners, and students in rural communities still aren’t served effectively by charters); and bigger (approximately one million students are currently on charter waiting lists nationwide). The authors emphasize that creative thinking and innovation are the only ways forward in accomplishing these goals. Trying the same old things on new student groups, working harder instead of smarter, and failing to find more effective and sustainable ways to operate won’t expand the impact of charters. Instead, they will only deepen their similarity to traditional schools.
To achieve break-the-mold results, stakeholders will need break-the-mold innovations. The report offers recommendations and parses them out according to four stakeholder categories: school operators, policy makers, city-based education organizations, and funders. Perhaps unsurprisingly, the recommendations for school operators are the most detailed. The authors advise them to invest in new school models that innovate in the realm of student experience, as well as the use of time, space, and personnel. These new models could come from start-up organizations, existing high-flyers, or collaboration between the two. Operators can also embrace innovation by making ambitious improvements to existing models. The report recommends adjustments to facility use and facility funding; investing in taking over failing schools rather than planting new ones; rethinking startup economics by opening entire schools at once rather than phasing in by grade; backfilling vacant spots; and sharing school functions like administrative and finance work across networks.
For policy makers, supporting innovation includes funding charters equitably, permitting high-performers to expand, and setting (and acting on) high performance expectations. City-based education organizations can advocate for policies that support innovation; facilitate connections between new models, existing schools, and local leaders; offer planning funds; attract talent; and support small-scale pilots. For funders, the recommendation is simple and straightforward: Invest in new and innovative models, even if it means taking a risk.
The risk factor, of course, is what will ultimately determine whether stakeholders heed this report’s mostly solid recommendations. Considering that charters were founded because of a need for something different from traditional schools, one can only hope that stakeholders show greater willingness to innovate. Otherwise, we may end up with a pair of traditional—and struggling—school systems.
SOURCE: “Raising the bar: Why public charter schools must become even more innovative,” The Mind Trust and Public Impact (October 2015).