Mobile Navigation

  • National
    • Policy
      • High Expectations
      • Quality Choices
      • Personalized Pathways
    • Research
    • Commentary
      • Gadfly Newsletter
      • Flypaper Blog
    • Events
    • Scholars Program
  • Ohio
    • Policy
      • Priorities
      • Media & Testimony
    • Research
    • Commentary
      • Ohio Education Gadfly Biweekly
      • Ohio Gadfly Daily
  • Charter Authorizing
    • Application
    • Sponsored Schools
    • Resources
  • About
    • Mission
    • Board
    • Staff
    • Career
Home
Home
Advancing Educational Excellence

Main Navigation

  • National
  • Ohio
  • Charter Authorizing
  • About

National Menu

  • Topics
    • Accountability & Testing
    • Advanced Education
    • Career & Technical Education
    • Charter Schools
    • Curriculum & Instruction
    • ESSA
    • Evidence-Based Learning
    • Facilities
    • Governance
    • Personalized Learning
    • Private School Choice
    • School Finance
    • Standards
    • Teachers & School Leaders
    • Think Again
  • Research
  • Commentary
    • Gadfly Newsletter
    • Flypaper Blog
    • Gadfly Podcast
  • Events
  • Scholars Program

The Education Gadfly Weekly

Sign Up to Receive Fordham Updates

We'll send you quality research, commentary, analysis, and news on the education issues you care about.
Thank you for signing up!
Please check your email to confirm the subscription.

The Education Gadfly Weekly: The “science of reading gap”

Volume 26, Number 17
4.30.2026
4.30.2026

The Education Gadfly Weekly: The “science of reading gap”

Volume 26, Number 17
view
A teacher's desk
High Expectations

The “science of reading gap”

In recent years, states and districts have made a concerted effort to align early elementary school instruction with “the science of reading.” But how much progress has actually been made? To find out, Fordham researchers David Griffith and Brian Fitzpatrick analyzed results from a nationally representative survey of K–3 teachers that examined their knowledge of reading science and its relationship to the policies that shape instruction. One disturbing finding: Teachers in high-poverty schools appear less committed to the science of reading than their peers.

Amber M. Northern, Ph.D., Michael J. Petrilli 4.30.2026
NationalFlypaper

The “science of reading gap”

Amber M. Northern, Ph.D. | Michael J. Petrilli
4.30.2026
Flypaper

Accommodations are a concern, but don’t blame parents

Miriam Kurtzig Freedman
4.30.2026
Flypaper

When helping hurts: Rethinking special education accommodations

Daniel Buck
4.30.2026
Flypaper

Caught up in the machine: How employee hiring processes impact teacher and principal diversity

Jeff Murray
4.28.2026
Ohio Gadfly Daily

Minimum pay, maximum impact: Arkansas’s teacher retention strategy

Elainah Elkins
4.30.2026
Flypaper

A Science of Reading reality check: Not there yet | Episode 1015 of The Education Gadfly Show

4.29.2026
Podcast
view
Standardized test

Accommodations are a concern, but don’t blame parents

Miriam Kurtzig Freedman 4.30.2026
Flypaper
view
Student taking test

When helping hurts: Rethinking special education accommodations

Daniel Buck 4.30.2026
Flypaper
view
CALDER teacher principal diversity SR image

Caught up in the machine: How employee hiring processes impact teacher and principal diversity

Jeff Murray 4.28.2026
Ohio Gadfly Daily
view
Teacher in classroom

Minimum pay, maximum impact: Arkansas’s teacher retention strategy

Elainah Elkins 4.30.2026
Flypaper
view

A Science of Reading reality check: Not there yet | Episode 1015 of The Education Gadfly Show

Michael J. Petrilli, David Griffith, Ph.D., Brian R. Fitzpatrick, Ph.D., Amber M. Northern, Ph.D. 4.29.2026
Podcast
view
A teacher's desk

The “science of reading gap”

Amber M. Northern, Ph.D. | Michael J. Petrilli
4.30.2026
Flypaper

Formal reading instruction in the United States predates our nation’s founding. Published in the 1680s, The New England Primer—the nation’s first major schoolbook—included spelling and sounding-out exercises that modern science of reading advocates would readily identify as early phonics instruction.

But it was the late nineteenth-century psychologist Edmund Huey who established the roots of the “science of reading” (SoR). Using rudimentary mechanical devices to measure eye movements, he showed that the act of reading was not a smooth process but rather a series of “rapid eye jumps and pauses,” reflecting the complex mental processes involved in decoding and comprehension.

In the decades that followed, a procession of influential scholars—including Edward Thorndike, Rudolf Flesch, Jeanne Chall, Keith Stanovich, and Marilyn Jager Adams—built an empirical foundation on how children learn to read. And in 2000, the National Reading Panel synthesized the best evidence and the takeaways for classroom implementation.

Yet this long research tradition has not produced uniform understanding or practice in today’s literacy classrooms. Instead, we’ve experienced significant bumps, detours, and even reading “wars,” as advocates of effective reading instruction have struggled to make their voices heard.

In 2022, Emily Hanford’s podcast series, Sold a Story, initiated a fresh wave of concern and advocacy, and state and local policies meant to improve reading instruction have proliferated in response. (At least 40 states and counting have enacted science of reading laws.) Whether these efforts ultimately succeed depends in large part on how clearly and consistently they are understood, supported, and enacted by teachers.

To learn more about that, we conducted a nationally representative survey of America’s K–3 reading teachers, with the twin goals of assessing their knowledge of reading science (via a short quiz embedded in the survey) and connecting those results to specific and ongoing “SoR” state implementation efforts. Fordham’s David Griffith and Brian Fitzpatrick co-led the analysis that resulted in our new study, From the teacher’s desk: A science of reading progress report.

Here are their four big findings:

First, at least a third of teachers in high-poverty settings aren’t fully committed to the science of reading.

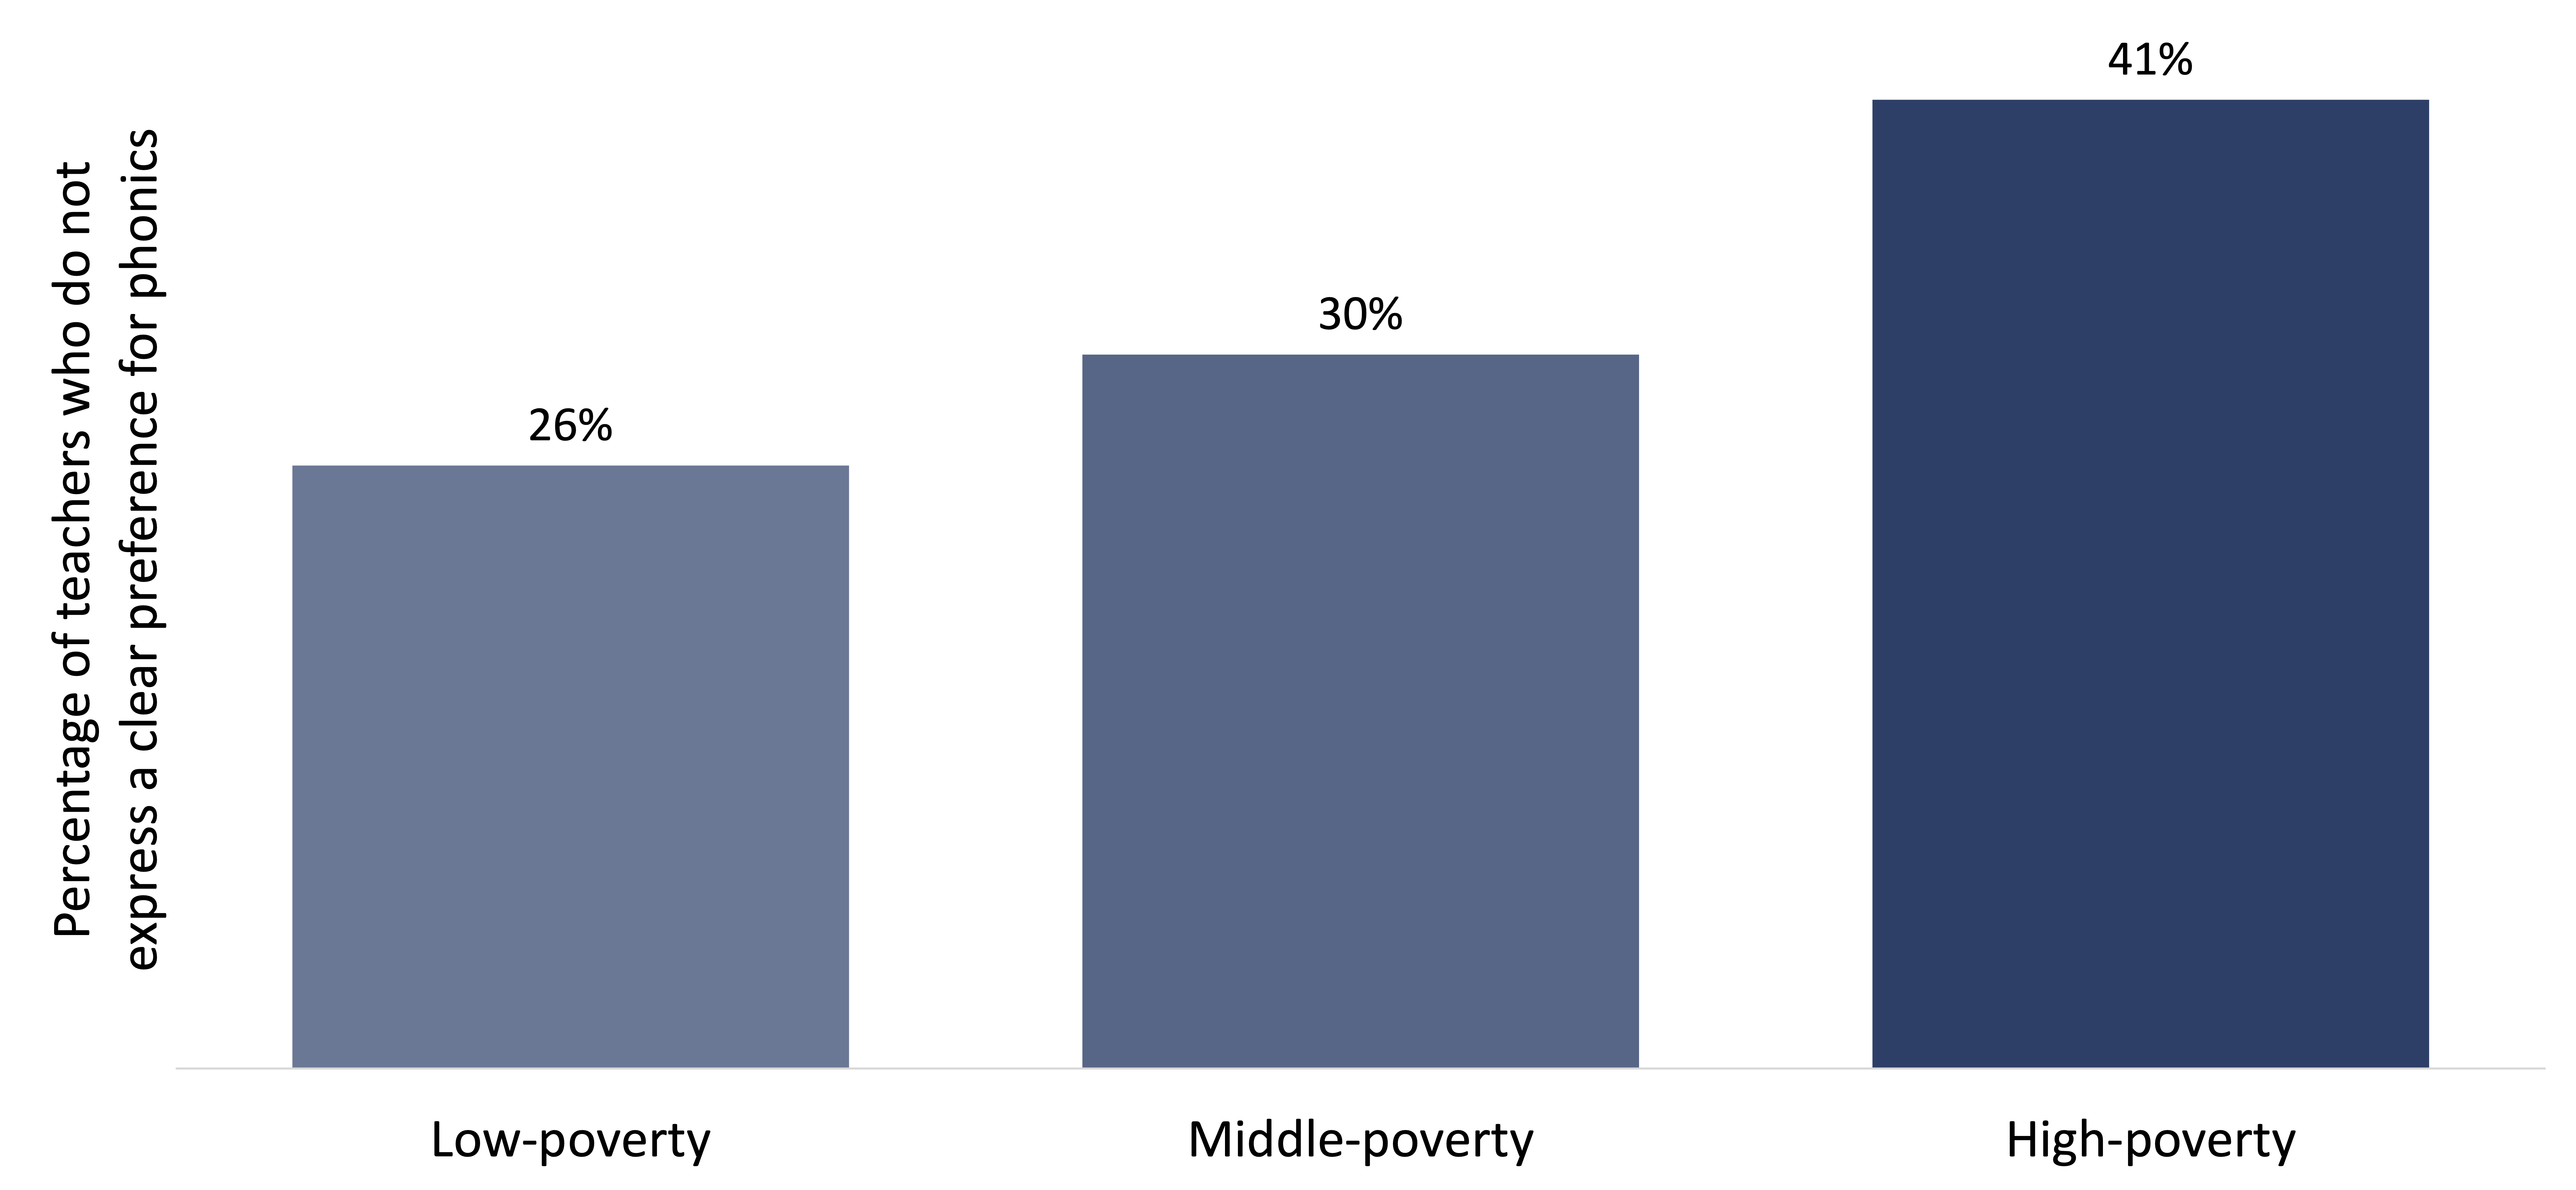
For example, when given the choice between a phonics-based approach to reading instruction and “cueing”—a discredited practice that encourages guessing instead of systematic decoding—a disquieting 41 percent of K–3 teachers in high-poverty settings did not express a clear preference for phonics (Figure F-1).

Figure F-1. Teachers in high-poverty settings are more likely to express ambivalence about phonics-based instruction.

Figure F-1. Teachers in high-poverty settings are more likely to express ambivalence about phonics-based instruction.
Note: Survey question: “Do you generally favor the use of phonics (i.e., encouraging students to sound out words) or cueing (i.e., encouraging students to use context clues) when teaching?” The percentages shown include teachers who chose “cueing,” “both equally,” or “neither” rather than “phonics.” This question is based on a similar question from Fordham’s 2025 report, Ohio’s path to early literacy: Science of Reading progress and challenges.

Second, teachers who rely on their preservice training know less about the science of reading than teachers who receive in-service training.

In fact, while receiving science of reading–aligned professional development is associated with more knowledge of reading science, preservice emphasis on the science of reading is associated with less knowledge of the topic (Figure F-2). In other words, whatever literacy instruction teachers receive in schools of education may be actively harmful to their understanding of evidence-based practices.

Figure F-2. In-service literacy training is associated with more knowledge of reading science, while preservice literacy training is associated with less knowledge.

Figure F-2. In-service literacy training is associated with more knowledge of reading science, while preservice literacy training is associated with less knowledge.
Note: Survey question: “How much emphasis has your professional development/preservice program put on the science of reading?” *Indicates statistically significant difference at the 95 percent confidence level. Peach-colored bars (“None”) indicate the reference categories. Quiz scores range from zero to eight.

Third, teachers in states with science of reading–aligned licensure tests have a firmer grasp of reading science.

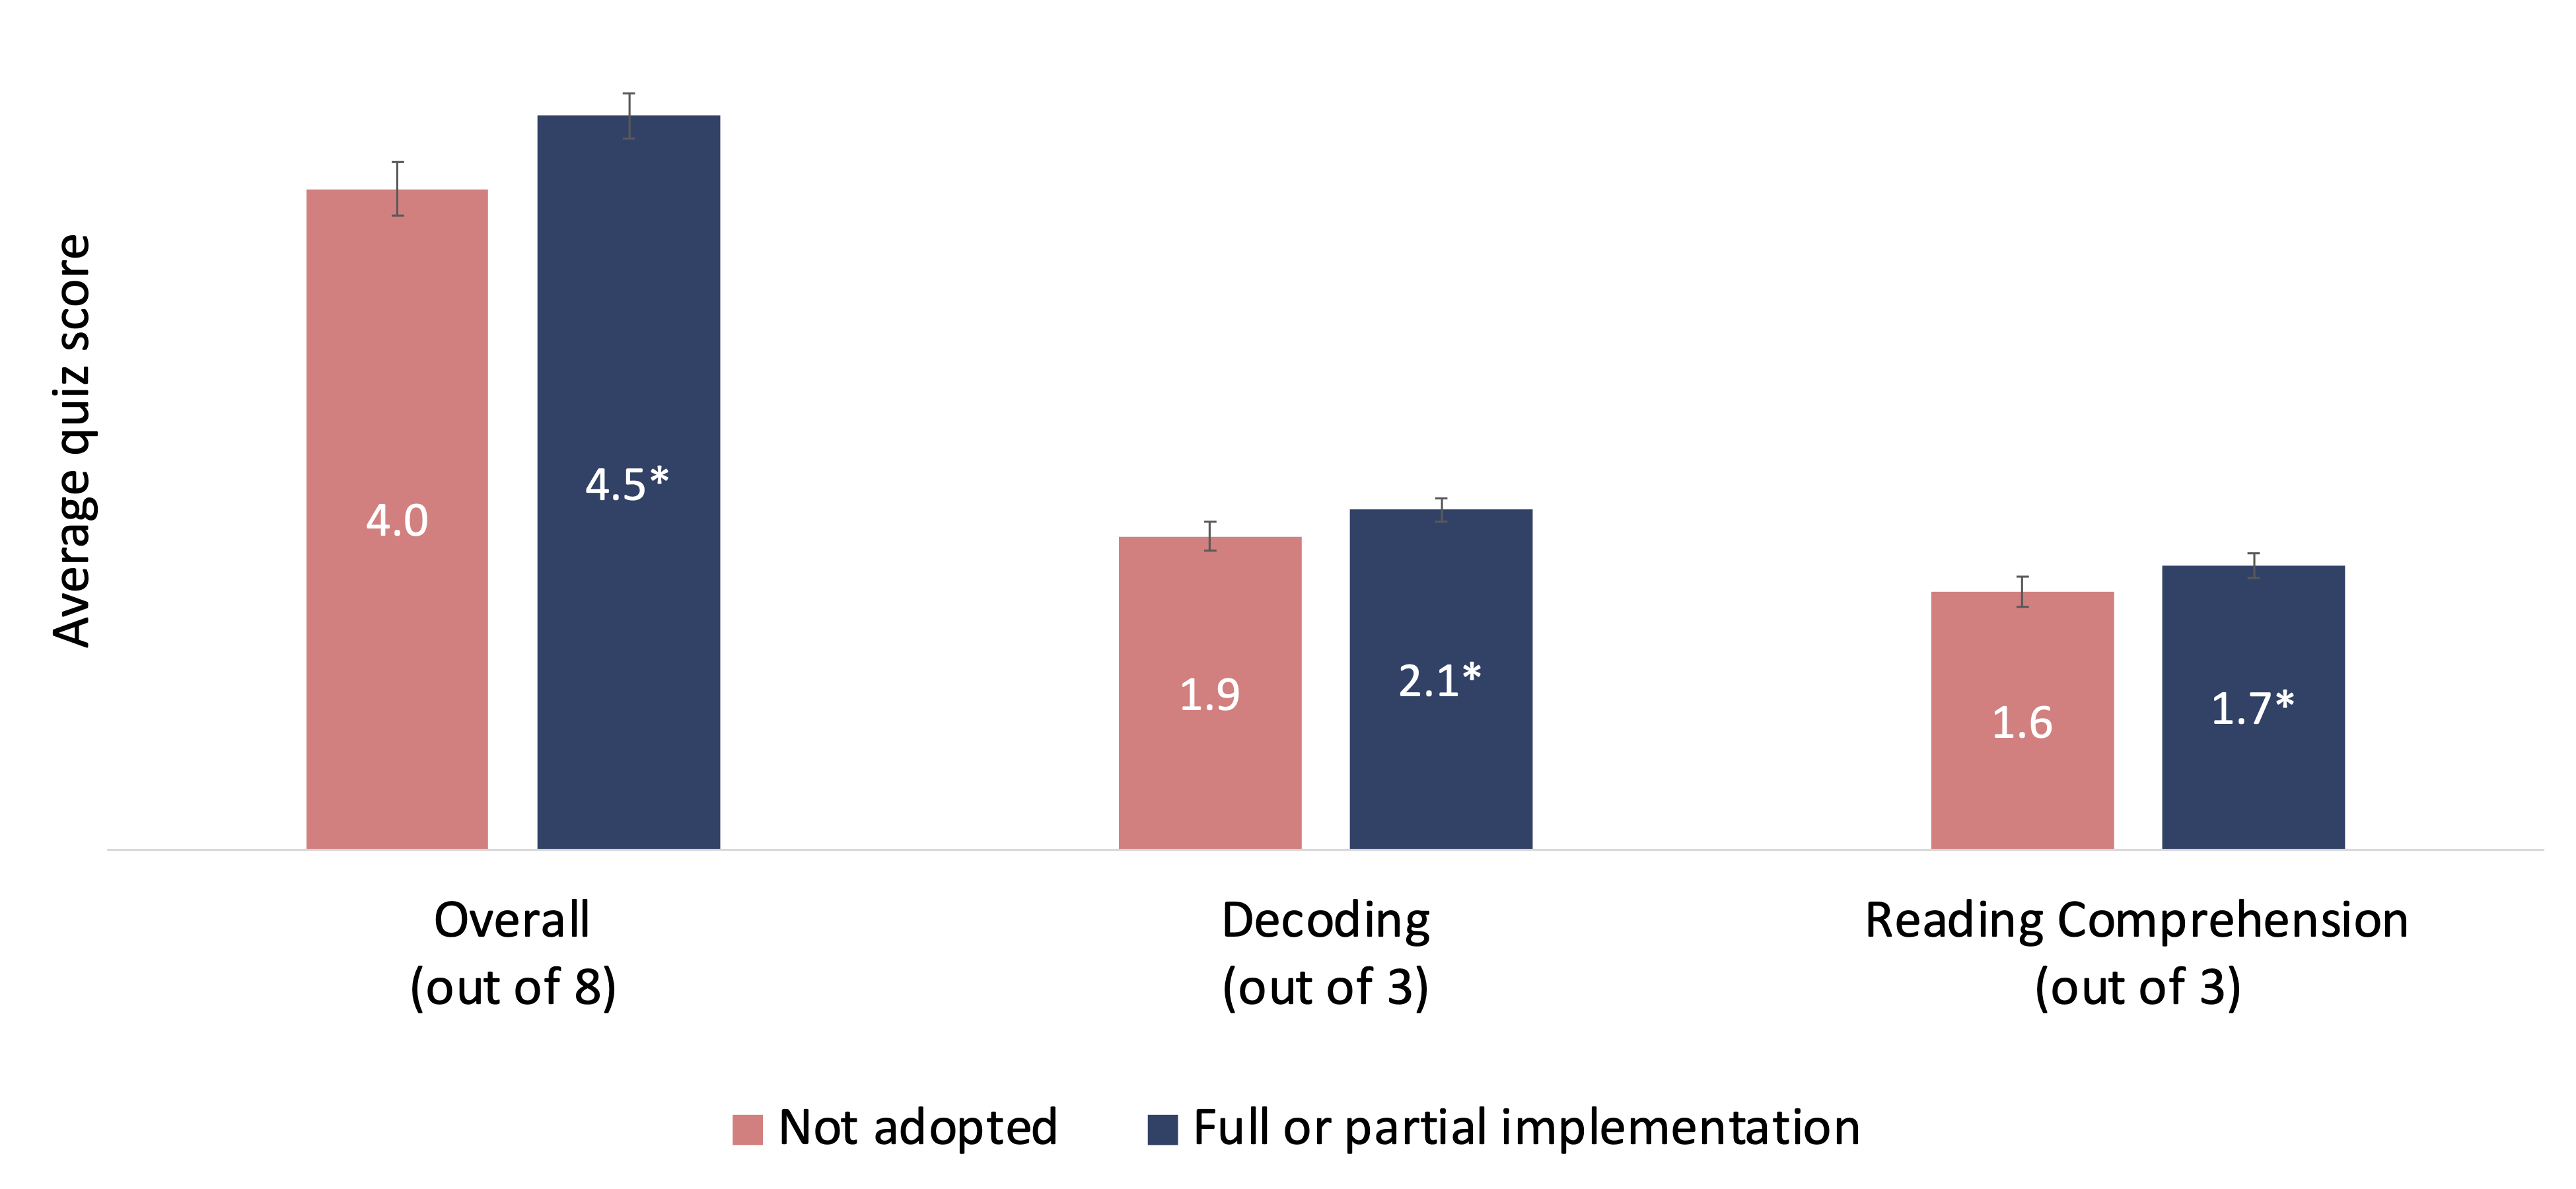
Of the 18 state reading policies we examined, only one—requiring an initial licensure test aligned with the science of reading—is associated with deeper understanding of that science (Figure F-3). Like the previous finding, this one suggests that improving the quality of preservice preparation is perhaps the most fundamental challenge.

Figure F-3. Teachers in states with science of reading–aligned licensure tests have a firmer grasp of the science of reading.

Figure F-3. Teachers in states with science of reading–aligned licensure tests have a firmer grasp of the science of reading.
Note: *Indicates statistically significant difference at the 95 percent confidence level. Peach-colored bars (“Not adopted”) indicate the reference categories.

Finally, many teachers are still using questionable reading curricula.

For example, despite facing criticism for their continued inclusion of three-cueing and other unscientific methods, Benchmark Advance and Fountas & Pinnell are still used by 19 percent and 16 percent of teachers, respectively—though in better news, the most popular reading curriculum in America is now the well-regarded UFLI (University of Florida Literacy Institute) Foundations (Figure F-4).

Figure F-4. The most popular reading curriculum among K–3 teachers is University of Florida Literacy Institute (UFLI) Foundations.

Figure F-4. The most popular reading curriculum among K–3 teachers is University of Florida Literacy Institute (UFLI) Foundations.
Note: Survey question: “Please select the 2–3 instructional materials in each row and column that you rely on to teach ELA skills.”

Encouragingly, the survey data show that teachers who use UFLI tend to know more about the science of reading than the rest of the sample, as do teachers using CKLA-Amplify. In contrast, teachers who use Benchmark, Fountas and Pinnell, and i-Ready (the nation’s second most popular reading curriculum) tend to be less knowledgeable than their peers.

Based on these findings, our Fordham colleagues urge states to take four steps:

  1. Require colleges of education and other teacher preparation programs to provide instruction aligned to the science of reading.
  2. Require that K–3 teacher licensure exams include comprehensive knowledge of the latest reading science.
  3. Require every K–3 teacher to complete at least one science of reading training in their first 2–3 years on the job.
  4. Require districts to choose a science of reading–aligned curriculum from a state-approved list in grades K–3.

We wholeheartedly agree with these recommendations and would add one more to the list: policymakers and other stakeholders must do everything in their power to address the emerging science of reading gap.

On average, the survey data suggest that teachers in low-poverty schools are at the 54th percentile of science of reading knowledge and commitment, while those in high-poverty schools are at the 44th—a substantial difference that will have dire consequences for poor students should it persist.

Unfortunately, we can’t say with certainty why this gap exists. For example, despite exhibiting less knowledge of reading science, teachers in high-poverty schools report more exposure to science of reading–aligned trainings such as LETRS (37 percent versus 27 percent) and CKLA (16 percent versus 8 percent) than teachers in low-poverty schools. Similarly, they are more likely to report using the CKLA-Amplify curriculum (27 percent versus 17 percent) – though they are also more likely to use i-Ready (42 percent versus 31 percent), which is generally associated with less knowledge of reading science.

Collectively, these patterns don’t suggest a single, straightforward explanation. But they do highlight the fragmented nature of curriculum adoption and the complexity of translating exposure to science of reading–aligned training into better practice in high-poverty schools. And by that measure, there is still considerable ground to cover.

To be clear, we’ve made real progress in recent years, so the challenge now is to use what we’ve learned to keep moving forward. To us, that means a sustained focus on the things that matter most: stronger preservice programming, deeper professional development, more coherent curricula, and implementation supports that reflect local realities—especially where the need is greatest.

Read the report:

From the Teacher’s Desk: A Science of Reading Progress Report

By David Griffith and Brian Fitzpatrick

view
Standardized test

Accommodations are a concern, but don’t blame parents

Miriam Kurtzig Freedman
4.30.2026
Flypaper

When 20 percent of Harvard and Brown students and 38 percent of Stanford’s are eligible for accommodations even as just 3–4 percent of students in community colleges are, we have a crisis of trust in testing, fairness, and equity. Designed to be rare, accommodations now seem to be given out like candy, especially to those who know how to press for them—mostly the wealthy. Where are the defenders of academic standards, equality of opportunity, and valid assessment? While much discussion centers on elite colleges, the situation is similar in the K–12 arena.

Accommodations are intended to level the playing field for students with disabilities. They change how students access instruction or demonstrate knowledge or skills. Properly administered, testing accommodations provide equitable access without—here’s the key—fundamentally altering the substance of what is taught or tested.

Common examples of testing accommodations include extended time, large print, and quiet testing rooms. Extra time is, by far, the most commonly used—and controversial—accommodation.

While the law requires reasonable accommodations, it does not require fundamentally altering a test or lowering standards. For many years, a “flag” placed on score reports informed readers (e.g., admissions officers, parents) that a test was taken with extended time such as time and a half, twice the time, or more—a practice long approved by the courts. Otherwise, a test reader could not know whether scores of two candidates are comparable, as there is no way to know if they took the test under the same standard conditions. For reasons explained below, flags have not been used on the SAT, ACT, and many other tests since 2003. As a result, test users’ ability to assess the meaning of test results and to make fair and reasonable decisions for all students has been compromised. 

How did we get here? Two catalysts stand out. The 1990 Americans with Disabilities Act and later amendments broadened the definition of disability to include more people. And as part of a 2002 settlement of a threatened lawsuit by Disability Rights Advocates, which claimed that the College Board’s flagging practice on its standardized admissions tests discriminated against students with disabilities, the Board agreed to stop flagging its score reports altogether.

It’s important to remember that the flag described the score, not the student. Seventy-nine percent of college admissions officers at the time opposed the Board’s change. Yet within two weeks, the ACT followed suit. By 2003, these and many other tests stopped using flags. I warned then that this settlement would increase the use of accommodations and erode trust in standardized testing. It has.

Standardized tests derive their legitimacy and validity from their standardization, making results comparable among test takers. Test validity requires that tests actually measure what they purport to measure and report results accurately. Before 2003, these tests were designed to measure student performance on timed tests. If test results are skewed by extra time, an accommodation that may affect results, those results are no longer comparable to other test takers’ results. Note, though, that other sorts of accommodations—such as large print or a quiet room—do not raise issues of comparability or validity.

Research has shown that giving students, whether they are disabled or not, extra time for standardized tests tends to raise their scores. This is especially so among medium- and high-ability students who are vying for entrance to elite institutions. Hence administering tests like the SAT or ACT, which are designed to be timed tests, with extended time for some people but not others creates a different test. It obscures fair and reliable comparisons between standard and nonstandard test administrations. What if we gave some runners more time to run the “four-minute mile?” That, too, would be a different race.

Over these last two decades, the increased use of accommodations and unflagged test results has contributed to compromised standards in our schools and questionable test results. Interestingly, we’ve seen that most colleges no longer require either of these “college entrance” exams.

While much of today’s attention and hand-wringing is focused on students and parents who request accommodations, I believe the focus should be elsewhere—on the standards and tests themselves. As a school attorney, I was often asked if parents or students were abusing accommodations. In my view, that is not the issue. As I see it, if test makers, schools, and evaluators offer a “benefit,” why blame people for availing themselves of that benefit? I believe that the central failing lies with test-makers, schools, evaluators, etc.—the institutions and professionals that are supposed to build and administer valid tests and set standards.

It’s obviously easier to say yes to a student or parent who requests extra time than to say no and face their ire or a threatened lawsuit. Yet, those yeses end up undermining valid tests. The loss of reliable and valid test results is worrisome in many ways, as we the public and test users (like educators, parents, students themselves, and admissions officers) rely on institutions to uphold standards that individuals can’t on their own.  Ultimately, without valid standards, we lose faith and trust in the system. And here we are.

I suggest three options to return to comparable and valid test reporting.

The first option is for tests to allow as much time (within practical constraints) as test takers need or wish to take. This option makes clear that a test’s design and purpose is not based on time constraints and that its results will be standardized, comparable, and valid. For example, such tests would not evaluate the speed with which test takers work, how they fare under pressure, and their knowledge fluency—that is, if they can apply knowledge quickly and automatically. If that is so, no one needs that extra time accommodation!

The second option—which may be uniquely attractive in this era of choice and personalized learning—lets all test-takers choose how they wish to take a test. They can take the test within standard time limits and have their results unflagged or take it with extended time and have their results flagged. Presumably, test takers who have test anxiety or are poor test takers—whether disabled or not, including those who choose not to use the accommodations offered to them—will choose this option. This option undercuts the discrimination claim, as flags will not identify students with disabilities.

The third option reverts to the pre-2003 approach for test takers and score reports. Flags were used to notify test users that a test was taken with extended time due to accommodations.  As discussed above, this arrangement was abandoned by many test makers almost a quarter of a century ago.

Today’s national conversation about accommodations suggests a growing unease with their apparent overuse in many communities. Even with good intentions, this situation erodes standards, fairness, trust, and notions of excellence. In compounding the advantage of privileged families, it also appears to worsen equity, as the use of accommodations is highest for students at elite institutions and not widely used by others.

The goal of any of these options is to restore test comparability and validity—key elements of standardized testing and the reason we bother with these tests in the first place.

If we want to restore confidence in standards in schools and standardized tests, we must be willing to establish, defend, and protect them. Why aren’t we? Regarding standardized testing, where are today’s defenders of valid tests, fairness, equity, and honesty? The powerful institutions in the testing arenas—test makers, schools, colleges—that are expected to create and uphold valid testing programs need to reassert their responsibility. Once they do so, we can again have confidence that score reports are comparable and valid, bring accommodations use back to credible levels, and restore trust in those assessments.


view
Student taking test

When helping hurts: Rethinking special education accommodations

Daniel Buck
4.30.2026
Flypaper

We need to talk about accommodations. Like puppies or grandma’s cookies, they are treated as unmitigated goods—at least in my experience. Should we not support all students? Should we not provide differentiated instruction? Who in their right mind could oppose offering accommodations, leveling the playing field, and helping students with special needs?

In the media, a dash of skepticism has breached the surface. In an essay for The Atlantic, Rose Horowitch reported on how “students with disabilities” now more often entails “rich kids getting extra time on tests” than “kids in wheelchairs,” which puts “the entire idea of fairness at risk.” At elite universities and law schools, upwards of forty percent of students now qualify for accommodations, and an increasing number for mental health issues such as anxiety or depression.

Reflecting on a similar situation at the high school level, The Wall Street Journal’s Emma Camp argued that “When a third of a high school’s students count as ‘disabled,’ the definition of disability has grown so broad as to become nonsensical.”

Without getting into fights over the fairness of accommodations or the veracity of diagnoses, I want to ask a question about how accommodations affect the students who receive them. Do they actually help?

In a compelling article, “Enabling or disabling: Observations on changes in special education,” the late scholar of special education James Kauffman expressed a similar concern that providing accommodations “is not always in the students’ best long-term interests.” Indeed, accommodations too often amount to “freedom from expectations of performance” that can “set that same student up for failure later in life.”

He runs through the list of popular accommodations. More time on tests or extensions on assignments can enable avoidance tactics, which in turn means assignments pile up, the student gets further behind and struggles to comprehend current content. Reading aloud “can be beneficial” but well-meaning proctors may read with inflection, define vocabulary, or provide extemporaneous explanations. Changing tests to open-notes or open-books “breaches good-faith test proctoring.” Scribing for a student can also be useful but a teacher should ensure they only scribe what the student says (with no corrections) and ultimately encourage students who are able to master writing for themselves.

“‘Saving’ a child from his or her own negative behavior,” Kauffman explains, “reinforces that behavior and makes it a self-fulfilling prophecy,” and both parents and teachers confuse making life easier with making it better.

As one concrete example, I had a student whose grades began to slip as classwork got harder in middle school. He didn’t complete his homework, didn’t study, made no use of his planner, and never took notes. He usually spent class time disassembling pens and doodling. Even before requesting an IEP, his parents always sought more and more support—extra time on tests, teacher assistance filling out his planner, regular notebook checks, and other such assistance—while his teachers thought that he needed to feel the pressure of poor grades.

I do not have the pedigree to diagnose whether he had ADHD or a learning disability. But I do question whether accommodations would have helped him in the long run. Cognitively, he could perform, but his habits kept him back. Extensions, extra time, and extra assistance meant he could continue with poor organizational habits, inattention, and reliance on adults to save the day. What incentive is there to try hard the first time—or at all for that matter—so long as he receives such supports?

There are some policy tweaks that can flow from this analysis. I would point readers to Miriam Freedman’s excellent writing on the topic in Fordham’s own pages: curtail the overdiagnosis of students with mild or moderate needs, focus on outputs instead of inputs, and remove the litigious nature of the law that sets parents against teachers.

But first, a change in perspective is requisite. With regard to more severe behaviors, we accept how “helping” someone can do long-term harm. The financial provision of a doting parent can bankroll the destructive behaviors of their adult child, for example.

While academic behaviors and their subsequent consequences are less severe, the same principle applies. When overapplied, they only foster the very behaviors that got students poor marks in the first place, thereby getting them a higher grade in the short term but doing them a disservice in the long term.

That’s not to say we do away with all accommodations. A fierce critic, Kauffman acknowledges there are obvious supports that students with severe disabilities need—braille for blind students, preferential seating for students who are hard of hearing, or dictation devices—and even the more controversial examples have a place. For example, “if a student is clearly working hard, then extensions may be appropriate,” he writes.

But in every IEP meeting, there needs to be an acknowledgement that there’s a negative side to accommodations.

view
CALDER teacher principal diversity SR image

Caught up in the machine: How employee hiring processes impact teacher and principal diversity

Jeff Murray
4.28.2026
Ohio Gadfly Daily

Efforts to broaden the demographics of the U.S. teaching force have yielded change, but more remains to be done to better reflect the diversity of the student body. A group of researchers led by Dan Goldhaber from the American Institutes for Research and the University of Washington suspect that multi-layered hiring processes may introduce heretofore unstudied points of friction. Their recent working paper digs into the question.

The researchers’ main data source is a company called Nimble Hiring, which provides recruitment, candidate screening, job offers, contracting, and onboarding services for dozens of education providers in several U.S. states. These include preschools and private schools, but the present study utilizes only data from public K-12 education providers (18 traditional districts and 24 charter school networks) that contract with Nimble. No geographic data is provided on where these are located, although Nimble’s website only lists five states in which they work.

Goldhaber and team combine these data with publicly-available organizational and demographic characteristics via the Common Core of Data. Their records cover job postings and applications for both teachers and principals from January 2019 through September 2024. They standardize the hiring process into four stages: (1) initial screening by central HR, (2) application made visible to school-level personnel, (3) engagement with school-level personnel (e.g., interviews), and (4) job offer. They then track all applicants through these stages, looking to see how the racial composition of applicants changes as candidates advance (or not) and how those advancement patterns vary across organizations with different characteristics (e.g., student demographics).

The findings start with applicant demographics. Sixty-three percent of teacher applicants were female, and female applicants were hired at significantly higher rates than males. The teacher applicant pool was more racially diverse than the teacher workforce in general, with 35.6 percent identifying as one of several underrepresented groups (specifically, Black, Hispanic, or Native American). However, White applicants were significantly overrepresented among applicants with offers (41 percent of all applicants, but 52 percent of applicants with job offers) and Asian applicants were significantly underrepresented (13.7 percent of all applicants, but only 5.7 percent of those with offers). Black applicants are slightly underrepresented among candidates with offers and Hispanic applicants are slightly overrepresented.

While the demographics of principal applicants were similar to those of teachers—also more diverse than the principal workforce in general—hiring patterns for principal positions were somewhat different. Black applicants maintained roughly proportional representation (34.2 percent of offers versus 33.6 percent of applicants), White applicants were slightly underrepresented among those receiving offers, Asian applicants were significantly overrepresented (only 2.7 of all applicants, but 5.6 percent of offers), and Hispanic applicants were slightly overrepresented.

For the most part, with respect to teacher hiring, the early screening stages appeared to be responsible for the majority of these job offer disparities. Black and other non-White applicants were significantly less likely to advance through each of the first three stages of the hiring process than their White peers. However, once they did so and were engaged at the school level (such as being invited for an interview), White and non-White applicants were equally likely to receive a job offer. Hispanic applicants appeared to be particularly disadvantaged at the second stage of the hiring process (when applications were made visible to school-level personnel), while Asian applicants were significantly less likely than their peers to advance at all four stages. Female applicants were more likely to advance at each of the first three stages than their male peers, but were equally likely to get job offers once engaged by school personnel.

The researchers saw no statistically significant relationship between non-White and White principal applicants and their overall likelihood of receiving a job offer at any stage. However, the analytical sample of jobs is far smaller than for teachers, so these findings need to be taken with a grain of salt. Female principal applicants showed a small but statistically-significant higher likelihood of receiving a job offer than their male peers.

Finally, Goldhaber and his team also found that organizations with higher proportions of underrepresented minority students were more likely to hire Black and Hispanic applicants overall—both teachers and principals. Charter schools particularly were more likely to hire non-White teacher applicants.

The researchers explain that the mechanisms at work are nuanced. Nimble’s recruiting system does not require racial/ethnic demographic information from any applicant, and any such detail voluntarily provided (say, via a personal essay) is not revealed to non-HR personnel until stage three. They conclude, then, that disparities observed in the first stage are likely driven by a mix of candidate preferences or actions (such as withdrawing an application after submission) and what they term “coarse” screening methods used to winnow down a large number of submissions. In the second stage, nearly all decisions—and the disparities that result—are driven by HR screening processes which likely include a mix of electronic and human-centric reviews. “At this point,” they write, “either screening instruments [the schools] use are biased, implicit or overt human bias operates, or job-relevant factors excluded from our analysis but correlated with race differ.”

That’s the bad news. The good news is that the final stages, when candidates interact with non-HR school personnel, show minimal disparities. All of which means that schools looking to diversify their teacher and principal workforce must focus on refining their earliest screening processes to make sure that no particular racial or ethnic group is being disproportionately caught up in the machine.

SOURCE: Dan Goldhaber et al., “School System Selection Processes and Workforce Diversity in Schools,” CALDER Working Paper (February 2026).

view
Teacher in classroom

Minimum pay, maximum impact: Arkansas’s teacher retention strategy

Elainah Elkins
4.30.2026
Flypaper

Teacher pay has become a big contender in the education reform space, with growing agreement that paying educators a livable wage is essential to building a strong, stable workforce. At the same time, policymakers continue to grapple with a related challenge: how to retain effective teachers. A new study brings these two strands together, examining how a statewide minimum salary policy shapes teacher retention and offering fresh insight into whether boosting baseline pay can help schools hold on to the talent they need most.

In 2023, Arkansas passed the LEARNS Act, a comprehensive education law that included reforms ranging from Educational Freedom Accounts for private school tuition to literacy requirements. Importantly, it also effected three major teacher salary changes: raising the minimum statewide teacher salary from $36,000 to $50,000, guaranteeing all teachers a minimum raise of $2,000, and allowing school districts to deviate from a traditional seniority-based salary schedule.

To study how school districts adjusted to the new legislation, a group of researchers from the University of Arkansas and Brown University’s Annenberg Institute compared salary data from nearly all Arkansas public school districts before (2022–23) and after (2023–24) implementation, alongside key district characteristics like size, location, and student demographics. They then merged these data with long-term administrative records tracking teachers’ job assignments over time, allowing analysis of how changes in compensation influenced teacher retention and turnover across the state. Unlike other research that examines the impact of teacher salary increases, this study is the first to speak directly to the impact of a large, statewide minimum salary increase.

This approach allowed them to answer the following questions: How have school districts’ teacher compensation policies changed in response to the LEARNS Act? How has the distribution of teacher salaries across districts and regions shifted, and how have the relationships between teacher salaries and district characteristics evolved? And finally, how have the salary increases under the LEARNS Act affected teacher retention?

Researchers found that teacher salaries in traditionally lower-paying rural and high-poverty districts experienced larger increases in their salary steps (i.e. incremental pay increases typically based on years of experience), making the starting salaries in these districts more competitive. For example, an increase of 10 percentage points in the proportion of free or reduced-price lunch (FRPL) students in a district was associated with about a $475 average increase in starting salaries. And rural districts increased their starting salaries by just over $2,000 more than urban districts.

The researchers also concluded that the salary increases had positive effects on retention. Teachers who received raises above $2,000 were more likely to remain in their districts. It should be noted that the empirical estimates used demonstrated that the effects of a salary boost on retention were more concentrated in the first year after implementation. After the first year of implementation, the effects decreased somewhat in subsequent years. The strongest effects were observed among those who received the largest increases (above $6,000). Overall, retention rose by roughly 0.4 percentage points for each $1,000 increase in salary. Larger raises produced even bigger gains in retention, with increases of 2.2 percentage points for raises between $6,001 and $8,000, and 3.1 percentage points for raises above $8,000.

Unfortunately, the effects of the policy seemed to fade as inflation eroded the value of the initial salary gain, which aligns with prior research on the topic. While the policy demonstrates promising short-term improvements in teacher retention in the years following initial implementation, its long-term sustainability remains a concern. This highlights the need for continued study of how large, statewide reforms perform over time and how they might be adjusted to maintain their impact. Similarly, future research should also consider whether or not these policies keep more effective educators in the classroom.

Taken together, Arkansas offers an instructive example of a policy with clear potential to improve teacher retention, but it also underscores that raising salaries alone may not be enough to ensure lasting change as the policy only created a one-time increase in teacher salaries. Policymakers will need to think beyond initial salary increases and consider how to enact a structural change in teacher compensation that is able to provide educators with a sustainable salary long-term.

SOURCE: Gema Zamarro, Andrew M. Camp, Josh McGee, Taylor Wilson, & Miranda Vernon. “Raising the Floor: Teacher Retention Effects of a Statewide Minimum Salary Increase.” (March 2026).

view

A Science of Reading reality check: Not there yet | Episode 1015 of The Education Gadfly Show

4.29.2026
Podcast
 

On this week’s episode, Mike Petrilli is joined by David Griffith and Brian Fitzpatrick to discuss Fordham’s latest report, From the Teacher’s Desk: A Science of Reading Progress Report. Drawing on a nationally representative survey of K–3 teachers, they examine what educators understand about reading instruction, how state policies are shaping classroom practice, and where progress has been made. The takeaway: While many teachers are embracing the science of reading, gaps in knowledge and implementation remain.

Then on the Research Minute, Amber Northern examines new evidence on student attendance, finding that most variation is driven by student characteristics rather than school districts, raising important questions about policies that tie funding to average daily attendance.

Recommended content:

  • From the Teacher’s Desk: A Science of Reading Progress Report —David Griffith and Brian Fitzpatrick, Thomas B. Fordham Institute
  • Wonkathon 2025 Anthology: What comes next for the science of reading? —Edited by Brandon L. Wright and Elainah Elkins, Thomas B. Fordham Institute
  • Imperfect Attendance: Toward a fairer measure of student absenteeism —Jing Liu, Ph.D., Thomas B. Fordham Institute
  • How Large are District Effects on Student Attendance? Implications for School Funding Based on Average Daily Attendance David S. Knight and Mark Olofson, EdWorkingPapers (2026)

Feedback Welcome: Have ideas for improving our show? We would love to hear them. Send them to [email protected]

Fordham Logo

© 2026 The Thomas B. Fordham Institute
Privacy Policy
Usage Agreement

National

P.O. Box 110
Burke, VA 22009

202.223.5452

[email protected]

Ohio

P.O. Box 82291
Columbus, OH 43202

614.223.1580

[email protected]

Sponsorship

130 West Second Street, Suite 410
Dayton, Ohio 45402

937.227.3368

[email protected]