Mobile Navigation

  • National
    • Policy
      • High Expectations
      • Quality Choices
      • Personalized Pathways
    • Research
    • Commentary
      • Gadfly Newsletter
      • Flypaper Blog
    • Events
    • Scholars Program
  • Ohio
    • Policy
      • Priorities
      • Media & Testimony
    • Research
    • Commentary
      • Ohio Education Gadfly Biweekly
      • Ohio Gadfly Daily
  • Charter Authorizing
    • Application
    • Sponsored Schools
    • Resources
  • About
    • Mission
    • Board
    • Staff
    • Career
Home
Home
Advancing Educational Excellence

Main Navigation

  • National
  • Ohio
  • Charter Authorizing
  • About

National Menu

  • Topics
    • Accountability & Testing
    • Advanced Education
    • Career & Technical Education
    • Charter Schools
    • Curriculum & Instruction
    • ESSA
    • Evidence-Based Learning
    • Facilities
    • Governance
    • Personalized Learning
    • Private School Choice
    • School Finance
    • Standards
    • Teachers & School Leaders
    • Think Again
  • Research
  • Commentary
    • Gadfly Newsletter
    • Flypaper Blog
    • Gadfly Podcast
  • Events
  • Scholars Program

The Education Gadfly Weekly

Sign Up to Receive Fordham Updates

We'll send you quality research, commentary, analysis, and news on the education issues you care about.
Thank you for signing up!
Please check your email to confirm the subscription.

The Education Gadfly Weekly: Let researchers peek into the black box of the classroom

Volume 18, Number 48
12.5.2018
12.5.2018

The Education Gadfly Weekly: Let researchers peek into the black box of the classroom

Volume 18, Number 48
view

To improve educational practice, let researchers peek into the black box of the classroom

I’m in the middle of a series of posts looking at how we might usher in a “Golden Age of Educational Practice” now that big new policy initiatives appear to be on ice.

Michael J. Petrilli 12.5.2018
NationalFlypaper

To improve educational practice, let researchers peek into the black box of the classroom

Michael J. Petrilli
12.5.2018
Flypaper

Credit recovery: Good intentions, poor execution

Michael J. Petrilli | Amber M. Northern, Ph.D.
12.5.2018
Flypaper

Remembering two education reformers

Chester E. Finn, Jr.
12.3.2018
Flypaper

What is the value of earning college credit from AP?

Andrew Scanlan
12.5.2018
Flypaper

Per-pupil funding in charter and traditional public schools

Jessie McBirney
12.5.2018
Flypaper

The Education Gadfly Show: The sad state of credit recovery

12.5.2018
Podcast
view

Credit recovery: Good intentions, poor execution

Michael J. Petrilli, Amber M. Northern, Ph.D. 12.5.2018
Flypaper
view

Remembering two education reformers

Chester E. Finn, Jr. 12.3.2018
Flypaper
view

What is the value of earning college credit from AP?

Andrew Scanlan 12.5.2018
Flypaper
view

Per-pupil funding in charter and traditional public schools

Jessie McBirney 12.5.2018
Flypaper
view

The Education Gadfly Show: The sad state of credit recovery

Michael J. Petrilli, David Griffith, Ph.D., Adam Tyner, Ph.D. 12.5.2018
Podcast
view

To improve educational practice, let researchers peek into the black box of the classroom

Michael J. Petrilli
12.5.2018
Flypaper

I’m in the middle of a series of posts looking at how we might usher in a “Golden Age of Educational Practice” now that big new policy initiatives appear to be on ice. Last week I claimed that all of the possibilities that might work at scale entail various investments in innovation and R&D. Such efforts will only be successful, though, with exponentially better insight into what’s actually happening in the classroom.

That’s because, right now, key decision-makers are flying blind. Consider just a few examples of questions that have been raised in recent weeks that we simply cannot answer:

  • Is student achievement flat because teachers are implementing Common Core, and it’s not working? Or is it flat because are teachers mostly ignoring Common Core? Or is it neither of the above? We have no idea.
  • Has “balanced literacy” served as a Trojan Horse that allowed whole-language reading instruction to continue unabated in our elementary schools, instead of a scientifically-based approach with a big emphasis on phonics and phonemic awareness? Is this an issue in relatively few schools or lots of schools? We have no idea.
  • Are most high schools teaching a Howard Zinn–inspired version of U.S. history, with an overwhelming focus on our country’s injustices, as opposed to its triumphs, too? Or is this just happening in deep-blue bubbles? We have no idea.

And it’s not just policy wonks or education scholars that lack information; leaders at state and local levels have too little insight into classroom practice as well. Whereas the world outside of our schools has been transformed by information technology, the data we collect on classroom practices is somewhere between nonexistent and laughably rudimentary. In other words, we know almost nothing about almost everything that matters.

To be sure, education research improved dramatically starting in the early 2000s with the creation of the Institute of Education Sciences, the federal mandate for annual tests in grades three through eight, and the concurrent development of longitudinal data systems in most states. Scholars suddenly had the money and the data to examine a variety of educational interventions and their impact on student achievement, significantly increasing our understanding of what’s working to boost student outcomes.

Yet the vast majority of such studies rely on state “administrative data”—information that is collected to enable our systems to keep humming along, but that can also be happily recycled as markers of various inputs or programs whose effectiveness might be studied. Lots of this is related to teacher characteristics—their years of experience, race, training, and credentials. Other data captures bits of the student experience—their attendance patterns, course-taking habits, family background—and that of their peers.

This is all well and good but it’s still very limited. We end up studying the shadow of educational practice rather than the real thing. What we don’t see is what’s actually going on in the classroom—the day-to-day work of teachers and their students—the curriculum, the assignments, the marks students receive, the quality of instruction itself. We simply don’t know what kids do all day: the books they read, the tasks they’re asked to perform, the textbooks teachers use—or even whether they’re used at all or sit unopened in the closet, whether programs are implemented with fidelity, haphazardly, or not at all.

Examining practice has always been a difficult and expensive proposition. The most respected approach involves putting lots of trained observers—often graduate students—in the back of classrooms. There, they typically watch closely and code various aspects of teaching and learning, or collect video and spend innumerable hours coding it by hand. This is incredibly labor-intensive and costs gobs of money, so it is relatively rare.

Alternatives to observational studies are much less satisfying. The most common is to survey teachers about their classroom practices or curricula, as is done with the background questionnaires given to teachers as part of the National Assessment of Educational Progress (NAEP). Though useful, these types of surveys have big limitations, as they rely on teachers to be accurate reporters of their own practice—which is tough even with positive intentions. It’s also hard to know whom to survey about some information; for example, Morgan Polikoff, associate professor of K–12 policy at the University of Southern California, has been trying to understand which textbooks schools are using, and is finding that, in many districts, nobody can give him a straight answer.

So that’s the challenge: We lack the systems to collect detailed information about classroom practice that might help us learn what’s working and what’s not, and inform changes in direction at all levels of governance.

Thankfully there are potential solutions. I see three:

  1. Take advantage of data already being collected by online learning providers and services, such as Google Classroom, to gain insights into our schools;
  2. Systematically collect a sample of student assignments, complete with teacher feedback, to learn more about the “enacted curriculum,” its level of challenge, and its variation; and
  3. Use video or audio recording technology in a small sample of schools to better understand instructional practice in America today.

The first possibility is a cousin of using administrative data to power research studies. Online learning platforms like Khan Academy and services like Google Classroom are already collecting reams of data about teaching and learning, but to my knowledge, these data remain largely proprietary and locked away. Surely it would be possible to protect student privacy and any trade secrets while allowing researchers to gain insights into what’s working in our schools.

Google Classroom seems particularly promising, given that, by some accounts, more than two-thirds of districts use it today. Imagine if scholars could view, anonymously, student essays and other assignments. With the help of machine learning, we could figure out how much variation there is in the level of challenge of the assignments and in the grading standards. And we could glimpse if schools with tougher assignments and higher grading standards were getting better results in terms of student learning, after controlling for background factors. We might also be able to tell which curriculum a given teacher or school was using and the degree of alignment between student assignments and grade-level standards.

This approach would be particularly useful for middle and high schools, given that many assignments are now completed online. But what about elementary schools, where paper-and-pencil worksheets still largely rule the roost? That brings us to our second big idea. Imagine if we could identify a nationally representative sample of elementary schools where researchers would collect a sample of student work on a regular basis—worksheets, quizzes, tests, etc. The research initiative would develop an easy-to-use mechanism for digitizing these materials, adding value to the teacher and the school. For example, a scanner could be provided that makes copies of marked-up worksheets and quizzes, automatically enters the grades into teachers’ electronic grade-books, puts an electronic copy in a students’ online portfolio, and sends the image to parents’ emails. Meanwhile the information is sent to the researchers, connected securely to each students’ profile, and anonymized. (Xerox’s XEAMS initiative experimented with some aspects of this; Class Dojo has some of these functionalities, too, with students scanning their work with iPads.)

Just as with Google Classroom, we’d make a quantum leap in our understanding about the curriculum our schools are using, the level of rigor in student assignments, teachers’ grading standards, and much more.

The third big idea, and also the most controversial, is to record what’s happening in a sample of our classrooms. (Audio is less intrusive than video, and gives you just as much information.) Using a smart speaker like Amazon’s Echo or a Google Home Mini, researchers could capture the play-by-play of instructional practice and then train algorithms to make sense of what’s going on. As I explained in my Education Next column earlier this year, this is no longer the stuff of science fiction. Researchers are already doing this to glean insights into the kind of questions teachers are asking—and which approaches work best to drive student engagement and learning.

They start by capturing high-quality audio, and then run the audio files through several speech-recognition programs, producing a transcript. Then their algorithm goes to work, looking at both the transcript and the audio files (which have markers for intonation, tempo, and more) to match codes provided by human observers.

The computer program has gotten quite good at detecting different types of activities—lectures versus group discussion versus seatwork, for example—and is starting to be able to also differentiate between good and bad questions. Humans are still more reliable coders, especially for ambiguous cases. But the computers are getting better and better, and good enough that, with sufficient data, they can already produce some very reliable findings at a fraction of the cost of a people-powered study.

Connect all of this up to state administrative data and student achievement data and we would finally have an accurate picture of what’s actually going on in U.S. schools. (We’d know, for example, the degree to which schools are narrowing the curriculum and squeezing out science and social studies.) And we’d have vastly more information with which to study the effectiveness of various instructional and curricular approaches. 

Big hurdles remain, to be sure. The biggest aren’t technological, but political: Such an effort must earn the trust of teachers and parents. We must be able to promise that none of the data will be used to evaluate or punish teachers; it must also be protected with the highest level of data security. None of that would be easy, but by allowing schools to opt-in, and by starting with a small pilot, such an initiative might earn the trust of key stakeholders over time.

To be clear, this is a different idea than putting a camera or microphone in every classroom—akin to body cameras or dashboard cameras for police. I’ve written about that notion too, and see potential value in it, but it raises Orwellian questions that are a whole order of magnitude higher.

The goal here is to accelerate the R&D process by improving our ability to learn about instruction. For that purpose, a relatively small number of schools or classrooms—in communities that volunteer to participate—would do the trick.

***

To be clear, collecting better information about classroom practice is just one part of the puzzle. We also need to fund rigorous studies to turn the data into insights about what’s working, and then have to figure out how to get evidence-based practices into the schools. I will tackle all of that in future posts. But without good data, any R&D strategy is destined to fail. It’s a critical foundation, and one that is not nearly sturdy enough today.


view

Credit recovery: Good intentions, poor execution

Michael J. Petrilli | Amber M. Northern, Ph.D.
12.5.2018
Flypaper

Last May, Slate ran an eight-part series exploring the rise in online learning for high school students who had failed a course. One of the articles included a screenshot of this tweet with identifying information removed: “If anyone wants to go online and do my chemistry credit recovery, I’d be more than happy to give you my username and password.”

Ouch. Teenage bravado, perhaps, but it illustrates our worst fears about credit recovery.

For the uninitiated, credit recovery is the practice of enabling high-school students to retrieve credits from courses that they either failed or failed to complete. And it’s at the crossroads of two big trends in education.

The first is the desire to move toward “competency based” education. Rather than make all pupils march through a prescribed curriculum on a one-size-fits-all timeline, this approach allows them to move at their own pace, earning a credential by demonstrating what they know and can do, not because they accumulated a fixed number of hours in their classroom seats.

The second trend is the push to dramatically boost graduation rates. That started with a No Child Left Behind regulation under former U.S. Education Secretary Margaret Spellings, mandating that states measure graduation rates in a standardized way, that they strive toward challenging goals for boosting said rates, and that they hold high schools accountable for not attaining them.

It worked, sort of. On-time high school graduation rates rose from 79 percent in 2011 to 84 percent in 2016—yet there’s little evidence that students are learning more as a result. A key question is whether these rising rates indicate real educational progress—or games and chicanery. Clearly, credit recovery has played a part in the increase, as it was explicitly developed to help credit-deficient high school students complete all their course requirements. What we don’t know is whether the credits thus obtained are the fruit of high-quality alternative courses that expect students to demonstrate the same knowledge and skills of the original courses—or are vacuous imitations, a sort of educational fakery.

Anecdotal evidence offers ample cause for concern. The high-profile 2017 investigation into Washington, D.C.,’s Ballou High School is perhaps the most vivid example. Investigators found that most students graduated despite sky-high absenteeism rates and widespread use of credit-recovery courses. But the problem is not restricted to one school in the nation’s capital. Similar concerns about credit recovery have been raised in multiple states, including California, North Carolina, New York, and Virginia.

Under the Every Student Succeeds Act, states must still factor graduation rates into their high school accountability plans. So the federal incentive to game the statistic remains in place, which underscores the need to keep it from turning into a total end run around actual learning.

Unfortunately, reliable data are non-existent when it comes to how states and districts define credit recovery programs, much less when it comes to gauging their quality. That data drought received a welcome sprinkle of rain when, for the first time, the Office for Civil Rights released data in 2018 on whether individual schools offered credit-recovery programs and how many students were enrolled in them.

These new data, though humble in scope, allow us to report credit recovery participation rates at national, state, and local levels—and provide a baseline by which future participation can be compared. Fordham’s Associate Director of Research Adam Tyner and Research Associate Nicholas Munyan-Penney were keen to delve into the new data and are the co-authors of our newest study, Gotta Give 'Em Credit: State and District Variation in Credit Recovery Participation Rates.

They sought to answer three questions: How many high schools have active credit recovery programs, and are some types of schools more likely than others to have them? How many students are enrolled in credit recovery? And to what extent do schools enroll large shares of their students in credit recovery, and is that more common in certain types of schools?

For each school, Tyner and Munyan-Penney merged the OCR program and student participation data from 2015–16 with same-year enrollment and demographic data from the National Center for Education Statistics (NCES). They included traditional district-operated schools as well as charters and magnet schools.

Their analysis yielded five key findings.

  1. Most high schools have credit recovery programs, although these are far less common in charter schools.
  2. While the presence of credit recovery programs is generally not related to school poverty levels, schools with many minority students are slightly more likely to have active programs.
  3. Credit recovery programs are less common in smaller schools.
  4. In high schools with active credit recovery programs, an average of 8 percent of students participate. However, nearly one in ten schools enrolls 20 percent or more of its students.
  5. Higher enrollment in credit recovery is more common in large and urban schools, as well as in charter schools and schools with higher proportions of poor and minority students.

We derive four takeaways from these findings, the first of which is to adopt the old adage of trust but verify. Credit recovery programs are so varied and uneven that it’s wise to view them with skepticism. Until we have better data than are presently available, we shouldn’t assume that they’re of high quality, absent closer inspection. Frankly it’s suspicious that higher enrollment in CR is more common in urban schools and in schools with higher proportions of poor and minority students, given that these are often the same schools where graduation rates have risen the fastest.

That said, don’t assume that all forms of CR are fraudulent. It’s premature to make sweeping generalizations about the value and efficacy of these programs. Like most educational interventions, we can find places that are experiencing genuine success as a result of the intervention, but we can also find places that manifest dismal failure.

On that note, the second takeaway is target the outliers. Districts and schools (both traditional and charter) with higher rates of students participating in credit recovery warrant scrutiny. The authors name some of those districts in this report. When they have nearly half or more of their students enrolled in credit recovery, it is past time to wave a cautionary flag. Automatic audits should be triggered by such rates because the potential to abuse this kind of programs is high—and highest when there’s no external evidence.

Third, adopt the recommendations put forth by this report’s authors. That includes collecting additional data about credit recovery programs at the federal and state levels, such as whether courses are taken in person or online and the name of the curriculum or software program used; adopting formal state guidelines for credit recovery programs, especially as they pertain to eligibility and vetting of courses; and using external assessments to hold students and schools accountable. We’re particularly enthusiastic about the latter, which would go a long way toward making credit recovery a form of competency-based education; it’s hard to say that about it today.

Fourth, in the absence of an external check on quality, adopt the “ounce of prevention” rule. Stipulate, as some states already do, that students must have previously failed the course to be eligible for credit recovery. Or do as Alabama and Tennessee have done and demand that students achieve a minimum score in the original course so that they aren’t starting from scratch with new material. If they don’t reach that minimum, require them to retake the traditional course to earn credit.

***

Having more than one way to demonstrate mastery of content in high school is laudable, especially because students’ distinctive needs require greater personalization. But these promising methods must be executed with more than good intentions. That means making certain that credit recovery meets our expectations for quality, including using external assessments to ensure comparability and rigor, and cracking down on schools that appear to be over-relying on it. In other words, erect sufficient safeguards to protect students from misuse.

Otherwise, the incentives to propel unprepared adolescents towards graduation will outweigh those that advance the challenging but noble work of sufficiently educating them.

view

Remembering two education reformers

Chester E. Finn, Jr.
12.3.2018
Flypaper

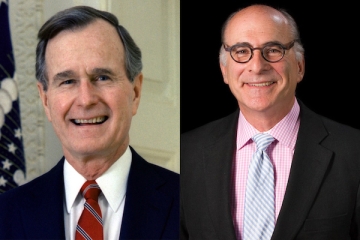
American education lost two great leaders last week with the passing of George H.W. Bush and Harold O. Levy.

It’s likely they never even met, as they came from different worlds and moved through the education solar system on different orbits. They belonged to different political parties and hailed from different generations. Yet their contributions to the betterment of K-12 education in the United States were both large and in interesting ways parallel.

Bush was a New England aristocrat turned Texas oilman turned politician and government official. Save for his time as ambassador to the United Nations, he never lived in New York. Levy, on the other hand, was a quintessential New Yorker, the son of Jewish refugees, a Wall Street lawyer who ultimately became the city’s schools chancellor and then head of an important private foundation.

Yet each was, in his way, an education leader, a visionary even, a champion of both excellence and equity, the head of large enterprises, and the source of a durable and influential legacy.

In 1988, campaigning in New Hampshire, Bush declared before a high-school audience that “I want to be the education president.” No U.S. president nor (to my knowledge) serious candidate had ever before said anything of the sort. Education wasn’t the business of the federal government—isn’t even mentioned in the Constitution. But Bush had served as Reagan’s vice president when A Nation at Risk emerged. Within months of its publication, he was hosting the governors for lobsters and education talk at Kennebunkport, along with education secretary Ted Bell. Though a number of governors, especially in the south, were already at work on boosting the educational performance of their states, there was much grumping at the Maine confab about the dearth of comparable state-level data on education performance and the absence of any sort of overall strategy for addressing the country’s level of education risk. Bush took it in—and asked Bell to do what he could. Among other things, this led to the infamous “wall chart” that paved the way for state-level NAEP testing a few years later.

In Bush’s second term as VP, Bill Bennett was education secretary and ideas began to fly for ways to tackle the education problem. The National Governors Association, led by Tennessee’s Lamar Alexander, launched a five-year initiative to examine the problem and possible solutions to it. Bush himself began to visit schools and immerse himself more deeply. (While working with Bennett, I once had the thrill of accompanying the VP and Barbara Bush on Air Force 2 on a school-visit trip.) Yet there was still no coherent national strategy, certainly nothing that linked state and federal actions.

When Bush reached the Oval Office on January 20, 1989, one of his first moves was to summon the governors to an education “summit.” This was only the third time any president had convened such an extraordinary session—both Roosevelts had done so on other issues—and the first time that education was the topic.

What emerged from that September’s gathering, which prominently included Arkansas’s Bill Clinton and was orchestrated by talented White House staffers, was a joint declaration of “national education goals” for the year 2000. It was overly ambitious to be sure, almost naively so, yet in the wake of the Charlottesville summit came the sequence of events that dominated American K-12 education policy and practice for a quarter century. It led to Bush’s own “America 2000” plan (crafted largely by education secretary Lamar Alexander), followed by Bill Clinton and Dick Riley and “Goals 2000,” as well as 1994’s Improving America’s Schools Act, followed by No Child Left Behind and all that was linked to it under Bush 43 and Barack Obama. One could make a pretty good case that 2015’s ESSA legislation (also crafted by Alexander) marked a sort of return to “America 2000,” albeit with many residual elements of NCLB.

Obviously, George H.W. Bush wasn’t solely responsible for all of this. If you wanted to minimize his contribution, you’d say he caught a wave that was already headed ashore. But that’s not right. I see him as a guy who jumped onto a slow-moving vehicle that had no particular destination and both pressed the accelerator and grabbed the wheel. (Recall how much he liked to take the tiller of a speedboat.) He also had, if not a precise end point in mind, at least a clear rationale for the direction in which he was steering. Consider this from his 1990 State of the Union address:

[T]he most important competitiveness program of all is one which improves education in America. When some of our students actually have trouble locating America on a map of the world, it is time for us to map a new approach to education. We must reward excellence and cut through bureaucracy. We must help schools that need help the most. We must give choice to parents, students, teachers, and principals; and we must hold all concerned accountable. In education, we cannot tolerate mediocrity. I want to cut that dropout rate and make America a more literate nation, because what it really comes down to is this: The longer our graduation lines are today, the shorter our unemployment lines will be tomorrow.

So, tonight I’m proposing the following initiatives: the beginning of a $500 million program to reward America’s best schools, merit schools; the creation of special Presidential awards for the best teachers in every State, because excellence should be rewarded; the establishment of a new program of National Science Scholars, one each year for every Member of the House and Senate, to give this generation of students a special incentive to excel in science and mathematics; the expanded use of magnet schools, which give families and students greater choice; and a new program to encourage alternative certification, which will let talented people from all fields teach in our classrooms. I’ve said I’d like to be the “Education President.”  And tonight, I’d ask you to join me by becoming the “Education Congress.”

Thank you, President Bush. May you rest in peace and may your contributions to the renewal of American education receive the recognition and accolades they deserve.

***

Harold Levy died far too young and from an especially cruel disease. You would do well to view an exceptional tribute to him in October 2017—at a gala celebration of his life that he was present to appreciate—by Bard College president Leon Botstein, whose words also evoke some of what it was like to work with the brilliant, impatient and forward-looking chancellor.  I had the sad pleasure of visiting with Harold a few months ago; he wasn’t able to speak but proudly led me to his desk so I could view on his computer screen a video-recording of that entire marvelous event.

While in the role of New York City schools chancellor—for less than two years between 2000 and 2002—he launched the terrific Teaching Fellows program to bring able but unconventional people into the city’s classrooms. A graduate of the Bronx High School of Science, he established three more selective-admission high schools. To forestall social promotion, he organized summer school for hundreds of thousands of students who had failed their regular classes. He pioneered “early college high schools” (one of them with Botstein’s Bard) to give able kids a faster track into higher education. He strengthened the student information system, hacked at regulations, and outsourced the management of failing schools, all the while working with the city’s powerful teacher union on a new contract that significantly boosted pay and thereby drew many more qualified applicants to seek instructional posts in the district.

In 2002, with the arrival in City Hall of Michael Bloomberg and Joel Klein, Levy returned to the private sector but didn’t depart the education scene. First with the Kaplan Educational Foundation and then with a venture capital firm that invested in schools and education technology, he stayed interested and involved. This led in 2014 to his final position, as head of the D.C.-based Jack Kent Cooke Foundation, where in just a few years he turned what had been a quiet, almost invisible philanthropy into the country’s most consequential player in the realm of education for smart poor kids. The Foundation’s signature program is a suite of scholarships that enable thousands of such youngsters to get a topnotch high school and college education.

The scholarships weren’t new. But under Levy’s leadership and propelled by his considerable energy and personal charisma, the Foundation also became a major source of support for policy initiatives in the gifted-education space, research projects, and innumerable related ventures, such as the marvelous Sunday evening “From the Top” program, showcasing (on radio) outstanding young classical musicians. At least as important, it helped to boost the issue of educating gifted young people—and, especially, closing the “excellence gap” by creating opportunities for smart kids from poor and minority backgrounds—to the visibility that it deserves but historically had not received. Harold, one might say, was pretty good at getting attention and didn’t mind it one bit. But he was no show horse. He was a brilliant, tireless visionary and first-rate executive.

May you, too, rest in peace, Harold Levy, and may your heirs, successors, and followers continue to champion the missions that you expertly led us into.

***

Levy was a liberal, through and through, and a lifelong Democrat. Bush was an old-school conservative and for decades the embodiment of the GOP (which for a time he actually chaired). Each pursued many other issues and held multiple roles outside education. Both were wealthy men who didn’t need the headaches of public-education reform but turned to it because others needed better schools and opportunities. When they made that fateful turn, both shared key commitments and values. They sought to give kids more and better choices. They pursued high standards. They focused on achievement, on equalizing opportunity, and on excellence, all together and all at once. In time, they both painted with nationwide brushes and did so with persistence, imagination, the capacity to enlist others, and the ability to get lots and lots of others to understand key problems and the importance of solving them.

At a time of anger, division, self-absorption and small-mindedness in so many places, it’s both refreshing and inspiring to remind ourselves that it doesn’t have to be that way and to recall two great Americans who embodied that abiding truth.

view

What is the value of earning college credit from AP?

Andrew Scanlan
12.5.2018
Flypaper

College-level courses taken while in high school have never been more popular. Chief among these sources is Advanced Placement (AP), whose five million exams were taken by almost three million students in 2018. AP’s popularity has skyrocketed for a host of reasons: parents seeking a more rigorous curriculum for their kids; principals wanting to drive their school up on competitive national rankings; and students hoping to polish their college applications, propel themselves through the ivy-covered gates, and—if all goes well—skip some vast, lecture-style intro courses when they get there. It’s also widely believed (including by some 58 percent of U.S. teachers) that AP’s expansion owes something to students wanting to save money or graduate early with the help of AP credits.

Yet little is known about how many students do actually earn college credit from taking AP exams, and how this actually benefits them. A new analysis from Vanderbilt University assistant professor Brent J. Evans takes a timely look at who gains college credit via AP and what positive outcomes are associated with that credit.

Evans examined data from a nationally representative survey, following 14,830 students who started college in 2004 and tracking them for six years. He looked at their demographics and a laundry list of their subsequent outcomes: whether they attended a four-year institution; the selectivity of their college; first-year college GPA; six-year bachelor’s degree attainment; total non-AP credits earned; whether they double-majored; whether they majored in a STEM subject; the number of months and terms needed to complete their degree; if they earned advanced laboratory science or math credits; and whether they enrolled in graduate school. He also looked at certain labor elements, such as whether a student was employed and for how many hours during their first year of college, as well as their cumulative loan debt. And he controlled for prior academic achievement and demographic differences, as well as differences in student sorting across higher education institutions in colleges’ policies for granting credit on the basis of AP.

One surprising finding is that just 7.6 percent of first year college students enter with a least one credit derived from AP—this in contrast with the (today) nearly one-fourth of high school graduates the College Board says have acquired at least one AP score of 3 or better. Those who started with such credits averaged ten credit hours applied to a 120-hour degree program and reduced their cumulative loan debt by about $1,000 each. They also used their AP credits to help reduce time to degree (especially among lower-income students who qualified for Pell Grants), pursue STEM majors, and to take more advanced math courses rather than increasing their leisure time or hours of paid work. Evans also finds strong positive effects from earning AP credit on academic outcomes during college, including increased first-year GPAs and increased likelihood of attaining a bachelor’s degree within six years, with the strongest outcomes associated with a shorter time to degree completion and increased likelihood of double-majoring. The more credits earned, the larger the effects on most outcomes.

The study stands out for the sheer scale of outcomes it examines. Few previous AP studies have come close, especially with a sample of this size. Also noteworthy is that it examined actual credits earned, not potential credits, or predictive credits, as is most common in prior research.

Still, the study has many of the same limitations as other AP research, beginning with selection effects: AP students are more likely to be better students, which entails unobservable student characteristics (such as intrinsic motivation, prior academic ability, etc.) that may affect their college outcomes more than earning credit from AP. Ultimately, the study demonstrates that earning credit from AP can potentially benefit those who do, but such students are likely to be high achievers anyway. The subject demands greater attention and analysis, as much has changed over the past fourteen years in how AP credits are granted; even while more elite universities are limiting credit-granting to scores of 5 (or are eliminating this practice altogether), some twenty-eight states now have mandatory (system-wide or statewide) credit-in-return for scores of 3 or above.

Nevertheless, Evans’s study adds another important layer to our understanding of how students earn credit from AP in college and the potential benefits for kids who manage to do so.

SOURCE: Brent J. Evans, “How College Students Use Advanced Placement Credit,” American Educational Research Journal (November 2018).

view

Per-pupil funding in charter and traditional public schools

Jessie McBirney
12.5.2018
Flypaper

Journalists are told to “follow the money,” and it seems only fair the same adage be applied to education. A new report from the School Choice Demonstration Project at the University of Arkansas does just that, comparing the levels and sources of funding between traditional public schools (TPS) and charter schools in some of our nation’s largest metropolitan areas. Faithfully following the money, the authors finding a whopping $5,835 annual advantage for each TPS student.

The researchers—Corey A. DeAngelis, Patrick J. Wolf, Larry D. Maloney, and Jay F. May—collected revenue data for the 2015–16 school year from what they refer to as “a maze” of district, state, and federal websites. Where states did not gather the same depth of data for charters, information came from annual reports, independent audits, and federal 990 forms from individual schools. The authors grade fourteen metropolitan areas by the width of the funding gap between TPS and charters—cities with less than a 5 percent disparity receive an “A,” and those with more than a 25 percent disparity receive an “F.” All the numbers in the report are per pupil, calculated using fall enrollment data.

Notably, the study analyzes yearly revenues, not yearly expenditures. Some charter skeptics say expenditures are a fairer metric because TPS have more fixed, mandatory costs (like transportation) than charters do. The authors reject this outlook, arguing that innovation—including financial innovation—is one of the central purposes of charter schools. “A revenue-based analysis,” they say, “is grounded in a concept of equal funding for equal purpose.”

They find that, on average, public charter schools received $5,828 less than TPS in per-pupil funding—a gap of about 27 percent. Thirteen of the fourteen cities received a C or lower for funding equity; the outlying A grade is for Houston, Texas, where charter students receive 95 percent of the funding as their peers in TPS. The “worst” F grade goes to Atlanta, Georgia, which gives charter schools 49 percent less money per student.

Of course, many charter schools enroll lower percentages of low-income students, English language learners (ELLs), or students with disabilities than do TPS, which could explain some or all of the funding gaps. However, the researchers found that enrollment of these three subgroups in the fourteen regions was not as disproportionately low as some may claim. Even where charters did enroll fewer disadvantaged students, the small percentage differences did not account for larger per-student funding gaps.

Local funding accounts for most of the disparity between TPS and charter revenues. On average, charter schools received 76 percent less funding from their own cities—about $8,000 less per student. In fact, six cities gave no dollars to their local charter schools. Charters also receive lower funding from states and the federal government. They recoup some of their losses through private donations, which go disproportionately to charter schools. However, donations are a relatively small portion of every school’s annual budget, so the per-pupil advantage is only about $655. This clearly does not go far in covering the overall funding gap.

While most of the findings in this study are not very clearly communicated and the authors’ grading cutoffs seem somewhat arbitrary, they rightly conclude that state and local governments can do more to extend equal opportunities to charter school students. Families should not have to sacrifice thousands of dollars each year for the chance to send their children to the school of their choice. One change the authors recommend is that states should base school funding—for TPS and charters alike—more heavily on student need, so that disadvantaged students can receive the support they need no matter where they go each morning.

SOURCE: Corey A. DeAngelis, Patrick J. Wolf, Larry D. Maloney, and Jay F. May, “Charter School Funding: (More) Inequity in the City.” University of Arkansas School Choice Demonstration Project, November 2018.

view

The Education Gadfly Show: The sad state of credit recovery

12.5.2018
Podcast

On this week’s podcast, Samantha Viano, Assistant Professor of Education at George Mason University, joins Mike Petrilli and David Griffith to discuss Fordham’s new study of credit recovery programs, and her own work on the subject. On the Research Minute, Adam Tyner examines how high school start times affect student outcomes.

Amber’s Research Minute

Kevin C. Bastian and Sarah C. Fuller, “Answering the Bell: High School Start Times and Student Academic Outcomes,” AERA Open (November 2018).

Fordham Logo

© 2026 The Thomas B. Fordham Institute
Privacy Policy
Usage Agreement

National

P.O. Box 110
Burke, VA 22009

202.223.5452

[email protected]

Ohio

P.O. Box 82291
Columbus, OH 43202

614.223.1580

[email protected]

Sponsorship

130 West Second Street, Suite 410
Dayton, Ohio 45402

937.227.3368

[email protected]