Mobile Navigation

  • National
    • Policy
      • High Expectations
      • Quality Choices
      • Personalized Pathways
    • Research
    • Commentary
      • Gadfly Newsletter
      • Flypaper Blog
    • Events
    • Scholars Program
  • Ohio
    • Policy
      • Priorities
      • Media & Testimony
    • Research
    • Commentary
      • Ohio Education Gadfly Biweekly
      • Ohio Gadfly Daily
  • Charter Authorizing
    • Application
    • Sponsored Schools
    • Resources
  • About
    • Mission
    • Board
    • Staff
    • Career
Home
Home
Advancing Educational Excellence

Main Navigation

  • National
  • Ohio
  • Charter Authorizing
  • About

National Menu

  • Topics
    • Accountability & Testing
    • Advanced Education
    • Career & Technical Education
    • Charter Schools
    • Curriculum & Instruction
    • ESSA
    • Evidence-Based Learning
    • Facilities
    • Governance
    • Personalized Learning
    • Private School Choice
    • School Finance
    • Standards
    • Teachers & School Leaders
    • Think Again
  • Research
  • Commentary
    • Gadfly Newsletter
    • Flypaper Blog
    • Gadfly Podcast
  • Events
  • Scholars Program

The Education Gadfly Weekly

Sign Up to Receive Fordham Updates

We'll send you quality research, commentary, analysis, and news on the education issues you care about.
Thank you for signing up!
Please check your email to confirm the subscription.

The Education Gadfly Weekly: How to interpret discipline disparities

Volume 25, Number 19
5.15.2025
5.15.2025

The Education Gadfly Weekly: How to interpret discipline disparities

Volume 25, Number 19
view
Principal's door
High Expectations

Behavior versus bias: How to interpret discipline disparities

If discipline disparities are really driven primarily by bias and systemic racism, we would expect to see the largest disparities in states with the most regressive racial attitudes. Yet mapping the data reveals a strikingly different picture. What if it’s not racism that mostly explains racial discipline disparities, but socioeconomic factors?

Michael J. Petrilli 5.15.2025
NationalFlypaper

Behavior versus bias: How to interpret discipline disparities

Michael J. Petrilli
5.15.2025
Flypaper

STEM education shouldn’t fall victim to the anti-DEI crusade

Meredith Coffey, Ph.D.
5.15.2025
Flypaper

‘Social justice’ education has been harming the children it needs to help, but cutting off funds to schools is not the answer

Steven F. Wilson
5.13.2025
Flypaper

Do “climate” surveys measure school performance?

Adam Tyner, Ph.D.
5.15.2025
Flypaper

#969: Charters, church, and the Court with Starlee Coleman

5.14.2025
Podcast

Cheers and Jeers: May 15, 2025

The Education Gadfly
5.15.2025
Flypaper

What we’re reading this week: May 15, 2025

The Education Gadfly
5.15.2025
Flypaper
view
Elementary students in lab

STEM education shouldn’t fall victim to the anti-DEI crusade

Meredith Coffey, Ph.D. 5.15.2025
Flypaper
view
Flag in elementary school classroom

‘Social justice’ education has been harming the children it needs to help, but cutting off funds to schools is not the answer

Steven F. Wilson 5.13.2025
Flypaper
view
NYC high school

Do “climate” surveys measure school performance?

Adam Tyner, Ph.D. 5.15.2025
Flypaper
view

#969: Charters, church, and the Court with Starlee Coleman

Starlee Coleman, Michael J. Petrilli, Amber M. Northern, Ph.D., David Griffith, Ph.D. 5.14.2025
Podcast
view
Fordham Gadfly image

Cheers and Jeers: May 15, 2025

The Education Gadfly 5.15.2025
Flypaper
view
Fordham Gadfly image

What we’re reading this week: May 15, 2025

The Education Gadfly 5.15.2025
Flypaper
view
Principal's door

Behavior versus bias: How to interpret discipline disparities

Michael J. Petrilli
5.15.2025
Flypaper

Editor’s note: This is part two in a series of posts on school discipline disparities. For part one, see “Let’s talk about discipline and disparate impact (again).”

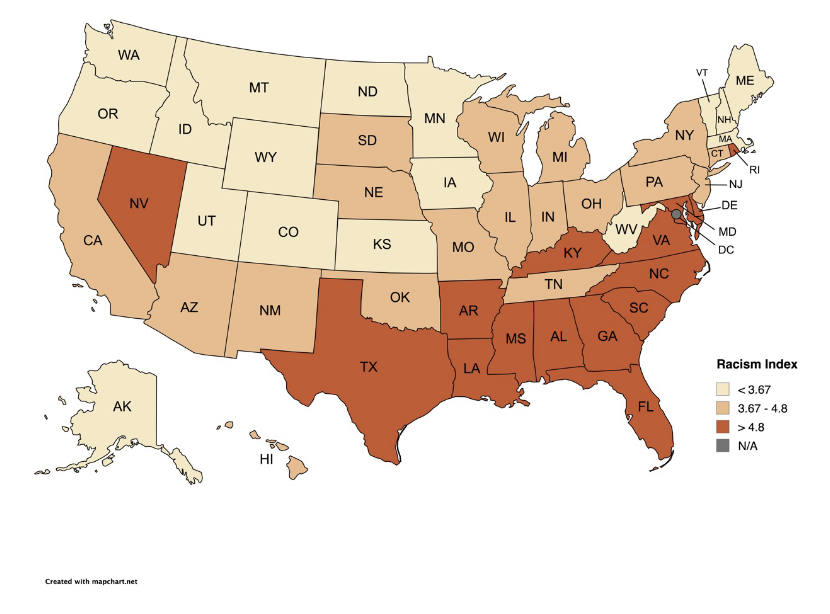
Let’s consider a thought experiment: If discipline disparities really were driven primarily by bias and systemic racism, we would expect to see the largest disparities in states with the most regressive racial attitudes.

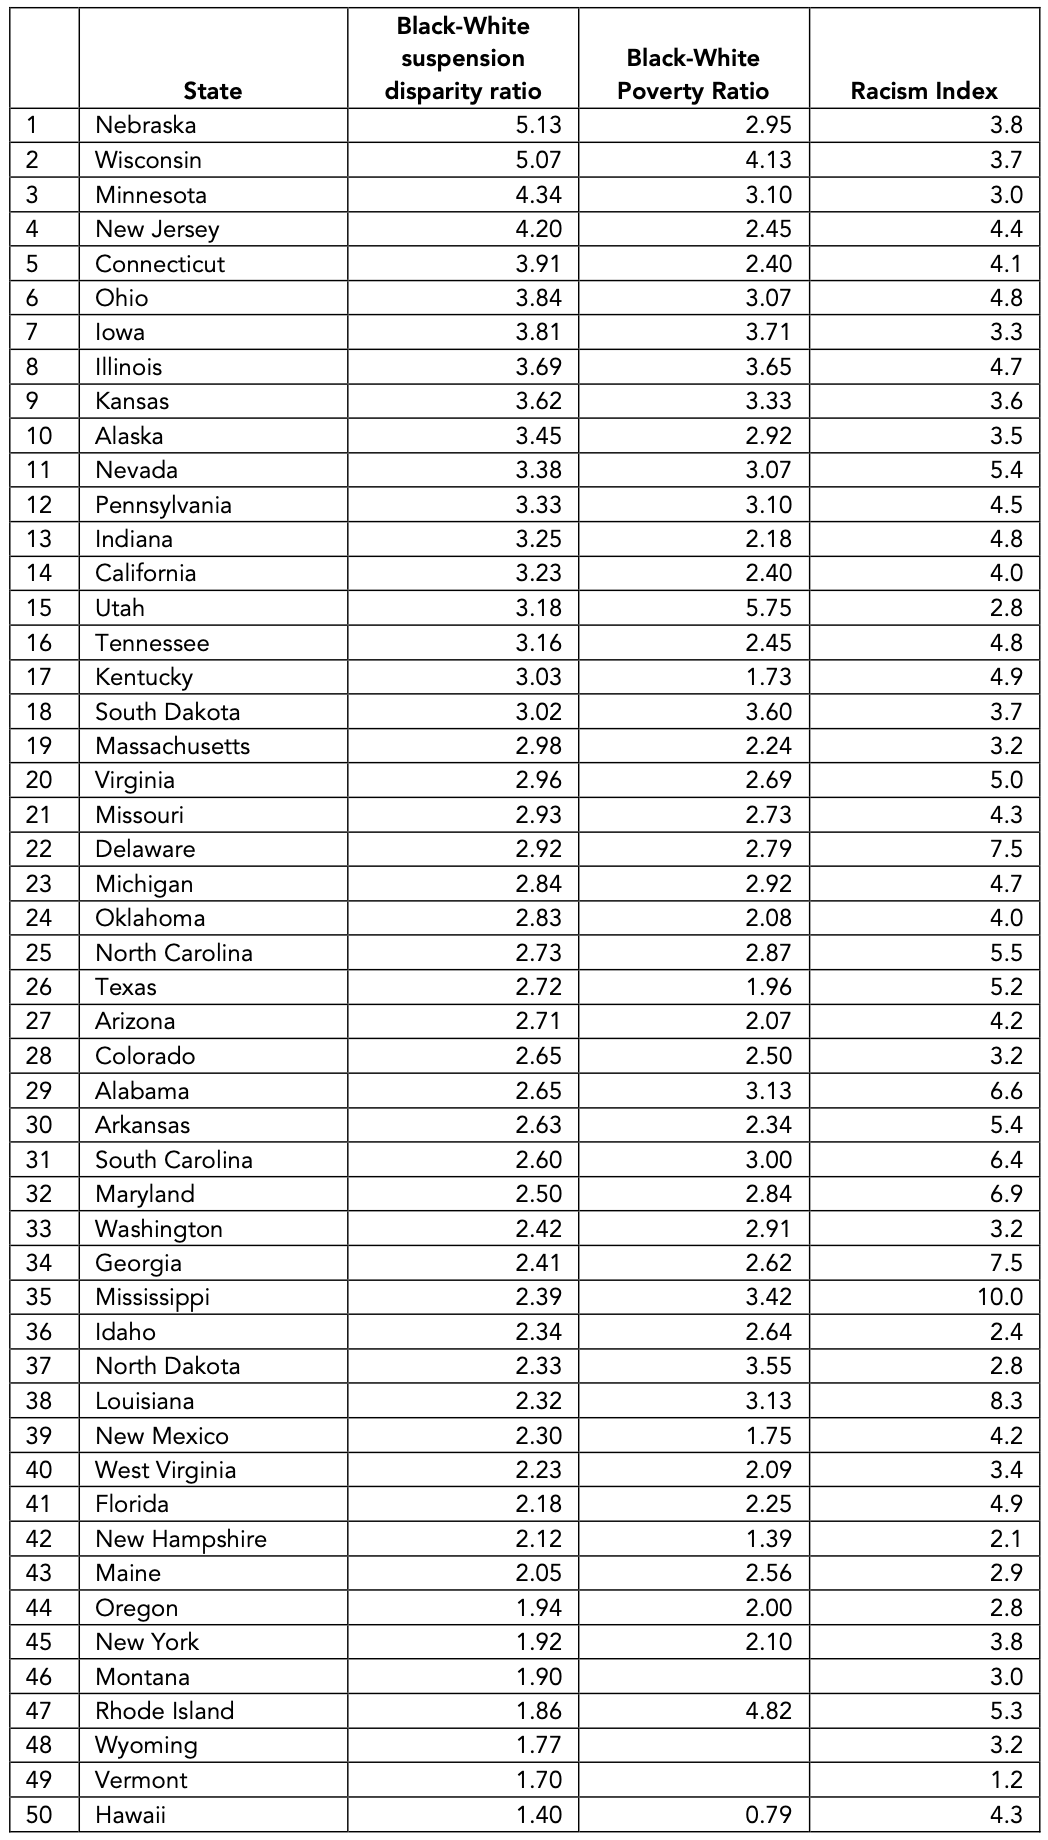
Take a look at this map, displaying a “racism” index by state (scroll down to see the state-by-state numbers). You might quibble with the underlying methodology, but to anyone with a modicum of U.S. history under their belt, the map should have some face validity, with states below the Mason-Dixon line generally scoring worse than those in the North, and much of the Midwest somewhere in between.

Map 1

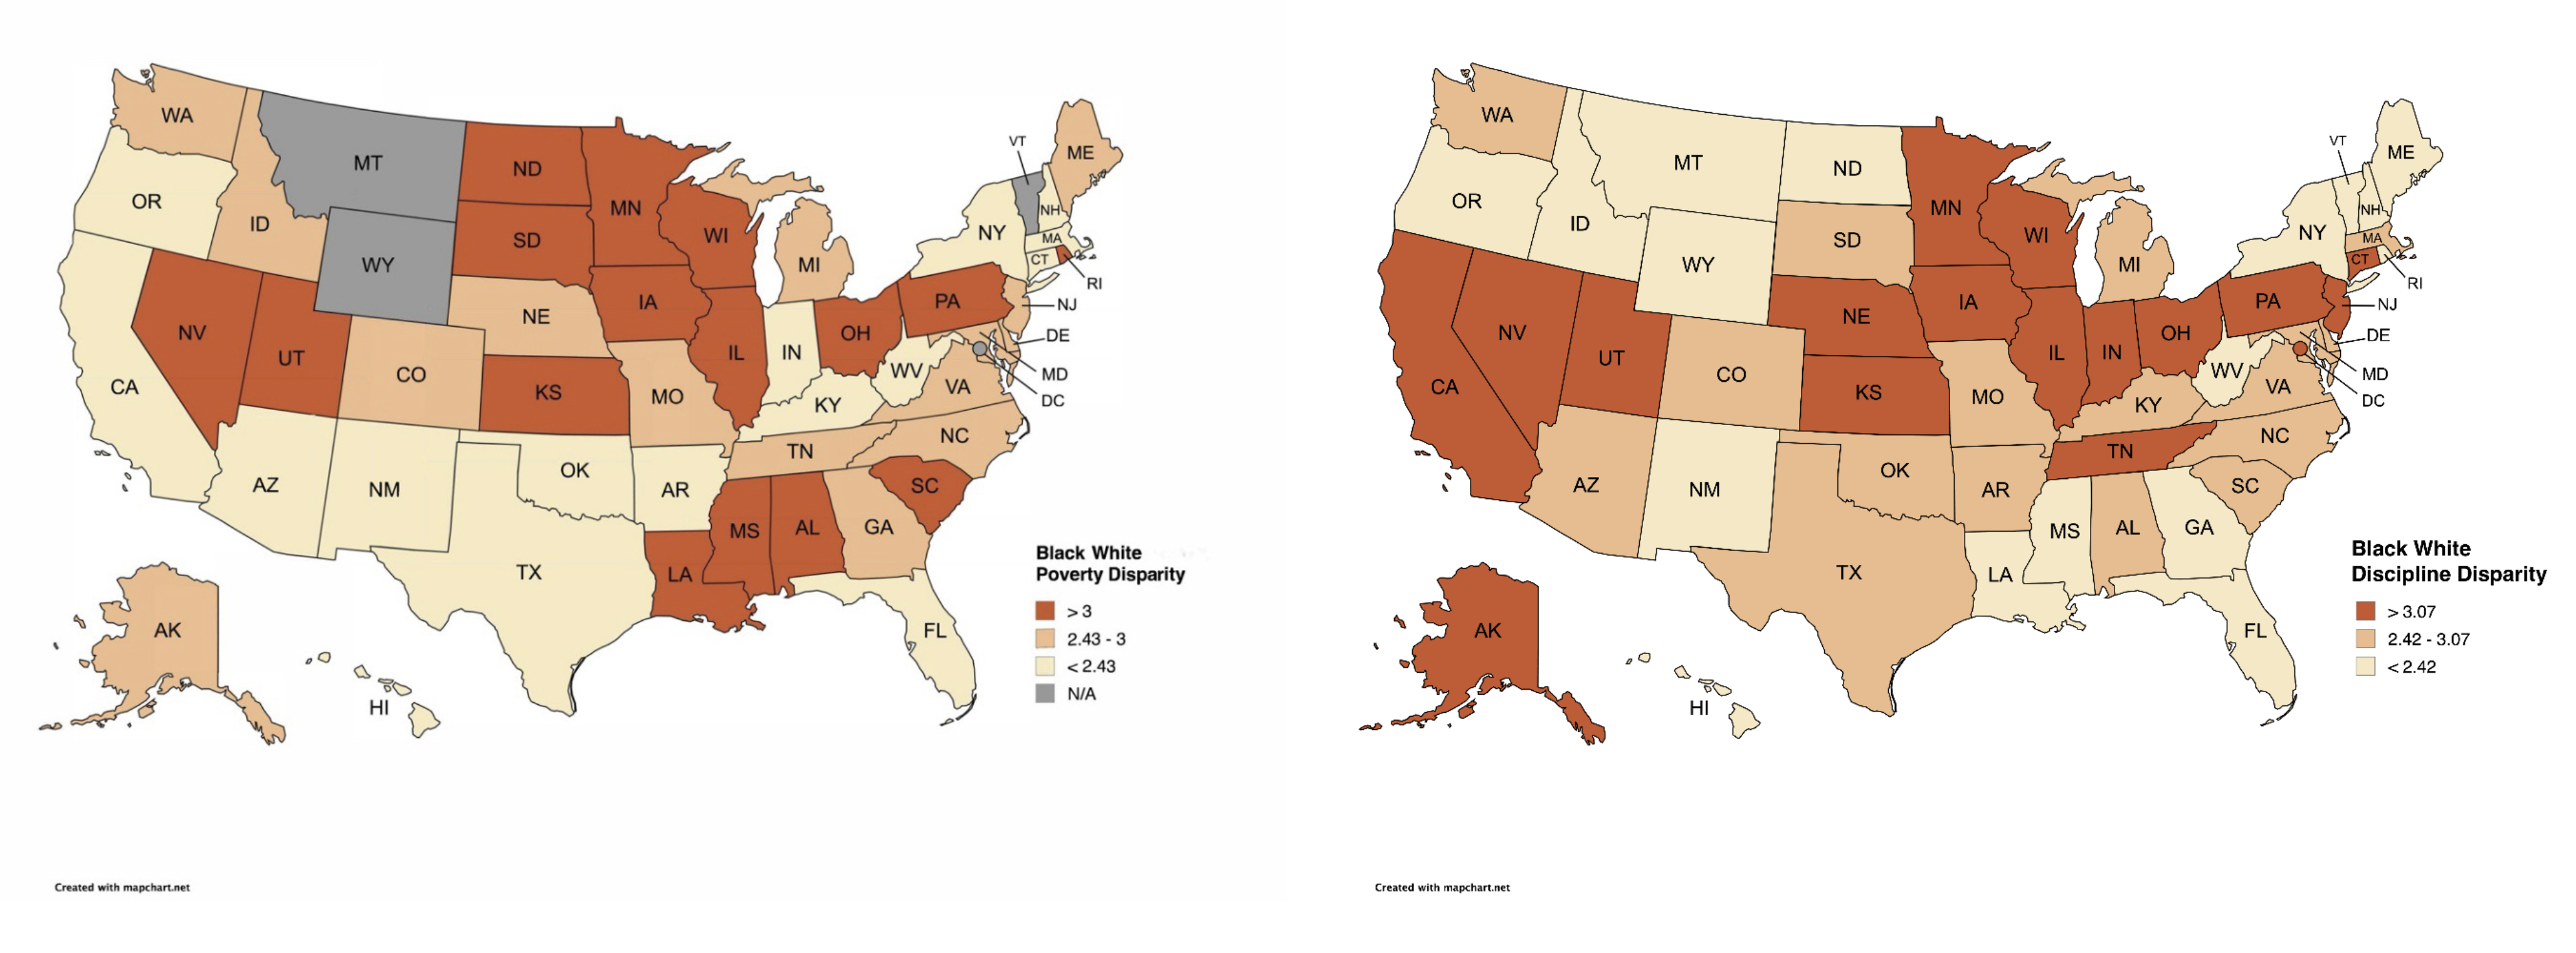
Now let’s add a map showing, by state, the magnitude of racial discipline disparities (the number of Black students suspended for every one White student suspended, based on OCR data). We would expect to again see the Deep South post sky-high numbers, and the North look great, right?

Maps 2

Uh oh.

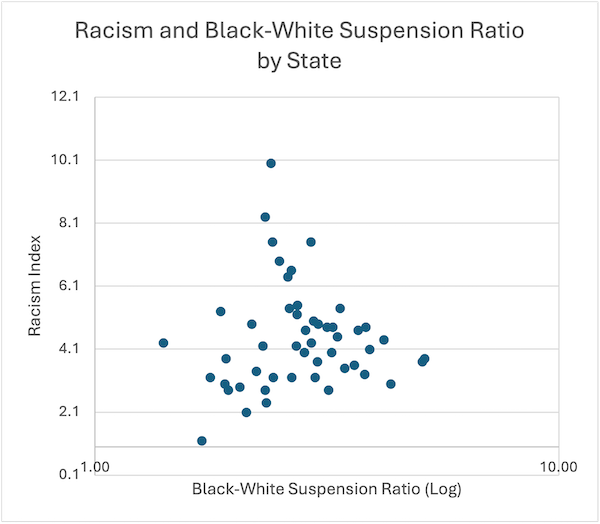
What we see instead is a total mishmash. Almost none of the “most racist” states have the worst discipline disparities, while some of the more “racially enlightened” ones (including Minnesota, Utah, and Iowa) do.

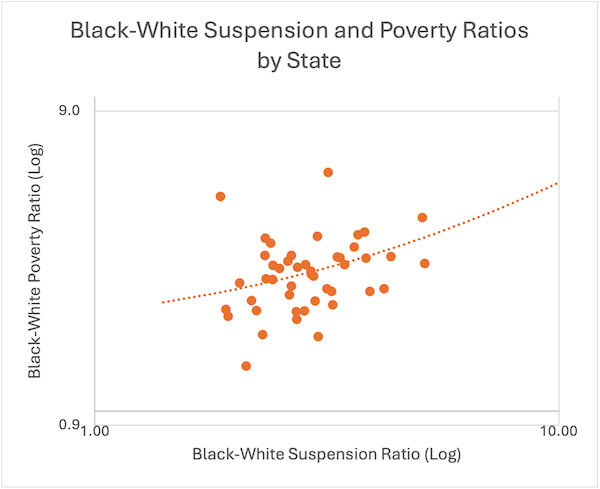
Indeed, if we plot these values on a chart, we find no relationship whatsoever.

Suspension ratios

Ok. Now let’s look at an alternative hypothesis—my hypothesis—that it’s not racism that’s predominantly driving racial discipline disparities, but socioeconomics. Let’s look, side by side, at states’ discipline disparities along with their “poverty disparities”—how many Black children are living in poverty for every one White child living in poverty. States with high poverty disparities are those where the Black population tends to be much poorer than the White population; those with low poverty disparities are those where the Black and White populations are economically more similar.

Maps 3

These maps look a lot more similar. I count nine states that score high for both discipline disparities and poverty disparities, including Pennsylvania, Ohio, Illinois, Wisconsin, Minnesota, Utah, and Nevada. These are states where White students tend to be middle class or affluent, and Black students are disproportionately poor. And it’s that difference that largely explains their large discipline disparities. (And their large racial achievement gaps, too.)

Let’s see how this looks on a chart. Here there’s a strong positive relationship between states’ poverty disparities and their discipline disparities.

Suspension poverty ratios

It’s certainly not a perfect correlation. Other factors are at play, likely including bias and discrimination. But that’s on the margins rather than at the center of the story.

Racism is a factor in discipline disparities, but a small one.

As I mentioned in my earlier post, it’s super hard to study misbehavior in school, because we seldom have any information about the behavior itself, only schools’ response to it. But a clever study out of Louisiana got around this problem by focusing on a small but telling subset of incidents. Namely: fights that featured both White and Black students. And they found, alas, that Black students received somewhat harsher punishments than White students for the same incident:

For fights involving one White student and one Black student, Black students receive slightly longer suspensions than white students. The difference is about one additional suspension day for every 20 fights. This disparity is evident even after accounting for students’ prior discipline records, background characteristics, and school attended.

So yes, racial bias and discrimination happen.

But note this finding: the suspensions that Black students receive are only “slightly” longer than the ones White students get. Yet the same study shows Black students getting suspended at twice the rate as White students—a huge difference. The reason is that Black students misbehaved at much higher rates. According to the study, more than three times as many Black students got into fights at school as White students. That’s the major factor driving the discipline disparity.

Here’s the bottom line: if we want to reduce Black (and White!) suspensions, we should focus on how to get kids to stop getting into fights and other forms of trouble at school. The Trump Administration’s recent actions on discipline and disparate impact should move us closer to that goal.


Data sources 5_15_2025

Data sources:

  • Black-White suspension disparity ratios via U.S. Department of Education – Office for Civil Rights
  • Black-White poverty ratio via U.S. Census Bureau
  • Racism Index via Datapandas.org
view
Elementary students in lab

STEM education shouldn’t fall victim to the anti-DEI crusade

Meredith Coffey, Ph.D.
5.15.2025
Flypaper

Over the past month, the Trump administration terminated $773 million in National Science Foundation (NSF) grants supporting STEM education research and innovation. Ever on brand, DOGE reported that this move saved taxpayers millions in “wasteful DEI” spending even as critics warned that the “cuts threaten the next generation of innovators.” Ed Week, for example, flagged cuts to awards for computer science education, pre-K–12 STEM learning, and STEM teacher support in high-need districts.

Curious as to what exactly was in those hundreds of canceled programs, I dug into the database of terminated NSF grants. Some certainly had strong indicia of a DEI focus. Multiple universities, for instance, lost funding for “anti-bias mathematics teaching” in K–12 classrooms, and a canceled Villanova project advanced a “Social Justice STEM Pedagogies framework” for Grades 7–12. At Florida International University, a now-terminated grant supported high school physics teachers via “inclusive and equitable practices,” “communal classroom cultures,” and “physics identity development for women and MRE [minoritized racial/ethnic groups].”

These projects may have been effective in doing what they set out to do—and it’s nearly always disruptive and fiscally inefficient to cancel any grant midstream. But regardless of what you or I may think about their merits, there was probably no universe in which programs centered on DEI ends were going to be safe from the red pen of an anti-DEI administration.

Yet many canceled grants were not visibly directed toward DEI goals, but rather toward core academic purposes. The RAND Corporation lost a grant for a researcher-practitioner partnership to create and pilot materials, lesson plans, and educator professional development to expand access to computer science for prekindergartners. Vanderbilt had planned a new AI education program for elementary schoolers in rural areas. WestEd’s revoked funding would have enabled its collaboration with Milwaukee high schools and a local technical college to develop dual enrollment math courses. The City University of New York lost support for a wastewater-based epidemiology training program designed to improve students’ career readiness and boost community preparedness against infectious diseases.

How could these efforts—and so many more like them—have been discarded as “wasteful DEI”? I’m no insider, but here are my best guesses: the computer science initiative partly aimed to boost “participation among… underrepresented groups in STEM,” the AI project included “culturally relevant instructional methods,” the advanced math courses also served as “a lever for equity,” and the epidemiology program was developed in response to “declining minority student retention and graduation rates in STEM.”

Once again, DOGE is taking its witch hunt to absurd extremes. Reckless policy by “Ctrl+F”—simply searching for the presence of terms like “equity”—is resulting in the abrupt termination of efforts to expand children’s access to STEM education, increase opportunities for accelerated learning, and enhance students’ career readiness. The administration ought to be able to recognize the difference between a project with DEI at its center and a project description that happens to include a few buzzwords.

And these losses are not insignificant. American STEM education is very much in need of expansion and innovation. Among OECD countries, U.S. fifteen-year-olds perform among the top third for science by only a narrow margin, and alarmingly, they consistently score in the bottom third for math. Americans are well aware of this mediocrity; only 28 percent of us believe that the country’s K–12 STEM education is either “above average” or “the best.”

The issue is not merely academic. Having more students engaged in STEM coursework means a wider pipeline to STEM careers. STEM education and career preparation are not zero-sum endeavors; increasing participation among underrepresented groups doesn’t preclude anyone else’s participation. Instead, more access to STEM career paths can translate into higher earnings for those individuals, as well as a larger talent pool to maintain and grow the country’s scientific and economic global competitiveness.

It’s not too late to walk back on some of the recent NSF actions. It wouldn’t be unprecedented for this administration to rescind a decision about education funding, or for a court to order the reinstatement of grants. Alternatively, an additional round of review could focus more closely on whether each grant program’s core goals would expand or strengthen STEM education. Or the government could reinitiate the competitive grantmaking process, and ex-grantees could reapply with largely the same goals (and fewer hot-button words).

Cutting efforts to improve STEM education will be a self-inflicted wound, not a savings. And the long-term costs risk harm not only to the “next generation of innovators,” but to all of us.

view
Flag in elementary school classroom

‘Social justice’ education has been harming the children it needs to help, but cutting off funds to schools is not the answer

Steven F. Wilson
5.13.2025
Flypaper

Editor’s note: This story was produced by The Hechinger Report, a nonprofit, nonpartisan news outlet focused on education.

President Trump’s sweeping dictate to end what he terms “unlawful DEI practices” is meeting fierce resistance. The National Education Association, the American Federation of Teachers and the ACLU all filed suit in opposition.

And last month, three federal judges—two appointed by Trump—ruled against the administration. One of the justices noted that the “government cannot proclaim entire categories of classroom content discriminatory to side-step the bounds of its statutory authority.”

I believe that the harm some diversity, equity, and inclusion initiatives are doing to children— especially Black and Latino students from low-income families—is increasingly evident. While certain DEI initiatives are salutary, others exacerbate noxious stereotypes and braid political teachings into daily lessons.

But President Trump’s vague and illiberal prohibitions are not the answer. Threatening to cut off federal funding to schools that educate our neediest children for their failure to comply with those prohibitions is unconscionable.

In my new book, I chronicle how, after declaring themselves “anti-racist,” some urban charter schools that had been reversing and even closing longstanding race and class achievement gaps turned away from the commitments that had driven their success: high expectations, relentless attention to great teaching and safe and orderly classrooms.

They dismantled disciplinary systems, infused math instruction with social justice content and taught students to discern “power imbalances” in literary texts.

These social justice educators believed that, before teaching academics, schools must address the trauma teachers and students experience from living in a white supremacist society. As a result of their approach, students grew bored and restive. Discipline collapsed. Outcomes nosedived.

One example: Boston Collegiate Charter School, whose students, for years, had dramatically outperformed their district peers and other students statewide. In 2019, the school celebrated its 20th anniversary and reported that, for more than a decade, all its graduates had been accepted to college, the great majority to four-year institutions.

Then, in 2020, the school hired a DEI director who conducted an “inventory,” and identified four areas of growth for the school’s staff: misogynoir, trauma-informed practice, colorism and internalized dominance and oppression.

Staff were grouped into race-based affinity circles and the history curriculum was “decolonized.”

Disciplinary practices were overhauled; new restorative justice circles were “rooted in Native culture and peacemaking practices.”

By 2023, students in Boston Collegiate’s middle school exit grade were even less likely to be found proficient in English Language Arts—on track for college and career—than students in the chronically low-performing Boston Public Schools.

By contrast, other high-performing urban charter schools that declined to embrace anti-racist and social justice programming and held fast in their dedication to academic excellence continued to excel. In New York City in 2024, more than 95 percent of students at Success Academy and Classical Charter Schools were found to be proficient in math and more than 81 percent in English Language Arts.

Social justice education, it is increasingly evident, is harming the very children it aims to help, leaving them less educated, more excluded and more vulnerable. Yet those who challenge this ideology are condemned and ostracized.

Instead, schools should emphasize students’ shared humanity and foster a sense of belonging. Most importantly, they should equip all students—not least the historically marginalized—with the vibrant liberal arts education long provided to the privileged; one that forges students who are intrigued by diverse traditions and energized by new ways of seeing the world.

When students and teachers grapple together with unfamiliar and at times unsettling ideas, when they engage one another with curiosity and generosity of spirit, racial prejudice withers. When done right, DEI initiatives don’t divide us, they bring us together.

That is why I believe President Trump’s war on DEI is misguided. Lack of diversity of thought from the left should not be met by restrictions on speech from the right.

We know the harms to students of such prohibitions. Early in this decade, many red states passed laws that permitted teachers to be fired for failing to adhere to newly legislated speech restrictions, including those addressing the teaching of America’s past.

Teachers in Texas, for example, were barred from teaching that slavery and racism are “anything other than deviations from, betrayals of, or failures to live up to, the authentic founding principles of the United States, which include liberty and equality.”

While flamboyantly calling for dismantling the U.S. Department of Education and returning responsibility for education to the states, the Trump administration is announcing, in its requirement that states certify they are not teaching DEI, a dramatic expansion of the role of the federal government into school curricula.

New York State Education Department counsel Daniel Morton-Bentley was the first to issue a defiant reply to the administration’s demands, noting that “there are no federal or state laws prohibiting the principles of DEI.” To date, twenty-four states have heeded Morton-Bentley’s courageous example and stood up to the administration’s bullying.

Opponents of social justice education are already winning the contest of ideas. The administration’s coercions will only inflame America’s divisions and set back the cause of at last equipping every child with a vibrant academic education.

view
NYC high school

Do “climate” surveys measure school performance?

Adam Tyner, Ph.D.
5.15.2025
Flypaper

What matters more when we evaluate a school’s contribution to a child’s future: reading and math test scores or students’ opinions about its academic environment? A new working paper by economists from MIT, Brown, and University of California, Berkeley tackles that question with a unique data set from New York City, the nation’s largest district. The study provides evidence that test-based value-added models are especially informative about a school’s impact on college-going.

Over the past decade, fourteen states and numerous districts have woven student and teacher perception surveys—often termed “school climate” surveys—into their school accountability dashboards. Former New York mayor Bill de Blasio expanded the use of surveys in the school accountability system during his tenure, and New York schools are now required to report aggregated measures of student responses to questions such as whether they “learn a lot from feedback on their work.” These data are then included in the school accountability system and reported publicly alongside academic results. Advocates say the surveys capture critical relational factors missing in standardized tests results, but skeptics argue they are vague, easily gamed, and only weakly tied to long‑term learning.

To test the predictive value of these surveys, the researchers linked three streams of information: aggregated climate survey responses for each school, test‑score value‑added measures at the school level, and student records. By comparing otherwise similar students who happened to attend different schools, the authors isolated each school’s effect on outcomes including on‑time high school graduation, advanced diploma attainment, college entry, and college persistence. Importantly, only test scores were available in a value‑added format; survey data entered the models as simple school averages, lacking any controls or measures of change over time.

The results show that both school climate measures and test score value-added measures can be informative. Yet climate surveys outperform test‑score value‑added only on one outcome: earning a standard Regents diploma. For every more demanding milestone, including advanced diplomas and college-going, test‑score value‑added is a much stronger predictor of a school’s true impact, and survey measures add little once academic gains are taken into account. In other words, a warm school climate may help students clear the minimum graduation bar, but it is sustained academic growth, as measured in this study by test scores, that makes a school more likely to propel students into and through college.

These findings arrive just as New York City begins to publish value‑added indicators for graduation and college enrollment, giving families a clearer view of which schools actually change students’ trajectories. As other jurisdictions debate whether to raise the weight of non‑academic measures in their accountability systems, the evidence suggests that, while climate surveys do capture something real, relying on them alone is a risky strategy if the goal is genuine college readiness.

Reviewed: Joshua Angrist, Peter Hull, Russell Legate-Yang, Parag A. Pathak and Christopher R. Walters, Putting School Surveys to the Test, NBER (2025). https://www.nber.org/papers/w33622.

view

#969: Charters, church, and the Court with Starlee Coleman

5.14.2025
Podcast
 

On this week’s Education Gadfly Show podcast, Starlee Coleman, president and CEO of the National Alliance for Public Charter Schools, joins Mike and David to discuss the religious charter schools case currently before the U. S. Supreme Court. Then, on the Research Minute, Amber shares a study out of Dallas on whether an automatic Algebra enrollment policy boosted participation among underserved students.

Recommended content: 

  • “SCOTUS should mandate state support for religious education, but not via charter schools”—Michael J. Petrilli, Thomas B. Fordham Institute
  • “Supreme Court Case Could Reshape Landscape for Charter and Religious Schools”—Mark Walsh, Education Week
  • “The religious charter schools case is a bigger deal than you think”—Michael J. Petrilli, Thomas B. Fordham Institute
  • “Why SCOTUS should—and will—approve faith-based charter schools”—Andy Smarick, Thomas B. Fordham Institute
  • “Closing the Gaps: An Examination of Early Impacts of Dallas ISD’s Opt-out Policy on Advanced Course Enrollment”—Daniel Vargas Castaño, Dareem K. Antoine, and Trey Miller, EdWorkingPapers (May 2025)

Feedback Welcome: Have ideas for improving our podcast? Send them to Stephanie Distler at [email protected].  

view
Fordham Gadfly image

Cheers and Jeers: May 15, 2025

The Education Gadfly
5.15.2025
Flypaper

Cheers

  • Montgomery County Schools (MD) toughen penalties for student misbehavior. —The Washington Post
  • As school districts shift to dubious “grading for equity” practices, some teachers are pushing back. —The Wall Street Journal
  • Employers are partnering with high schools to recruit students into skilled trades to fight labor shortages. —The Wall Street Journal

Jeers

  • Despite nationwide declining enrollment, public school closures have become increasingly rare. —The 74 Million
  • And, despite a rise in school spending, teacher pay remains stagnant. —Chad Aldeman, The 74 Million
  • This week, the Texas House took the first steps towards eliminating the STAAR standardized test. —The Texas Tribune
view
Fordham Gadfly image

What we’re reading this week: May 15, 2025

The Education Gadfly
5.15.2025
Flypaper
  • Many teachers see Chromebooks as a major source of off-task behavior in class, proving our point. —EdWeek
  • Early data shows school cellphone bans haven't improved behavior or academics and may worsen some issues. —RealClear Investigations
  • School standards have dropped significantly in New York City. Is UFT’s Michael Mulgrew to blame? —Mike Dowd, New York Post
  • As the country becomes more polarized, the focus on learning and academic achievement has been lost. —Dana Goldstein, New York Times
  • Sackets Harbor's community activism pressured ICE and Tom Homan to reconsider deportation policies after a raid detained a local family. —Francis Wilkinson, Bloomberg
  • The House budget bill includes $5 billion for private school scholarships. —EdWeek
Fordham Logo

© 2026 The Thomas B. Fordham Institute
Privacy Policy
Usage Agreement

National

P.O. Box 110
Burke, VA 22009

202.223.5452

[email protected]

Ohio

P.O. Box 82291
Columbus, OH 43202

614.223.1580

[email protected]

Sponsorship

130 West Second Street, Suite 410
Dayton, Ohio 45402

937.227.3368

[email protected]