Mobile Navigation

  • National
    • Policy
      • High Expectations
      • Quality Choices
      • Personalized Pathways
    • Research
    • Commentary
      • Gadfly Newsletter
      • Flypaper Blog
    • Events
    • Scholars Program
  • Ohio
    • Policy
      • Priorities
      • Media & Testimony
    • Research
    • Commentary
      • Ohio Education Gadfly Biweekly
      • Ohio Gadfly Daily
  • Charter Authorizing
    • Application
    • Sponsored Schools
    • Resources
  • About
    • Mission
    • Board
    • Staff
    • Career
Home
Home
Advancing Educational Excellence

Main Navigation

  • National
  • Ohio
  • Charter Authorizing
  • About

National Menu

  • Topics
    • Accountability & Testing
    • Advanced Education
    • Career & Technical Education
    • Charter Schools
    • Curriculum & Instruction
    • ESSA
    • Evidence-Based Learning
    • Facilities
    • Governance
    • Personalized Learning
    • Private School Choice
    • School Finance
    • Standards
    • Teachers & School Leaders
    • Think Again
  • Research
  • Commentary
    • Gadfly Newsletter
    • Flypaper Blog
    • Gadfly Podcast
  • Events
  • Scholars Program

The Education Gadfly Weekly

Sign Up to Receive Fordham Updates

We'll send you quality research, commentary, analysis, and news on the education issues you care about.
Thank you for signing up!
Please check your email to confirm the subscription.

The Education Gadfly Weekly: Growth v. proficiency, the Batman v. Superman of education policy

VOLUME 16, NUMBER 42
10.13.2016
10.13.2016

The Education Gadfly Weekly: Growth v. proficiency, the Batman v. Superman of education policy

VOLUME 16, NUMBER 42
view

Why states should use student growth, and not proficiency rates, when gauging school effectiveness

Our goal with this post is to convince you that continuing to use status measures like proficiency rates to grade schools is misleading and irresponsible—so much so that the results from growth measures ought to count much more—three, five, maybe even nine times more—than proficiency when determining school performance under the Every Student Succeeds Act (ESSA).

Michael J. Petrilli, Aaron Churchill 10.13.2016
NationalFlypaper

Why states should use student growth, and not proficiency rates, when gauging school effectiveness

Michael J. Petrilli | Aaron Churchill
10.13.2016
Flypaper

Disputing Mike and Aaron on ESSA school ratings

Chester E. Finn, Jr. | Chad L. Aldis
10.17.2016
Flypaper

Proficiency vs. growth: Same sport, different game

Robert Pondiscio
10.18.2016
Flypaper

A letter to the editor on the difficulties with student growth measures

10.18.2016
Flypaper

The Batman v Superman edition

10.19.2016
Resource

Evaluating Denver's new proposal for teacher pay

Jamie Davies O'Leary
10.19.2016
Flypaper

The health of America's teacher market

Kirsten Hinck
10.19.2016
Flypaper
view

Disputing Mike and Aaron on ESSA school ratings

Chester E. Finn, Jr., Chad L. Aldis 10.17.2016
Flypaper
view

Proficiency vs. growth: Same sport, different game

Robert Pondiscio 10.18.2016
Flypaper
view

A letter to the editor on the difficulties with student growth measures

10.18.2016
Flypaper
view

The Batman v Superman edition

Michael J. Petrilli, Amber M. Northern, Ph.D., David Griffith, Ph.D., Audrey Kim 10.19.2016
Resource
view

Evaluating Denver's new proposal for teacher pay

Jamie Davies O'Leary 10.19.2016
Flypaper
view

The health of America's teacher market

Kirsten Hinck 10.19.2016
Flypaper
view

Why states should use student growth, and not proficiency rates, when gauging school effectiveness

Michael J. Petrilli | Aaron Churchill
10.13.2016
Flypaper

Our goal with this post is to convince you that continuing to use status measures like proficiency rates to grade schools is misleading and irresponsible—so much so that the results from growth measures ought to count much more—three, five, maybe even nine times more—than proficiency when determining school performance under the Every Student Succeeds Act (ESSA). We draw upon our experience with our home state of Ohio and its current accountability system, which currently generates separate school grades for proficiency and for growth.

We argue three points:

  1. In an era of high standards and tough tests, proficiency rates are correlated with student demographics and prior achievement. If schools are judged predominantly on these rates, almost every high-poverty school will be labeled a failure. That is not only inaccurate and unfair, but it will also demoralize educators and/or hurt the credibility of school accountability systems. In turn, states will be pressured to lower their proficiency standards.
  2. Growth measures—like “value added” or “student growth percentiles”—are a much fairer way to evaluate schools, since they can control for prior achievement and can ascertain progress over the course of the school year. They can also differentiate between high-poverty schools where kids are making steady progress and those where they are not.
  3. In contrast with conventional wisdom, growth models don’t let too many poor-performing schools “off the hook.” Failure rates for high-poverty schools are still high when judged by “value added” or “student growth percentiles”—they just aren’t as ridiculously high as with proficiency rates.

Finally, we tackle a fourth point, addressing the most compelling argument against growth measures:

  1. That schools can score well on growth measures even if their low-income students and/or students of color don’t close gaps in achievement and college-and-career readiness.

(And these arguments are on top of one of the best reasons to support growth models: Because they encourage schools to pay attention to all students, including their high achievers.)

Point #1: Proficiency rates are poor measures of school quality.

States should use proficiency rates cautiously because of their correlation with student demographics and prior achievement—factors that are outside of schools’ control. Let’s illustrate what this looks like in the Buckeye State. One of Ohio’s primary school-quality indicators is its performance index (PI)—essentially, a weighted proficiency measure that awards more credit when students achieve at higher levels. Decades of research have shown the existence of a link between student proficiency and student demographics, and that unfortunate relationship persists today. Chart 1 displays the correlation between PI scores and a school’s proportion of economically disadvantaged (ED) pupils. Schools with more ED students tend to post lower PI scores—and vice-versa.

Chart 1: Relationship between performance index scores and percent economically disadvantaged, Ohio schools, 2015–16
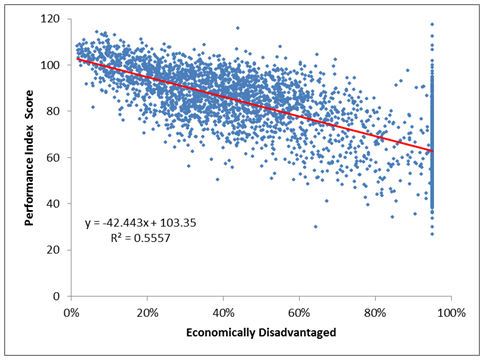
chart showing a descending trend line

Data source: Ohio Department of Education Notes: Each point represents a school’s performance index score and its percentage of economically disadvantaged students. The red line displays the linear relationship between the variables. Several high-poverty districts in Ohio participate in the Community Eligibility Provision program; in turn, all of their students are reported as economically disadvantaged. As a result, some less impoverished schools (in high-poverty districts) are reported as enrolling all ED students, explaining some of the high PI scores in the top right portion of the chart.

Given this strong correlation, it’s not surprising that almost all high-poverty urban schools in Ohio get failing grades on the performance index. In 2015–16, a staggering 93 percent of public schools in Ohio’s eight major cities received a D or F on this measure, including several well-regarded schools (more on those below). Adding to their misery, urban schools received even worse ratings on a couple of Ohio’s other proficiency-based measures, such as its indicators met and annual measureable objectives components. Parents and students should absolutely know whether they are proficient in key subjects—and on track for future success. But that’s a different question from whether their schools should be judged by this standard.

Point #2: Growth measures are truer indicators of school quality.

Because they account for prior achievement, ratings based on student growth are largely independent of demographics. This helps us make better distinctions in the performance of high-poverty schools. Like several other states, Ohio uses a value-added measure developed by the analytics firm SAS. (Other states utilize a similar type of measure called “student growth percentiles.”) When we look at the value-added ratings from Ohio’s urban schools, we see differentiation in performance. Chart 2 below shows a fairer balance across the A-F categories on this measure: 22 percent received an A or B rating; 15 percent received C’s; and 63 percent were assigned a D or F rating.*

Chart 2: Rating distribution of Ohio’s urban schools, performance index versus “value added,” 2015–16
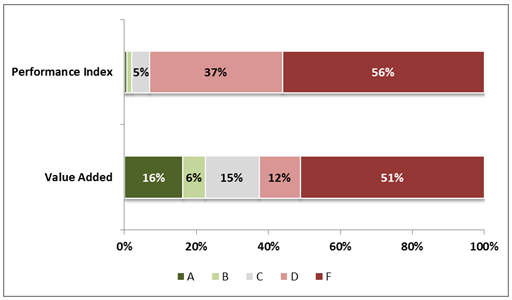
chart showing two bar graphs

*Due to transitions in state tests, Ohio rated schools on just one year of value-added results in 2014–15 and 2015–16 leading to some swings in ratings. In previous years and starting again in 2016–17, the state will use a multi-year average which helps to improve the stability of these ratings.

We suppose one could argue that the performance-index distribution more accurately depicts what is going on in Ohio’s urban schools: Nearly every school, whether district or charter, is failing. Yet we know from experience that this simply isn’t true. Yes, terrible schools exist, but there are also terrific ones whose efforts are best reflected in student growth. In fact, we proudly serve as the charter authorizer for KIPP Columbus and Columbus Collegiate Academy-Main. Both schools have earned an impressive three straight years of value-added ratings of “A,” indicating sustained excellence that is making a big impact in their students’ lives. Yet both of these high-poverty charter schools were assigned Ds on the performance index for 2015–16. That is to say, their students are making impressive gains—catching up, even—but not yet at “grade level” in terms of meeting academic standards. If we as an authorizer relied solely or primarily on PI ratings, these great schools might be shut—wrongly.

Point #3: Growth measures don’t let too many bad schools “off the hook.”

One worry about a growth-centered approach is that it might award honors grades to mediocre or dismal schools. But how often does this occur in the real world? As chart 2 indicates, 63 percent of urban public schools in Ohio received Ds or Fs on the state’s value-added measure last year. In the two previous years, 46 and 39 percent of urban schools were rated D or F. To be sure, fewer high-poverty schools will flunk under value-added as under a proficiency measure. But a well-designed growth-centered system will identify a considerable number of chronically underperforming schools, as indeed it should.

Point #4: It’s true that schools can score well on growth measures even if their low-income students and/or students of color don’t close gaps in achievement and college-and-career readiness. But let’s not shoot the messenger.

Probably the strongest argument against using growth models as the centerpiece of accountability systems is that they don’t expect “enough” growth, especially for poor kids and kids of color. The Education Trust, for example, is urging states to use caution in choosing “comparative” growth models, including growth percentiles and value-added measures, because they don’t tell us whether students are making enough progress to hit the college-ready target by the end of high school, or whether low-performing subgroups are making fast enough gains to close achievement gaps. And that much is true. But let’s keep this in mind: Closing the achievement gap, or readying disadvantaged students for college, is not a one-year “fix.” It takes steady progress—and gains accumulated over time—for lower-achieving students to draw even with their peers. An analysis of Colorado’s highest-performing schools, for example, found that the trajectory of learning gains for the lowest-performing students simply wasn’t fast enough to reach the high standard of college readiness. An article by Harvard’s Tom Kane reports that the wildly successful Boston charter schools cut the black-white achievement gap by roughly one-fifth each year in reading and one-third in math. So even in the most extraordinary academic environments, disadvantaged students may need many years to draw even with their peers (and perhaps longer to meet a high college-ready bar). That is sobering indeed.

We should certainly encourage innovation in growth modelling—and state accountability—that can generate more transparent results on “how much” growth is happening in a school and whether such growth is “enough.” But the first step is accepting that student growth is the right yardstick, not status measures. And the second step is to be realistic about how much growth on an annual basis is humanly possible, even in the very best schools.

***

Using proficiency rates to rate high-poverty schools is an unfair practice to schools that has real-world consequences. Not only does this policy give the false impression that practically all high-poverty schools are ineffective, but it also demeans educators in high-needs schools who are working hard to advance student learning. Plus, it actually weakens the accountability spotlight on the truly bad high-poverty schools, since they cannot be distinguished from the strong ones. Moreover, it can lead to unintended consequences such as shutting schools that are actually benefitting students (as measured by growth), discouraging new-school startups in needy communities (if social entrepreneurs believe that “failure” is inevitable), or thwarting the replication of high-performing urban schools. Lastly, assigning universally low ratings to virtually all high-poverty schools could breed resentment and pushback, pressuring policy makers to water down proficiency standards or easing up on accountability as a whole.

Growth measures won’t magically ensure that all students reach college and career readiness by the end of high school, or close our yawning achievement gaps. But they do offer a clearer picture of which schools are making a difference in their students’ academic lives, allowing policy makers and families to better distinguish the school lemons from peaches. If this information is put to use, students should have more opportunities to reach their lofty goals. Measures of school quality should be challenging, yes, but also fair and credible. Growth percentiles and value-added measures meet those standards. Proficiency rates simply do not. And states should keep that in mind when deciding how much weight to give to these various indicators when determining school grades.


view

Disputing Mike and Aaron on ESSA school ratings

Chester E. Finn, Jr. | Chad L. Aldis
10.17.2016
Flypaper

The central problem with making growth the polestar of accountability systems, as Mike and Aaron argue, is that it is only convincing if one is rating schools from the perspective of a charter authorizer or local superintendent who wants to know whether a given school is boosting the achievement of its pupils, worsening their achievement, or holding it in some kind of steady state. To parents choosing among schools, to families deciding where to live, to taxpayers attempting to gauge the ROI on schools they’re supporting, and to policy makers concerned with big-picture questions such as how their education system is doing when compared with those in another city, state, or country, that information is only marginally helpful—and potentially quite misleading.

Worse still, it’s potentially very misleading to the kids who attend a given school and to their parents, as it can immerse them in a Lake Wobegon of complacency and false reality.

It’s certainly true, as Mike and Aaron say, that achievement tends to correlate with family wealth and with prior academic achievement. It’s therefore also true that judging a school’s effectiveness entirely on the basis of its students’ achievement as measured on test scores is unfair because, yes, a given school full of poor kids might be moving them ahead more than another school (with higher scores) and a population of rich kids. Indeed, the latter might be adding little or no value. (Recall the old jest about Harvard: Its curriculum is fine and its faculty is strong but what really explains its reputation is its admissions office.)

It’s further true that to judge a school simply on the basis of how many of its pupils clear a fixed “proficiency” bar, or because its “performance index” (in Ohio terms) gets above a certain level, not only fails to signal whether that school is adding value to its students but also neglects whatever is or isn’t being learned by (or taught to) the high achievers who had already cleared that bar when they arrived in school.

Yes, yes and yes. We can travel this far down the path with Mike and Aaron. But no farther.

Try this thought experiment. You’re evaluating swim coaches. One of them starts with kids most of whom already know how to swim and, after a few lessons, they’re all making it to the end of the pool. The other coach starts with aquatic newbies and, after a few lessons, some are getting across but most are foundering mid-pool and a few have drowned. Which is the better coach? What grade would you give the second one?

Now try this one. You’re evaluating two business schools. One enrolls upper middle class students who emerge—with or without having learned much—and join successful firms or start successful new enterprises of their own. The other enrolls disadvantaged students, works very hard to educate them, but after graduating most of them fail to get decent jobs and many of their start-up ventures end in bankruptcy. Which is the better business school? What grade would you give the second one?

The point, obviously, is that a school’s (or teacher’s or coach’s) results matter in the real world, more even than the gains its students made while enrolled there. A swim coach whose pupils drown is not a good coach. A business school whose graduates can’t get good jobs or start successful enterprises is not a business school that deserves much praise. Nor, if you were selecting a swim coach or business school for yourself or your loved one, would you—should you—opt for one whose former charges can’t make it in the real world.

Public education exists in the real world, too, and EdTrust is right that we ought not to signal satisfaction with schools whose graduates aren’t ready to succeed in what follows when those schools have done what they can.

Mike and Aaron are trying so hard to find a way to heap praise on schools that “add value” to their pupils that they risk leaving the real world in which those pupils will one day attempt to survive, even to thrive.

Sure, schools whose students show “growth” while enrolled there deserve one kind of praise—and schools that cannot demonstrate growth don’t deserve that kind of praise. But we mustn’t signal to students, parents, educators, taxpayers or policymakers that we are in any way content with schools that show growth if their students aren’t also ready for what follows.

Yes, school ratings should incorporate both proficiency and growth but should they, as Mike and Aaron urge, give far heavier weight to growth? A better course for states is to defy the federal Education Department’s push for a single rating for schools and give every school at least two grades, one for proficiency and one for growth. The former should, in fact, incorporate both proficiency and advanced achievement, and the latter should take pains to calculate growth by all students, not just those “growing toward proficiency.” Neither is a simple calculation—growth being far trickier—but better to have both than to amalgamate them in a single less revealing grade or adjective. Don’t you know quite a bit more than you need to know about a school when you learn that it deserves an A for proficiency and a C for growth—or vice versa—than simply to learn that it got a B? On reflection, how impressed are you by a high school—especially a high school—that looks good on growth metrics but leaves its graduates (and, worse, its dropouts) ill-prepared for what comes next? (Mike and Aaron agree with us that giving a school two—or more—grades is more revealing than single consolidated rating.)

We will not here get into the many technical problems with measures of achievement growth—they can be significant—and we surely don’t suggest that school ratings and evaluations should be based entirely on test scores, no matter how those are sliced and diced. People need to know tons of other things about schools before legitimately judging or comparing them. Our immediate point is simply that Mike and Aaron are half-right. It’s the half that would let kids drown in Lake Wobegon that we protest.

view

Proficiency vs. growth: Same sport, different game

Robert Pondiscio
10.18.2016
Flypaper

The University of Mount Union in Alliance, Ohio is home to one of the most successful college football programs in America. The Purple Raiders have won twelve national championships since 1993 and have appeared in the title game eleven years in a row—a record of excellence matched by few collegiate teams in any sport.

If you’re wondering why you’ve never heard of Mount Union, why they’re not mentioned in the same breath as football powerhouses like Alabama, Notre Dame or Ohio State, which has only one national championship in the last ten years, you’re not alone. It’s because Mount Union plays in Division III. They are not in the same league, literally, as the big Division I teams chasing bowl berths and the chance to be crowned national champs on New Year’s Day.

Mount Union and Ohio State both play football, but it’s barely the same game. If Mount Union were to square off against even a mediocre Division I football team, it would almost certainly be crushed. If your sights are set on a career in the NFL, there is a long list of Ohio schools that offer you better odds. Not just Ohio State, which had fifty-six alumni in the NFL at the start of the season: Miami, Ohio U., Cincinnati, and Akron all have more alumni in the pros than Mount Union, which has four.

I don’t know if my Fordham colleagues Mike Petrilli and Aaron Churchill are college football fans. But their effort to valorize academic growth over proficiency as a means of rating K–12 schools makes as little sense as arguing that Mount Union is just as good as Ohio State. Both can claim to host top-ranked football programs, but even casual fans would reject the comparison as pointless. Nothing about the two teams, from the athletes they attract to the money that goes into their respective programs, is remotely comparable. It wouldn’t even occur to most of us to try.

Mike and Aaron are of course correct to state that “proficiency rates are correlated with student demographics and prior achievement.” (Size, speed, and demonstrated talent are pretty much what separates those who play football for Ohio State from Mount Union, come to think of it.) It is also true that “if schools are judged predominantly on these rates, almost every high-poverty school will be labeled a failure.” This, they insist, will “demoralize educators and/or hurt the credibility of school accountability systems.” But back to my football analogy: any accountability system that seeks to compare Mount Union and Ohio State doesn’t deserve credibility. It’s not a serious comparison. The way to avoid unfair comparisons is by not making them in the first place.

To be clear, I am not in any way accountability-averse. Parents need to know if their children are attending a decent school and taxpayers are entitled to know if their tax dollars are being spent well or poorly. But the need to assign a letter grade to a school—and to make those grades “fair” to those who work in them by avoiding “unfair” comparisons—is not an education problem, it’s a political problem. The real world judges students by proficiency. It just won’t do to acknowledge that it’s correlated with student demographics, then ignore that when it comes to evaluating schools.

Early in my teaching career I spent a couple of days at one of New York City’s best private girls’ schools—the kind that wealthy Manhattanites would knife each other to get their kids into in order to set them on the path to the Ivy League and beyond. I sat in a fourth-grade classroom one morning and listened as the girls read aloud stories they had written retelling the story of Noah’s Ark from the perspective of one of the animals. The first girl got up to read her work. It was clever and well-written, and I had two immediate thoughts: the first was that even the best writers among my fifth-grade students in a nearby struggling public school couldn’t come close to producing what this fourth grader had penned. My second thought was, “It’s gonna’ suck to be the girl who has to read her piece next.”

Wrong. The next student blew the first away. And the third was even better still. Sharp characterization. Sitcom-quality dialogue. Witty observations. And after each paper was presented, the girls in the class offered praise to each writer along with smart and substantial suggestions for improving her story. I was agog. Later, I debriefed with the teacher and complimented her on the first-rate reader’s workshop class I had just witnessed. She shot me a quizzical look. I briefly explained the process-writing pedagogy I was learning to implement in my classroom, two subway stops and a world away in the South Bronx: brainstorming, drafting, peer editing, conferencing, and revising. My kids would typically spend four to six weeks on an assignment, starting by gathering “seed ideas” in their writer’s notebooks and concluding with a “publishing party,” where the class shared their finished work. Wasn’t this what I was just watching?

Another quizzical look. “That was their homework,” she said.

Later, meeting with my host, the head of the lower school, I told her, “Here is what you and I have in common. Every morning we go to work in a place called a school. And that’s about it.” An overstatement, but not much of one. I was spending most of my time on classroom management and dealing with behavior problems. In the entire day at the private girls’ school, I’d seen only one corrective action. A fifth-grade teacher asked a sleepy student to take her head off her desk.

An early lesson for a new teacher, but it stuck. We may all be holding footballs but we are not playing the same game. Sure, I could content myself with the growth my kids might be making. But in the very near future, my students would be competing with those other girls and many others—for college admissions, jobs, and other opportunities. If my students or their parents were told by people like me that they were attending an “A” rated school, we’d be doing them an enormous disservice. We’d be lying to them.

Perhaps the answer is to break schools into leagues or divisions for the purposes of ratings and comparisons, just like we do for sports. But let’s not pretend for a second that we can compare unlike schools and student populations simply because it makes us feel better or solves a political problem to do so. We’re not all playing the same game.

view

A letter to the editor on the difficulties with student growth measures

10.18.2016
Flypaper

NOTE: The publication of a recent Flypaper post arguing that growth measures (like “value added” or “student growth percentiles”) are a fairer way to evaluate schools than are proficiency measures drew quick reaction both inside and outside of Fordham. Here we present a "letter to the editor" in response to the initial blog post, lightly edited.

To the editors:

I find your argument that state accountability systems should increase the weight of growth indicators, as against proficiency indicators, perplexing. Here is a summary as to why.

The most basic difficulty with the growth models you recommend is this: they attempt to estimate a school’s average contribution to students’ achievement based on past achievement within a given state and a comparison group in that state. Such a growth measure is norm-based rather than criteria-based, i.e., relative to other students in other schools as opposed to an external standard. Assigning such a heavy weight to relative growth may end up removing a school from funding and other support even if its students perform far more poorly than students in schools that would be identified for intervention.  

To focus on the details: The first problem in your recommendation is its lack of specificity. You suggest that states use growth models in their accountability systems “three, five, maybe even nine times more…than proficiency.” Given this vast range, modeling of what these different weightings might mean in identifying schools would have been helpful, even essential, because the differences will have important implications as to which schools are identified under your proposed framework. For example, take a school serving high-needs children that has achieved very high proficiency rates but shows low growth. Is this truly a low performing school? Should this school receive interventions and scarce Title I resources from the federal government?

Second, given the large weight you want to give to growth models, it would have been important to address serious technical issues. Top of the list: school-level, value-added scores vary greatly year-to-year—much more so than do academic performance levels. You owe your readers data on this issue. (For the stability of teacher estimates, see for example: McCaffrey et al., 2009 and Goldhaber & Hansen, 2008.) How would you address this? Should states use multiple-year averages? Without such details, states simply cannot follow your recommendation.

The third problem with this approach is the opportunity cost. We don’t need to think about growth measures as you propose but could, instead, use this opportunity to set clear, criterion-based standards for student achievement through the use of “Growth to Standard.” Such an indicator would be informative as to how much progress (or not) students have made towards an external standard set by the state, such as college and career readiness. States could include this element in their accountability systems, comparing the Growth to Standard for each demographic subgroup of students, and for ELL, Special Needs, or economically disadvantaged students; indeed, ESSA requires precisely that data for any state-chosen indicator. Although some would argue that such a Growth to Standard measure might be calibrated to a single, perhaps quite low, standard such as “proficiency,” the state model can, and should, be built to benchmark growth to an externally validated standard for college readiness and an advanced standard beyond that to capture the performance of truly well-educated/talented students.

Even here I recommend that a state accountability system use a modest weighting of the growth measure versus academic performance. However, a Growth to Standard framework at least tells parents something concrete about their child. Parental interest is surely focused on understanding where his or her own child really stands in terms of readiness for further education and lifetime opportunities, rather than on a comparison with other, perhaps equally unprepared, students.

The Minnesota Department of Education, in explaining growth scores, nails it: “The growth score codes of Low, Medium, and High do not represent whether a student has learned less than, about a year, or more than a year’s worth of material. There is no clear relationship between growth z-scores and information learned” (emphasis in the original).

Sincerely,

David Steiner

David Steiner is executive director of the Johns Hopkins Institute for Education Policy and a professor in the School of Education at Johns Hopkins.

References:

Goldhaber, D. D., & Hansen, M. (2008). Is it Just a Bad Class? Assessing the Stability of Measured Teacher Performance. Center on Reinventing Public Education.

McCaffrey, D. F., Sass, T. R., Lockwood, J. R., & Mihaly, K. (2009). The intertemporal variability of teacher effect estimates. Education, 4 (4), 572-606.

Minnesota Department of Education, Growth Data Help Document.

view

The Batman v Superman edition

10.19.2016
Resource

On this week’s podcast, Mike Petrilli, Alyssa Schwenk, and David Griffith discuss the titanic tussle between two tendentious tenets of school success measurement occurring among the mighty minds of Fordham and spilling out into the greater world. It’s proficiency vs. student growth. KA-THOOOOM! On the Research Minute, Amber tackles an early grade retention policy in Florida.

Amber's Research Minute

Christina LiCalsi, Umut Özek, and David Figlio, "The Uneven Implementation of Universal School Policies: Maternal Education and Flordia's Mandatory Grade Retention Policy," CALDER (September 2016).

view

Evaluating Denver's new proposal for teacher pay

Jamie Davies O'Leary
10.19.2016
Flypaper

This report from A+ Colorado examines Denver’s ProComp (Professional Compensation System for Teachers), a system forged collaboratively between the district and teachers union in 2005 that was on the vanguard of reforming teacher pay scales. The analysis is timely for Denver Public Schools and the Denver Classroom Teachers Association, who are back at the negotiating table (the current agreement expires in December 2017).

The A+ report outlines the urgency of getting ProComp’s next iteration right. Denver loses about half of newly-hired teachers within the first three years—a turnover rate that is costly not only for the district, which must recruit, hire, and train new teachers, but for the students who are taught by inexperienced educators (research shows that effectiveness increases greatly in the first five years). Denver Public Schools also faces another challenge in that Denver’s cost of living has increased sharply. The report notes that more than half of all renters face “serious cost burdens,” meaning they spend more than 30 percent of income on housing. The situation is worse for homeowners or would-be homeowners. Thus, ProComp is a critical part of “making DPS an attractive place to teach.” 

ProComp was revolutionary at its outset. Funded in part through an annual $25 million property tax increase (the cost for the entire system is a sizeable $330 million for 4,300 teachers), it aimed to reward teachers working in hard-to-staff positions and schools, as well as those demonstrating instructional effectiveness, measured in part by student test scores. The average teacher salary change in a given year looks markedly different under ProComp than in traditional pay systems. Last year, teachers received an average $1,444 cost of living increase, $1,253 increase in base pay, and $4,914 bonus through one-time incentives. Yet A+ finds that the system still “strongly tracks with experience” and that “teacher pay only looks modestly different than it would under a more traditional salary schedule.” That’s because ProComp maintains traditional “steps” for salary based on teachers’ years of experience and credentials. Increases to base pay are determined by negotiated cost of living increases, as well as meeting ProComp objectives. One-time bonuses are available for serving in hard-to-serve schools, boosting student test scores, or working in a high-performing or high-growth school. Denver’s teachers, when surveyed, perceived ProComp as a repackaging of the same salary as “salary plus bonuses” in exchange for extra work.

A+ finds that despite the intentions and theory of change behind ProComp, to incentivize and reward teachers and ultimately drive student achievement, studies have shown mixed results to date. While the Center for Education Data and Research found small positive effects on student achievement pre- and post-ProComp, that study couldn’t prove causality. A+ concludes that it’s “hard to prove any measurable student achievement gains attributable to ProComp.” Another study from Harvard University found that teachers with students attaining the top and lowest levels of math growth earned about the same.

Even the $25 million pot of money—just 8 percent of the district’s total spending on teacher pay—isn’t targeted to reward individual teachers for effectiveness. In 2015–16, 27 percent of these one-time dollars were allocated for market incentives. Ten percent went to teachers who gained additional education, while 52 percent were aligned to student outcomes—but mostly at the building level. The authors further find that the system is difficult for teachers to understand—a “hodgepodge of incentives” in desperate need of being streamlined and better aligned to solving district challenges. 

Toward that end, A+ makes good recommendations for improving Denver’s system: 1) “Front load” the salary schedule dramatically, awarding 10 percent increases in the first five years (with 1 percent increases thereafter, up to year fifteen); 2) Streamline salary increases and prioritize expertise, specifically by offering two lanes based on education level, instead of seven, and allow subject-matter experts to earn more; 3) Increase pay for teachers teaching in, and returning to, the highest-need schools; 4) Allow for base pay increases, rather than stipends, for taking on leadership roles, thereby better aligning pay with one’s career ladder; 5) reward high performance among teachers individually, either through more bonuses or additional promotional opportunities, to leadership roles and advances on the salary ladder.

Perhaps the most valuable contribution this report makes is a powerful reminder that ProComp (and any teacher pay system, for that matter) should be aligned with district goals. If Denver wants to mitigate teacher turnover, its pay scale must do more to incentivize teachers to stay at earlier points in their careers. The brief is also pertinent nationally. As the breakdown of Cleveland’s promising teacher pay system reminds us, challenge lies in not only crafting innovative pay systems but sustaining them over the long haul. In that respect, there’s a lot to learn from Denver’s eleven-year-old program.

SOURCE: A+ Colorado, “A Fair Share: A New Proposal for Teacher Pay in Denver” (September 2016).

view

The health of America's teacher market

Kirsten Hinck
10.19.2016
Flypaper

A new study by the Learning Policy Institute examines past and current trends in the teacher workforce to predict future educator supply levels. The study also examines motivations behind teacher attrition and suggests several policy options to mitigate the effects of teacher shortages.

The report pulls from several databases to analyze the current teaching job market. Using data from 2011–12 and 2012–13, it predicts trends in teacher supply and demand levels through the year 2025 and argues that shortages will sharply increase over the next ten years. While LPI’s study provides valuable information, the authors caution that their predictions cannot take into account future policy decisions, changes in the economy, or other unforeseeable events.

During the Great Recession, demand for teachers decreased as class sizes expanded and teaching vacancies went unfilled due to large cuts in school budgets. By 2014, however, demand quickly began to rise—schools started to return to pre-recession teacher-pupil ratios, programs cut during the recession were restored, and student enrollment levels were predicted to grow after remaining stagnant for several years. Since then, districts have struggled to find enough teachers to staff their schools. Rural schools as well as schools with high-minority and high-poverty student populations report finding it especially difficult to hire and retain qualified teachers. The report estimates that over the next ten years, the demand for qualified teachers will rise to unprecedented levels, and by 2025 nearly 316,000 teachers will be needed to fill our schools—almost double the demand in 2012.

Obviously, increased demand for teachers wouldn’t be an issue if the supply of educators also increased. Unfortunately, the report finds that the number of potential teachers available to fill classroom vacancies has steadily declined since 2009 and will continue to drop in future years. Between 2009 and 2014, enrollment in traditional teacher preparation programs decreased by 35 percent. While this decline is predicted to slow, it is unlikely that enrollment numbers will ever return to pre-2009 levels. At this rate, supply levels have no chance of catching up with the increasing demand for qualified teachers.

The authors identify attrition—specifically pre-retirement attrition—as the number-one cause of teacher shortages. LPI reports that of the 238,310 teachers who exited the profession in 2011–2012, about two-thirds of those left to find jobs in other industries. Only 31 percent of exiting teachers list retirement as their main motivation for leaving. The majority leave due to job dissatisfaction, career changes, personal needs, or the desire for a higher salary and better benefits.

The report suggests four long-term policy solutions that will attract new teachers, retain current teachers, and over time resolve the teacher demand and supply imbalance.

  1. Provide teachers with extra incentives and more competitive compensation packages.
  2. Increase teacher education opportunities and make education programs more affordable.
  3. Increase teacher retention through mentoring programs and improved work environments.
  4. Develop a national labor market that supports teacher mobility and draws attention to districts where qualified teachers are needed.

LPI’s report draws attention to an important issue. However, to put it mildly, not all education policy organizations agree with LPI’s conclusions. The National Council on Teacher Quality argues that painting teacher shortages as a national issue diverts attention from localized teacher supply needs. NCTQ explains that rather than facing a national teacher shortage, teacher shortages are found within specific disciplines (STEM and special education, for example) and in specific geographic regions. Meanwhile, in many states, other teaching areas—such as elementary education—report a surplus of teachers entering the profession every year.

Furthermore, Chad Aldeman, a principal at Bellwether Education Partners, questions LPI’s estimates of the current and future national teacher supply. The lack of a national labor market for teachers makes it incredibly difficult to estimate the demand for teachers nationwide. Aldeman argues that national statistics aren’t helpful in determining local demand for teachers because each state—and many districts and schools—have a unique set of qualifications and requirements for its educators.

Although teacher shortages are far from a myth, the notion that we are approaching a national teacher supply crisis may very well be. If policymakers focus their attention on preventing a possible impending shortage at the national level, then their efforts will be diverted from the real issue—shortages in schools that are underfunded and in rural areas and shortages within specific disciplines. The solutions that LPI suggests would be much more effective if implemented in individual schools and districts—not nationwide. Teacher shortage is certainly an issue that needs to be addressed, but let’s focus on creating local solutions rather than predicting a national catastrophe.

SOURCE: Leib Sutcher, Linda Darling-Hammond, and Desiree Carver-Thomas, “A Coming Crisis in Teaching? Teacher Supply, Demand, and Shortages in the U.S.,” Learning Policy Institute (September 2016).

Fordham Logo

© 2026 The Thomas B. Fordham Institute
Privacy Policy
Usage Agreement

National

P.O. Box 110
Burke, VA 22009

202.223.5452

[email protected]

Ohio

P.O. Box 82291
Columbus, OH 43202

614.223.1580

[email protected]

Sponsorship

130 West Second Street, Suite 410
Dayton, Ohio 45402

937.227.3368

[email protected]