Mobile Navigation

  • National
    • Policy
      • High Expectations
      • Quality Choices
      • Personalized Pathways
    • Research
    • Commentary
      • Gadfly Newsletter
      • Flypaper Blog
    • Events
    • Scholars Program
  • Ohio
    • Policy
      • Priorities
      • Media & Testimony
    • Research
    • Commentary
      • Ohio Education Gadfly Biweekly
      • Ohio Gadfly Daily
  • Charter Authorizing
    • Application
    • Sponsored Schools
    • Resources
  • About
    • Mission
    • Board
    • Staff
    • Career
Home
Home
Advancing Educational Excellence

Main Navigation

  • National
  • Ohio
  • Charter Authorizing
  • About

National Menu

  • Topics
    • Accountability & Testing
    • Advanced Education
    • Career & Technical Education
    • Charter Schools
    • Curriculum & Instruction
    • ESSA
    • Evidence-Based Learning
    • Facilities
    • Governance
    • Personalized Learning
    • Private School Choice
    • School Finance
    • Standards
    • Teachers & School Leaders
    • Think Again
  • Research
  • Commentary
    • Gadfly Newsletter
    • Flypaper Blog
    • Gadfly Podcast
  • Events
  • Scholars Program

The Education Gadfly Weekly

Sign Up to Receive Fordham Updates

We'll send you quality research, commentary, analysis, and news on the education issues you care about.
Thank you for signing up!
Please check your email to confirm the subscription.

The Education Gadfly Weekly: The college-going rate is down. Here’s hoping it falls even further.

Volume 23, Number 30
7.27.2023
7.27.2023

The Education Gadfly Weekly: The college-going rate is down. Here’s hoping it falls even further.

Volume 23, Number 30
view
High Expectations

The college-going rate is down. Here’s hoping it falls even further.

One of the biggest shifts in education in recent years has been a gradual move away from the “college for all” mantra, and hard numbers show a concurrent decline in the proportion of high school students matriculating directly to college. Far from something to deplore, this trend is a positive development—but only so long as the right teenagers are choosing to enter the labor market rather than pursue college.

Michael J. Petrilli 7.27.2023
NationalFlypaper

The college-going rate is down. Here’s hoping it falls even further.

Michael J. Petrilli
7.27.2023
Flypaper

It’s time to dump Reading Recovery

Aaron Churchill
7.27.2023
Flypaper

Open enrollment might save suburban schools, not destroy them

Garion Frankel
7.27.2023
Flypaper

A fifty-state analysis of non-district students’ access to district-provided services

Jeff Murray
7.25.2023
Ohio Gadfly Daily

Cheers and Jeers: July 27, 2023

The Education Gadfly
7.27.2023
Flypaper

What we're reading this week: July 27, 2023

The Education Gadfly
7.27.2023
Flypaper
view

It’s time to dump Reading Recovery

Aaron Churchill 7.27.2023
Flypaper
view

Open enrollment might save suburban schools, not destroy them

Garion Frankel 7.27.2023
Flypaper
view
Public-Education-Your-Way-Report SR image

A fifty-state analysis of non-district students’ access to district-provided services

Jeff Murray 7.25.2023
Ohio Gadfly Daily

view

Cheers and Jeers: July 27, 2023

The Education Gadfly 7.27.2023
Flypaper
view

What we're reading this week: July 27, 2023

The Education Gadfly 7.27.2023
Flypaper
view

The college-going rate is down. Here’s hoping it falls even further.

Michael J. Petrilli
7.27.2023
Flypaper

One of the biggest shifts in recent years—within the education policy community, but also the larger culture—has been a gradual move away from the “college for all” mantra. And it’s not just in the ephemera of mindsets and beliefs. Hard numbers show a marked decline in the proportion of high school students matriculating directly to college. As the Wall Street Journal reported in May, “More high-school graduates are being diverted from college campuses by brighter prospects for blue-collar jobs in a historically strong labor market for less-educated workers.”

Far from something to deplore, this trend is a positive development—but only so long as the right teenagers are choosing to enter the labor market rather than pursue college. No, “right” isn’t coded language for race or class. I have in mind individual students, and the question of whether they are likely to succeed in—and complete—postsecondary education. That’s a critical question because we know that higher education usually pays off—but only for students that exit college with degrees or other valuable credentials.

If Jack is good at school, with decent grades and pretty good test scores, and he’s got the motivation to keep at it, going to college is a solid bet. But Jill, who struggles in school, with mediocre or worse grades and below-average test scores, is a tougher case. With the right support, she might turn out to be a late bloomer and could succeed in higher education. But more likely, she will give it a try and then struggle, just as she did in high school, then drop out with nothing but debt and regret. She would have been better off taking a full-time job, and using that to grow her skill set. (It would have been even better had Jill had the chance to do high-quality career and technical education while still in high school, to give her momentum toward a valuable career.)

It would be great to know, then, whether the national decline in college-going represents a lot of Jacks or a lot of Jills. Sadly, I’m not aware of any study that’s looked at that question. What we can do, though, is glimpse at the aggregate and put the college-going rates in context. Specifically: How do these rates compare to college readiness and college-completion rates?

I’ve performed simple analyses like this a few times before, but not since the college-going rate started its precipitous decline.

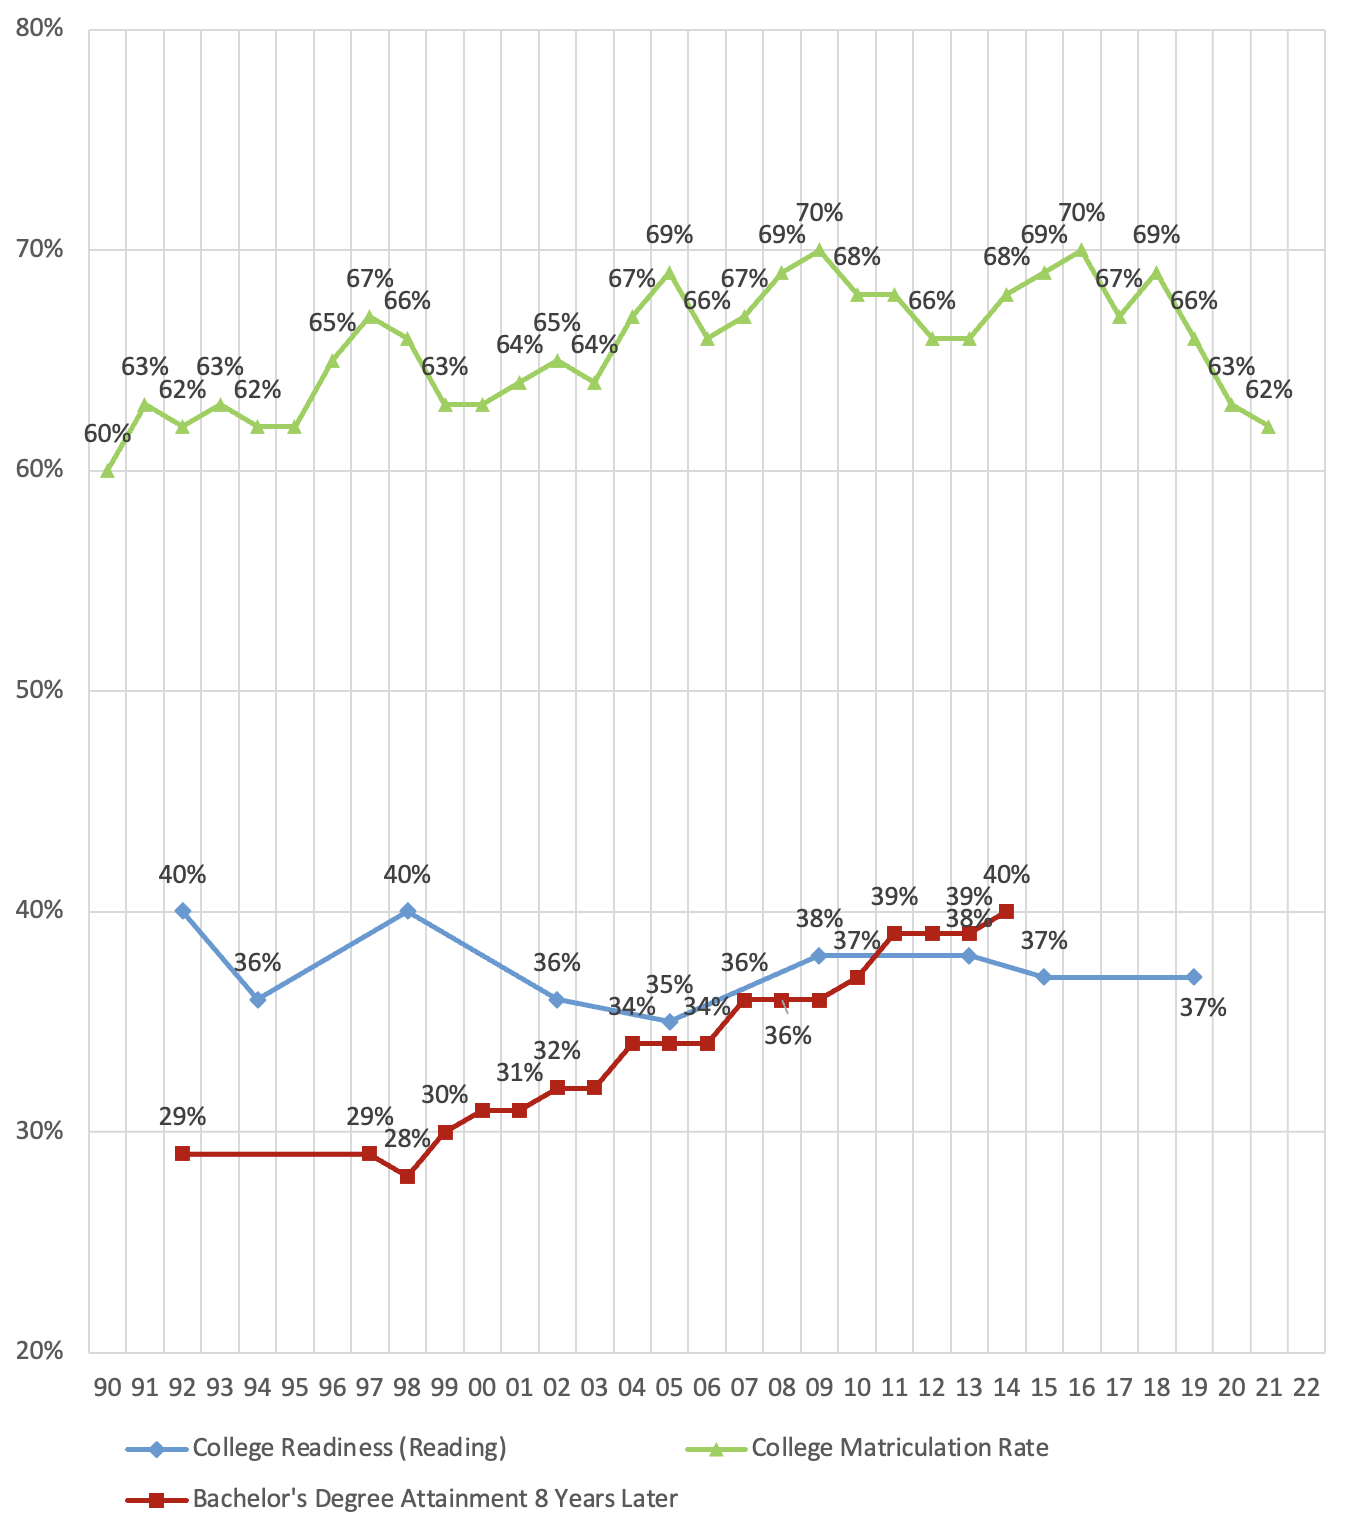
Chart 1 displays the percentage of twelfth-graders in a given high school graduating class who reached the National Assessment’s “college-prepared” level in reading over the past three decades, which, according to the National Assessment Governing Board, equates to “proficient.”

Chart 1 also shows the percentage of students in that same high school graduating class who matriculated directly to college, as well as the percentage of that class that eventually graduated with bachelor’s degrees within eight years. The most recent college completion data come from 2022, for the high school class of 2014. See the notes at the end of this post for data sources.

Chart 1: College preparedness, college matriculation, and college completion
1

What we can see here, for example, is that 40 percent of the high school graduating class of 1992 scored at the college-ready level in reading; 62 percent of this class matriculated directly to college; and 29 percent completed a four-year degree. More recently, 38 percent of the high school graduating class of 2013 scored at the college-ready level in reading; 66 percent of this class matriculated directly to college; and 39 percent completed a four-year degree.

There’s good and bad news here. The good news is the incredible increase in the proportion of young Americans completing at least a bachelor’s degree—10 percentage points over two decades, or an increase of about a third in real numbers. Even if some of this represents “degree inflation,” that’s substantial, life-changing progress.

The bad news is twofold. First, over the entire time series, our college-matriculation rate is much higher than our college-readiness rate. This means that almost a million students every year have been heading to postsecondary education even though they weren’t college ready. That’s a lot of Jills—and a lot of student debt.

Second, though it has bounced around a bit, our college-readiness rate has been essentially flat for more than three decades. And that was before the pandemic. When the next batch of twelfth grade scores are released, they will surely be lower than what we see here.

And what to make of the most recent trends? Starting with the high school class of 2011, we see the college-completion rate nudging ahead of the college readiness rate. What that means is that some students who weren’t college-ready, at least according to NAEP’s benchmark for reading, still managed to get four-year degrees.

The positive read is that these underprepared students worked hard, and perhaps their colleges did too, beating the odds, and proving that NAEP’s college-ready measure shouldn’t be taken as too definitive. The negative take is that college standards may have dropped to such a point that even students who struggle with reading comprehension can earn a four-year diploma. On balance, though, it seems to me that college readiness will likely continue to place an upper bound (even if it not a firm one) on college completion. If we want more kids to graduate from college, our K–12 system needs to get more students ready for college. And post-pandemic, we are instead heading in the opposite direction.

As for the recent declines in the college-matriculation rate, they are significant and may actually be encouraging—again, provided that the kids newly forgoing college are Jills and not Jacks. And it’s clear that there’s still a considerable distance for the college-going rate to fall, if we only want students who are college-ready (or close to it) to give postsecondary education a try. The gap between our most recent college-matriculation rate (62 percent) and our most recent college readiness rate (37 percent) is a whopping 25 points. That’s down significantly from 2009, during a terrible labor market, when 70 percent of high school graduates went straight to college. But that gap could be, and should be, much smaller.

Education has a terrible habit of swinging from one extreme to another. Here’s hoping that, when it comes to the question of college versus career, we can avoid making that mistake. The numbers here demonstrate the need for a “college for all students who are ready to succeed in it” movement. Who’s in?

Sources:

The college matriculation numbers come from the National Center for Education Statistic,’ Digest of Education Statistics, Table 302.20.  

In reading, the National Assessment Government Board estimates that “college-prepared” is equivalent to “proficient.” So these numbers are the percentage of all twelfth-grade students who were proficient in reading in those given years. 

Bachelor’s degree completion numbers come from the Digest of Education Statistics, Table 104.20: “Percentage of persons twenty-five to twenty-nine years old with selected levels of educational attainment, by race/ethnicity and sex: Selected years, 1920 through 2022.

Special thanks to Meredith Coffey and Jamya Davis, research interns at the Thomas B. Fordham Institute, for collecting these data.


view

It’s time to dump Reading Recovery

Aaron Churchill
7.27.2023
Flypaper

This month, Ohio joined a growing list of states and school systems that require schools to use high-quality instructional materials aligned to the science of reading, an approach to reading instruction that emphasizes phonics for building foundational literacy skills and knowledge-rich curricula to support vocabulary and comprehension. The Buckeye state also explicitly prohibited three-cueing—a discredited instructional method, also barred elsewhere, that wrongly encourages children to guess at words rather than sounding them out.

With the legislation on the books, Ohio will now turn to implementation. If done well, the state will become a model for how leaders across the country can rigorously implement a science of reading law. One key step for Ohio—and other locales looking to strengthen literacy—is creating a catalog of approved curricula that only includes the good stuff.

In the area of core reading instruction, a number of excellent options should sail through Ohio’s approval process (e.g., Core Knowledge, Wit and Wisdom, and EL Education). And one hopes that flawed curricula such as Fountas & Pinnell’s Classroom and Lucy Calkins’s Units of Study are kept off the list.

Yet it’s not just core curricula that require vetting. Policymakers also need to examine the intervention programs that schools use to support struggling readers. In this realm, one of the most popular—but controversial—models is Reading Recovery. The program provides low-achieving first graders with twelve to twenty weeks of daily, supplemental, one-on-one instruction with a trained teacher. It’s based on the theories of New Zealand’s Marie Clay—an early proponent of three-cueing—and was introduced in the U.S. by Ohio State University professors in the 1980s. The university continues to be affiliated with Reading Recovery, and a group that promotes it is based in the Columbus area.

Right off the bat, Reading Recovery shouldn’t pass muster under Ohio’s new literacy law because it incorporates three-cueing. But its advocates may still pressure state officials to approve it by citing research that has been done on the program. If that is the case, it’ll be critical for policymakers to have a solid—and up-to-date—understanding of what the studies show. Spoiler alert: It’s not as rosy as its supporters often claim. In fact, according to the most recent analysis, the program actually does more harm than good over the long haul.

The vast majority of the research on Reading Recovery sheds no light on program effectiveness. Some analyses lack comparison groups, so we don’t know whether Reading Recovery is any better than other interventions. Others are simply case studies or surveys. A 2013 review by the What Works Clearinghouse found just three out of 202 studies on Reading Recovery met its standards for high-quality evidence. That review did report somewhat positive effects, but the three small-scale studies included just 105 total participants. None of the studies tracked long-term impacts. They only evaluated results immediately after the intervention.

Since that time, two larger-scale studies have been undertaken. In a report published in 2018, researchers analyzed program effects on approximately 3,400 Reading Recovery participants in about 1,000 U.S. schools. The results were largely positive and heralded by proponents. But like the earlier research, this study did not track longer-term outcomes; it only assessed results right after the intervention.[1] The results may have also been stacked in favor of Reading Recovery: 39 percent of the comparison group received no extra reading help whatsoever, while the rest received “some form of supplemental literacy support” (the research did not evaluate the program vis-à-vis another specific intervention).

That brings us to the most recent study on Reading Recovery. Led by the University of Delaware’s Henry May, co-author of the analysis discussed just above, a 2023 study finally provides much-needed evidence on long-term impacts. This large-scale research tracks through fourth grade roughly 5,500 U.S. students who participated in the program as first graders.

Results are grim. While Reading Recovery is again shown to provide a short-term boost, the gains quickly evaporate—and actually turn negative by third and fourth grade. The adverse effects are substantial, equivalent to falling behind one-half to a full grade level, compared to peers who did not participate in Reading Recovery. A lack of follow-up intervention isn’t the culprit for the freefall, as the analysts find that participants were somewhat more likely to receive extra support in subsequent grades than the comparison group. 

Why the negative long-term impacts? The study authors theorize that Reading Recovery’s poor alignment to the reading science adds to students’ struggles in later grades.

The practices and strategies within Reading Recovery may produce large impacts on early literacy measures (i.e., reading first-grade books), but those practices and strategies do not translate to skills needed for continued success in later grades.

More specifically, Reading Recovery does not include isolated, systematic phonics instruction that is advocated by some literacy experts. As such, the program lacks a scope and sequence of sound-spelling patterns to be decoded, encoded, and read aloud in books.... It is plausible that students who participate in Reading Recovery may not develop sufficient decoding and orthographic mapping skills that lead to success with larger words in second and third grade texts.

In other words, Reading Recovery is more like a quick fix than a permanent foundation for reading fluency over time. It might even give some parents and students a sense of false hope. One Michigan teacher said it this way: “[Reading Recovery] actually reinforces strategies that struggling readers use. It’s actually harmful to kids. They end up doing worse. They might do OK for first grade but end up hitting the wall in third grade.”

Literacy scholars have been raising alarms about Reading Recovery for decades. In 2002, a group of thirty-two reading experts wrote to Congress, urging it not to approve funding for the program. Louisa Moats, a well-regarded expert, has said, “The whole approach is based on ideas that have not held up to scientific scrutiny.” Others have questioned the astronomical costs of Reading Recovery. In a recent Fordham publication, the National Council on Teacher Quality recommended that Ohio “discontinue the use of Reading Recovery,” and encouraged the use of other interventions such as SIPPS. Recent media reports indicate that districts around the country, including Columbus City Schools, are dropping the program.

The research is clear: Explicit, systematic instruction in phonics is essential to building children’s foundational reading skills. But such instruction is missing in Reading Recovery, and the latest research reveals its long-term consequences. It’s long past time for Ohio—and every other state in the Union—to abandon Reading Recovery and work to implement interventions that follow the science of reading.


[1] The control group in the study participated in Reading Recovery later in the school year, so the analysts were unable to assess long-term impacts.

view

Open enrollment might save suburban schools, not destroy them

Garion Frankel
7.27.2023
Flypaper

Stand Up Blue Valley is a pro-public-education parents’ association in Overland Park, Kansas (a large suburb of Kansas City) with a reputation for milquetoast advocacy promoting local control, informed voting, and opposition to school choice. Though the group had been no stranger to drama, its antagonism towards educational choice was never any different than any other anti-school choice group.

As such, it was a surprise to many community members when Stand Up Blue Valley’s opposition to Kansas’s new open enrollment policy leaned hard into xenophobia.

That policy allows Kansas students to transfer to any public school in the state, provided that a school or district has space available.

“When your Blue Valley student gets cut from their high school sports team, remember who voted for #OpenBorders,” the group declared in a Facebook post. When several prominent community members accused them of racism, the group doubled down, proclaiming that “anti-public education forces” intended to “strain” the area’s schools.

Not all suburban opposition to open enrollment stems from racism or xenophobia, but Stand Up Blue Valley is representative of a broader phenomenon: Suburbanites are often uncomfortable with, if not outright hostile toward, public school choice.

One legislator from suburban Detroit objected to open enrollment on the grounds that other school districts would have to accept poor kids from Detroit. In Ohio, which allows districts to choose whether they participate in open enrollment, suburban districts are the least likely to allow out-of-district transfers. Not even additional funding could tempt school districts in Connecticut into accepting students from Hartford.

Suburban opposition to open enrollment has a long history, but open enrollment won’t destroy suburban schools. If anything, it might save them.

In the aftermath of Brown v. Board of Education, suburbs, which had already been growing exponentially, continued to develop and often implemented more stringent school enrollment policies to block federal desegregation efforts. These efforts took years —sometimes decades—to develop and enforce, but upon success, added tools like modern district boundaries and restrictive housing practices.

Though much of this opposition was racially motivated, suburbanites would often couch the language in the idea of “preserving neighborhood schools.” Only a few sun belt cities, like Nashville, Charlotte, and Las Vegas, which were and are consolidated city-suburb districts, were able to cultivate meaningful education mobility.

Despite broad social progress, this dynamic is largely unaltered. Whether it’s for capacity reasons (which, admittedly, cannot be entirely disregarded), economic interests, or outright racism, many suburban school districts are reflexively against external enrollment. Even during the No Child Left Behind battles, lawmakers had to weaken open enrollment policies so as not to offend suburban school districts and voters.

Traditionally, when people bought a home in the suburbs, they did so with the expectation that they and their similarly-wealthy neighbors would fund a successful school district for themselves. These schools would then attract new, equally affluent residents, and the cycle would continue. Simply put, this is the way we’ve done things for decades.

A number of factors have disrupted this way we’ve always done things—Covid-19, the baby bust, and lower immigration rates among them. Though districts in fast-growing metropolitan areas, like Sacramento, have avoided the worst effects of declining enrollment, other suburbs have not been as lucky. This is particularly true in suburbs that have historically relied on white student enrollment, which has declined by 5 percent nationwide (and by more than 20 percent in Ohio). These vast demographic shifts won’t end any time soon.

If suburban areas refuse to open their doors, these districts will have to make some tough choices. No district wants to shutter schools or lay off teachers due to declining enrollment. But without open enrollment, this is likely what many suburban districts will have to do. Operating schools at 50 or 60 percent capacity is simply unsustainable.

Indeed, some suburban school systems are already facing these uncomfortable decisions. The Granite School District near Salt Lake City closed three schools as the district lost thousands of students in the past few years alone. The story is much the same in places like Palo Alto (Santa Clara County in California), Pflugerville (near Austin, Texas), and West Hartford (central Connecticut). South Carolina may consolidate entire school districts.

As bleak as the prognosis may appear at first blush, open enrollment can help. Arizona, for example, implemented open enrollment in 1994, making it the first state to do so, and the program has been very successful. Scottsdale, a wealthy suburb of Phoenix, accepted more than 4,000 out-of-district transfers (or more than 18 percent of the district’s total enrollment) in 2014 alone. As of the 2021–2022 school year, this trend has continued, with out-of-district transfers now constituting 21 percent of Scottsdale’s student population.

This allowed the district to fill more classrooms, thereby raising more revenue for the district. In addition, many of these transfer students were minorities and/or economically disadvantaged, who may have otherwise been lost to private schools.

It’s worth noting that open enrollment doesn’t obliterate urban and rural school districts. Open enrollment allows rural schools, especially those with positive school cultures and good social services, to attract new students, and urban districts would have a greater network to promote high-performing magnet schools. Moreover, school districts would benefit from increased competition in the education market. After all, public districts who experience competitive pressure see their academic performance improve and their budgets become more efficient.

By ending resistance to statewide open enrollment policies—or by enacting open enrollment policies themselves where they have discretion—suburban school districts can adjust to the country’s demographic shifts. Open enrollment is just as important to education reform as any funding increase or private school choice program, and it is time suburbs start acknowledging it.

view
Public-Education-Your-Way-Report SR image

A fifty-state analysis of non-district students’ access to district-provided services

Jeff Murray
7.25.2023
Ohio Gadfly Daily

Traditional district schools have become providers of many services and benefits for students. The list is nearly endless, but includes food provision (both in school and on weekends/summer break), athletics, the arts, computer and tech education, medical care, summer camps, and counseling. However, the burgeoning of school choice has created a bifurcated (or trifurcated) structure in some areas, where families who choose non-public or homeschooling options can be shut out of these benefits or, at the very least, have to work much harder to access them. Believing that all students should have access to the services provided in public schools, the national nonprofit organization yes. every kid. recently released a report looking at which states are addressing the divide.

Analysts Lily Landry and Sam Niederholzer examined the education statutes of all fifty states to find answers to a dozen questions regarding access to districts’ courses, services, and extracurriculars. These questions cover access (or lack thereof) for non-public and homeschool students, as well as for non-district-residents, which includes charter and district students living across attendance lines. They also examine funding structures, limitations, and any instances where districts can exercise discretion to impose access limits.

Only one state checks the boxes in all twelve categories: Idaho. The Gem State’s statute—which explicitly spells out the universality of access to public schools for all students regardless of which school they attend—is particularly lauded. (Of course, just because the statute says something doesn’t mean it happens smoothly every time, but the report does not go into that level of detail.) Four other states are also highlighted for positive statutory efforts around this issue. New Hampshire’s statute uses “shall” and not “may” language to spell out what courses and activities must be made available to parents, and to enshrine the idea that minimal barriers can be erected around them. Iowa law specifies that offerings available to non-district students should be provided at the same level as those provided for full-time enrolled students and includes core curriculum, electives, and all extracurriculars. Alaska and Washington State go a step further, making sure that non-district families will not be charged more than resident families would be for courses, activities, and services. Among the ten top-rated states, wide access to academic courses is the most common plus point. Access to extracurricular activities is second.

On the other end, a baker’s dozen states check no boxes on the questionnaire. As a corollary to the above, that doesn’t mean that students outside a district’s borders can’t or don’t access courses or services at all; just that state law doesn’t make an affirmative stand for access. In these states, it is likely an ad hoc process driven by parents and families who possess the wherewithal to advocate strongly and persistently on behalf of their children. Nine other states check only one box. The most common single item spelled out in statute is guaranteed access to extracurricular activities for homeschool students, likely a result of nearly decade-long efforts to pass “Tim Tebow laws” around the country.

Ohio checks the homeschooler box and just one other: Giving public school students explicit access to another public school’s services. This is reflective of both interdistrict open enrollment, a longstanding and widely popular school choice option, and a more recent effort to make sure charter school students can access extracurriculars in the district where they reside if their own schools don’t offer the same activity.

Landry and Niederholzer conclude with a message of hope that more states will take after the four exemplars that actively seek to erase the hard lines between school choice and availability of public services to children and families. It is probably an uphill fight, even in states where school choice is growing, but it is a worthwhile effort.

SOURCE: Lily Landry and Sam Niederholzer, “Public Education Your Way,” yes. every kid. (July 2023).

view

Cheers and Jeers: July 27, 2023

The Education Gadfly
7.27.2023
Flypaper

Cheers

  • David Steiner gives a thorough, disheartening, but necessary account of American education: Covid learning loss, incoherent curricula, disconnected testing regimes, and more. —The 74
  • Elite college admissions favor the very poor and the very wealthy, making the middle class the true losers in the current regime. —Jonathan V. Last

Jeers

  • Georgia lowered the final grade weight from 20 percent to 10 percent of statewide final exams for every course. —AP News
  • Restrictive zoning laws functionally segregate suburbs, even as those very suburbs tout the importance of inclusion. —Richard D. Kahlenberg
view

What we're reading this week: July 27, 2023

The Education Gadfly
7.27.2023
Flypaper
  • Rick Hess interviews Virginia school board member Andrew Rotherham on the state’s adoption of new social studies and history standards. —Education Week
  • Elite colleges admit a disproportionate share of wealthy students, far more than the academic marks of these students could justify. —David Leonhardt
  • Autism is surging across the country but conspiracy, misguided positivity, and investigative ennui have stymied any meaningful discussion of it. —The Free Press
  • Ron DeSantis faces backlash for his state’s updated history curriculum, with critics suggesting it whitewashes slavery and defenders pointing out hundreds of references to its brutalities. —The Wall Street Journal
Fordham Logo

© 2026 The Thomas B. Fordham Institute
Privacy Policy
Usage Agreement

National

P.O. Box 110
Burke, VA 22009

202.223.5452

[email protected]

Ohio

P.O. Box 82291
Columbus, OH 43202

614.223.1580

[email protected]

Sponsorship

130 West Second Street, Suite 410
Dayton, Ohio 45402

937.227.3368

[email protected]