
In a previous blog post, we urged Ohio’s newly formed Dropout Prevention and Recovery Study Committee to carefully review the state’s alternative accountability system for dropout-recovery charter schools. Specifically, we examined the progress measure used to gauge student growth—noting some apparent irregularities—but didn’t cover in detail the three other components of the dropout-recovery school report cards: graduation rates, gap closing, and assessment passage rates. Let’s tackle them now.
Each of these components is rated on a three-level scale: Exceeds Standards, Meets Standards, and Does Not Meet Standards. This rating system differs greatly from the A–F grades issued by Ohio to conventional public schools; the performance standards (or cut points) used to determine their ratings are also different. One critical question that the committee should consider is whether the standards for these second-chance schools are set at reasonable and rigorous levels.
Graduation Rates
Dropout-recovery schools primarily educate students who aren’t on track to graduate high school in four years (some students may have already passed this graduation deadline). These schools are still held responsible for graduating students on time. Ohio, however, recognizes that dropout-recovery schools educate students who need extra time to graduate by assigning ratings for extended (six-, seven-, and eight-year) graduation rates in addition to the four- and five-year rates reported for all public schools. The standards for dropout-recovery schools’ graduation rates are also significantly relaxed when compared to traditional public schools. Even with these adjustments, it is unlikely that dropout-recovery schools’ four- and five-year rates are reflective of their true performance (a problem, as we discuss here, for any high school enrolling low-achieving adolescents).
Below, Table 1 displays the four-year graduation rate targets for dropout-recovery schools, along with the 5–8-year graduation rates. Also shown are the standards for traditional public schools (graded on an A–F scale). As you can see, the standards for dropout-recovery schools are considerably lower. For example, a dropout-recovery school could graduate less than 50 percent of a cohort of students and still earn the top rating (Exceeds Standards); meanwhile, traditional schools are required to graduate virtually all of their students to earn an A or B rating (at least 89 percent). Note also that the 5–8-year graduation rate targets are higher than the four-year rate, as schools are held to slightly higher standards given the longer time that students are given to earn their diplomas.
Table 1. Graduation rate performance standards
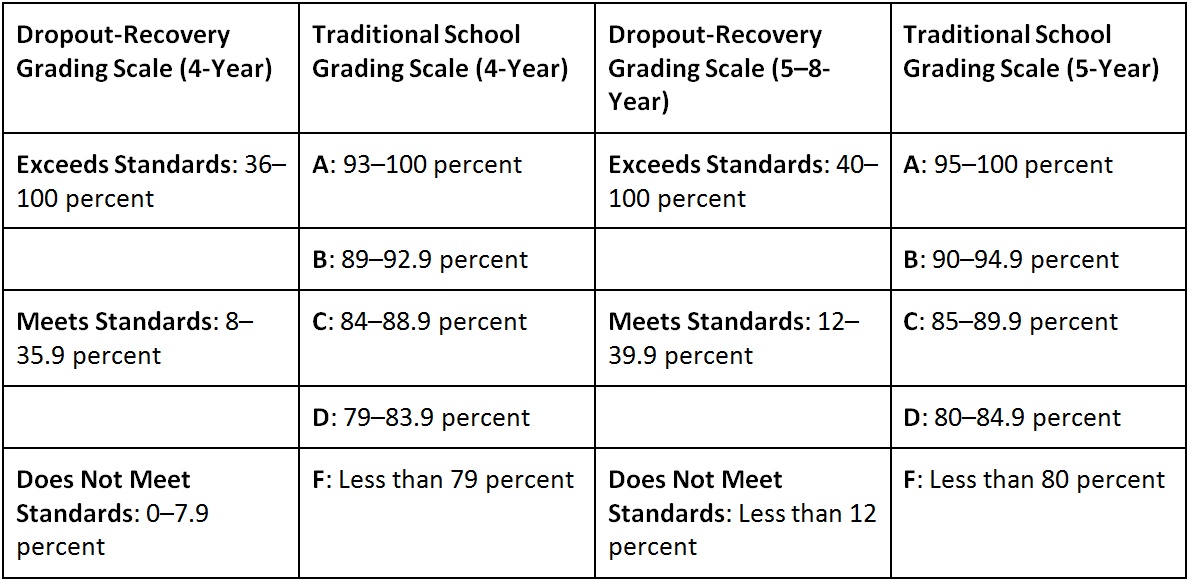
But are the adjusted graduation rate standards too low for dropout-recovery schools? To determine this, a good first step might be to compare these standards to the ones set for dropout-recovery schools in other states (e.g., Texas or Arizona). Another way of tackling the question is to examine the current distribution of Ohio’s ratings. If nearly all schools were exceeding standards, then it would be fair to say that they are probably too low. But as Chart 1 indicates, that’s not the case.
Chart 1. Distribution of four-year graduation rate ratings, dropout-recovery schools, 2014–15
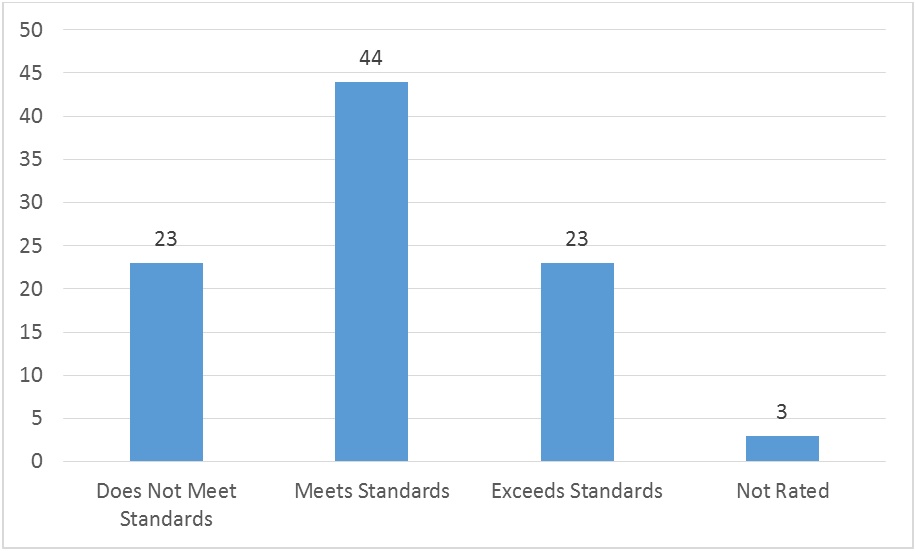
As readers can see, there is a fairly even balance across the categories, indicating that the standards could be deemed appropriate for this unique group of schools. That being said, the graduation standards are rather low in absolute terms, and policy makers should consider ratcheting up targets in a reasonable way (perhaps by phasing in incrementally higher standards over multiple years). They could also consider making adjustments to the way graduation rates are calculated.
Assessment Passage Rate
The assessment passage rate measures the percentage of students in twelfth grade, or students within three months of turning twenty-two, who pass the Ohio Graduation Test (OGT) or the End-of-Course exams (beginning with the 2018 graduating class). Ratings are assigned to schools depending on what percentage of their students pass the graduation exams (each subject exam, such as math or social studies, must be passed). A–F report cards for conventional public schools do not use this type of measure, so we don’t display a side-by-side comparison of standards. Dropout-recovery schools with assessment passage rates above 68 percent receive an Exceeds Standards rating; schools whose assessment passage rate is between 32 percent and 68 percent receive Meets Standards; and schools with an assessment passage rate of less than 32 percent receive a Do Not Meet Standards rating.
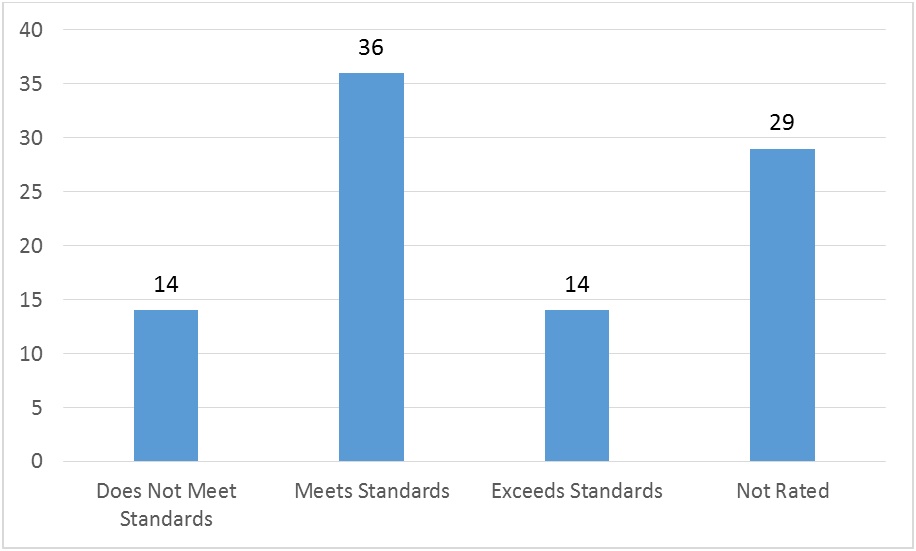
Again, to get a sense of whether the performance standards are set at reasonable levels, we can look at the distribution of school ratings. Chart 2 shows that the ratings are fairly well balanced, with most rated schools falling into the Meets Standards category. This suggests that the standards are set at appropriate levels for the passage rate component. Surprisingly, however, twenty-nine schools were not assigned ratings in this component, though it is unclear why these schools were not rated. The fact that almost one in three dropout-recovery schools did not receive a rating is troubling and worthy of further investigation.
Chart 2. Distribution of assessment passage rate ratings, dropout-recovery schools, 2014–15
Gap Closing (Annual Measurable Objectives)
The gap-closing measure gauges how well a school narrows subgroup achievement gaps. This is measured by the percentage of proficiency targets a school meets for certain student subgroups. The very intricate methodology for calculating the percentage of targets met is available here. As we’ve argued elsewhere, this measure has some imperfections, and the state should reconsider its use—at least in its present form—as an accountability measure applying to any public school.
That being said, so long as it plays a key role in school report cards, we should examine the results. Table 2 displays the performance benchmarks for dropout-recovery schools and traditional public schools. The percentages displayed are equal to the number of gap-closing points a school earns divided by the number of points possible. Just like graduation rates, dropout-recovery schools are held to considerably lower standards in comparison to conventional schools. On the one hand, this is understandable given the academic backgrounds of the students they serve. On the other hand, the standards appear at face value to be entirely too low: A dropout-recovery school could earn just 1 percent of the gap-closing points possible and receive a Meets Standards rating.
Table 2. Gap-closing performance standards
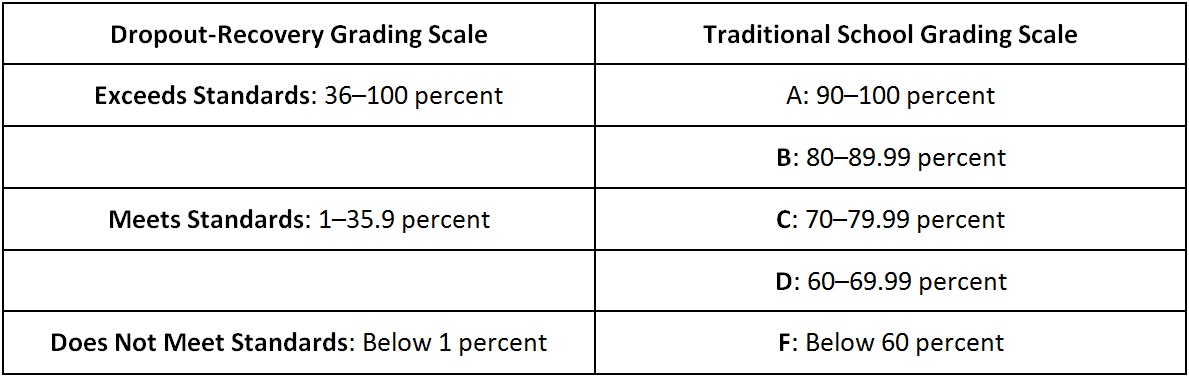
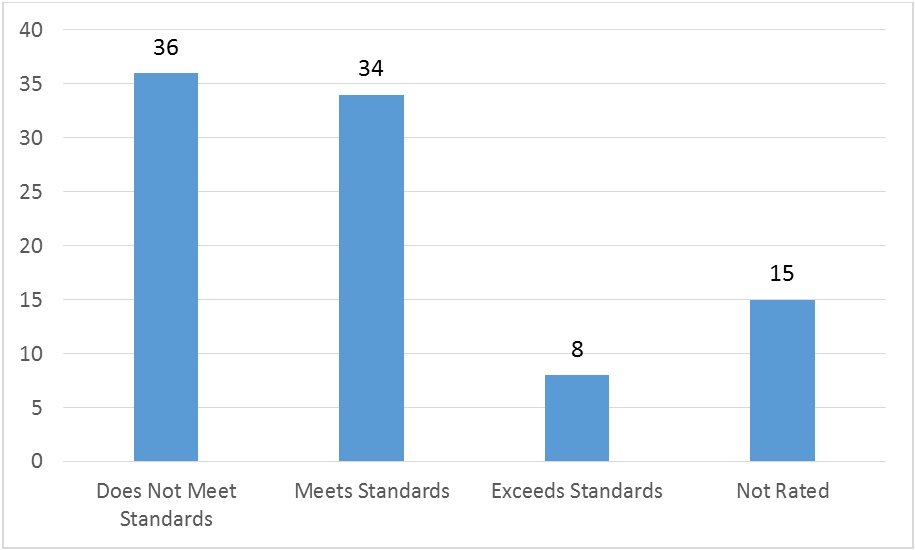
Chart 3 displays the distribution of gap-closing ratings for dropout-recovery schools. Unlike the graduation rate and test passage rate components, the distribution for gap closing appears imbalanced and skewed toward the Does Not Meet category. As low as the gap-closing dropout-recovery standards may be, they still result in failing ratings for a disproportionate number of schools (and a modest number of non-rated schools).
Chart 3: Distribution of gap-closing ratings, dropout-recovery schools, 2014–15
* * *
A fair school accountability system recognizes circumstances that are beyond the control of schools. But it should do so without creating glaring “double standards,” at least when it comes to graduation and student proficiency indicators. Fortunately, this is not as much of a concern when growth is the measuring stick—another reason why getting the progress measure right is absolutely essential. The information above suggests that some important questions still need to be answered around accountability for dropout-recovery schools. Getting standards right for Ohio’s dropout-recovery schools can ensure that these second-chance schools are indeed helping young people advance their education.