I have two requests. The first is modest. The second is…well, let’s focus on the first for the time being.
Please go to your calendar and block off thirty minutes. You can call the item “Districts and the Achievement Gap.” It’s easy work; you’ll just need to do look at some pictures.
A new project by a team of researchers associated with Stanford’s Center for Education Policy Analysis has produced a database that includes school district test scores, poverty rates, and racial demographics (report on the database’s creation here).
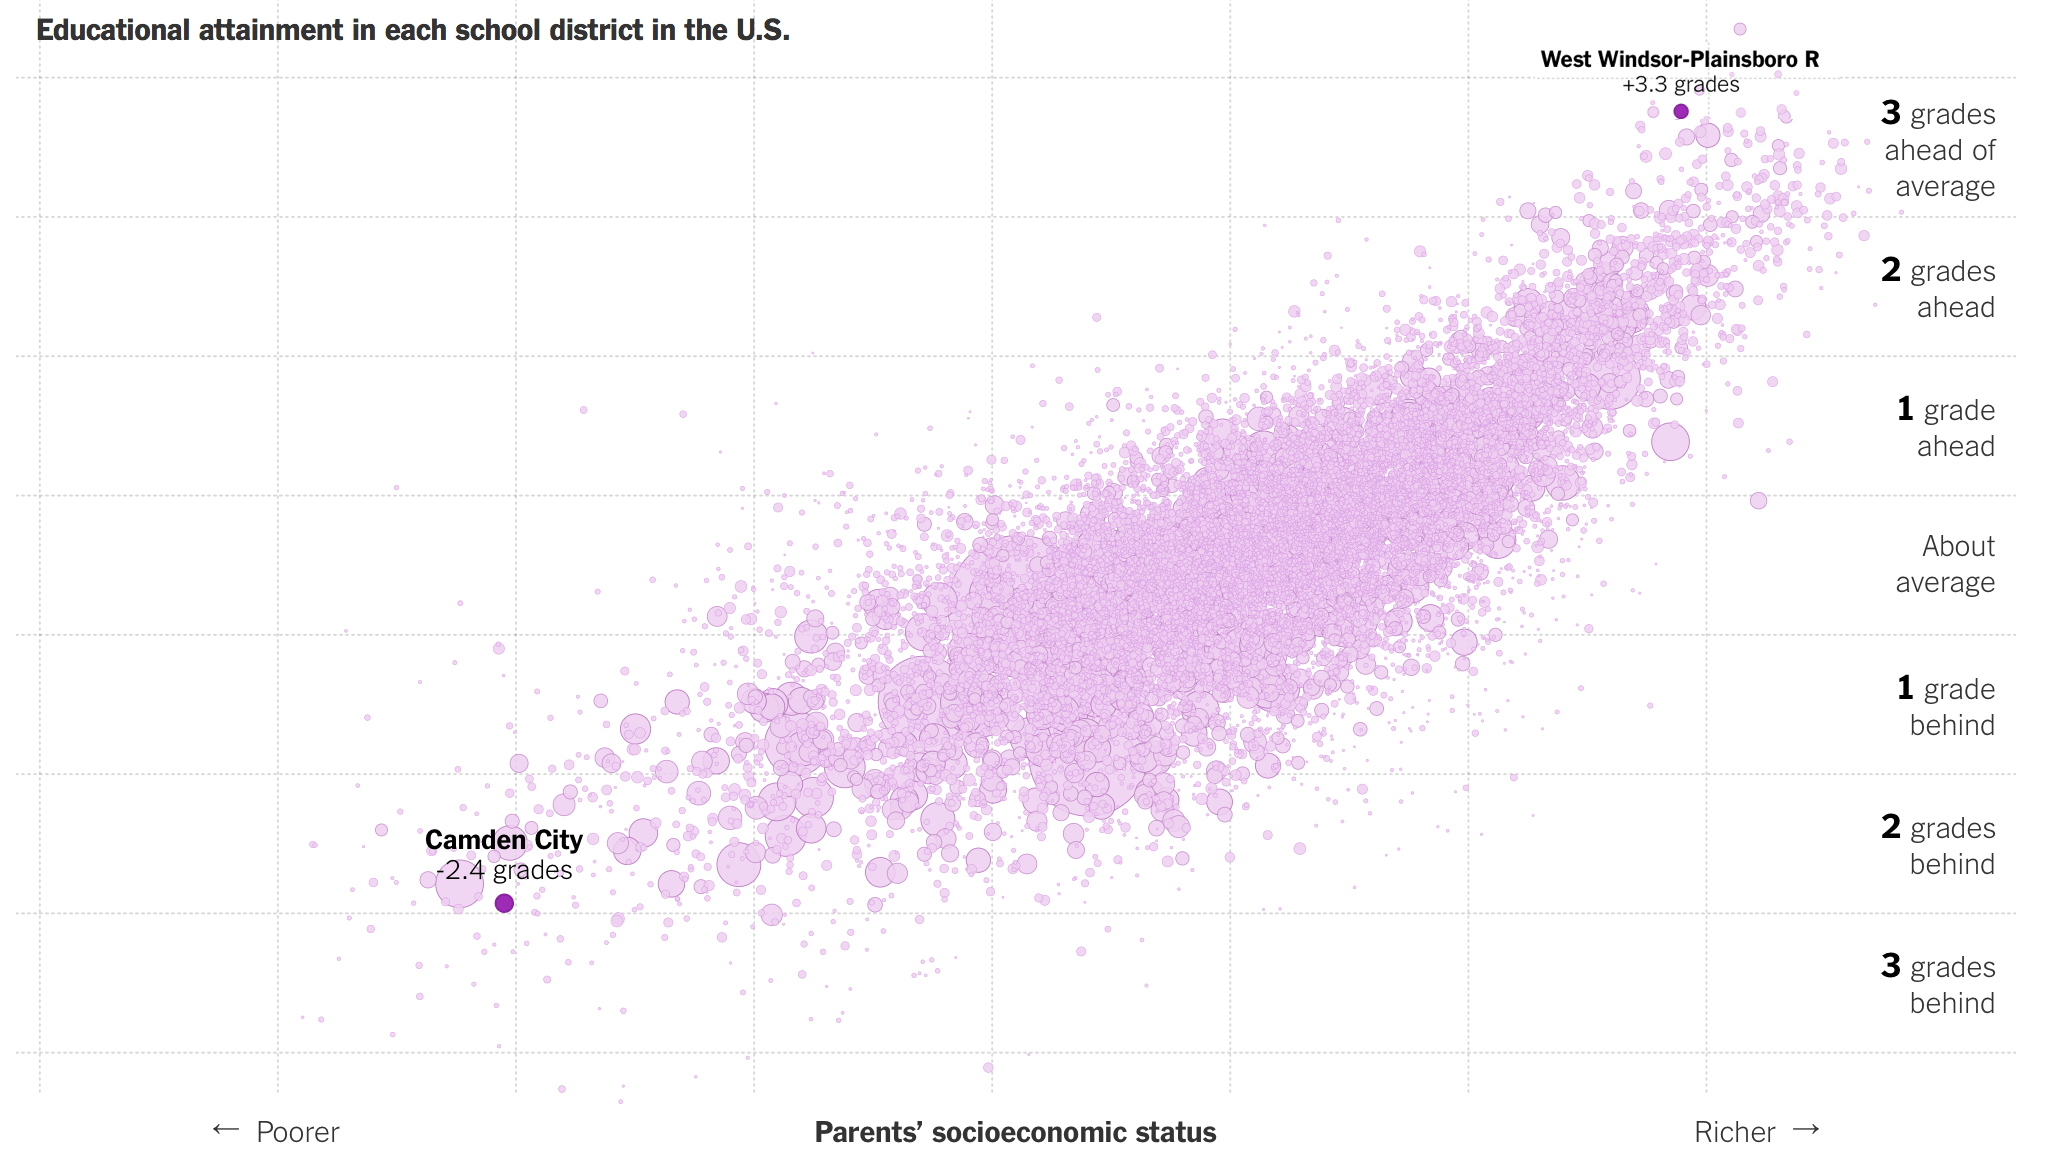
A short article in the New York Times explains some of the findings that emerge when you start analyzing the data. But the major contributions of the article are its two interactive graphics.
The first displays the well-known relationship between family income and student achievement: Students from more affluent families have higher average achievement levels. The upshot, per the article, is that “children in the school districts with the highest concentrations of poverty score an average of more than four grade levels below children in the richest districts.” The graphic allows you to search for any traditional school district in America. I did a quick comparison of one of New Jersey’s highest-performing and one of its lowest-performing districts:
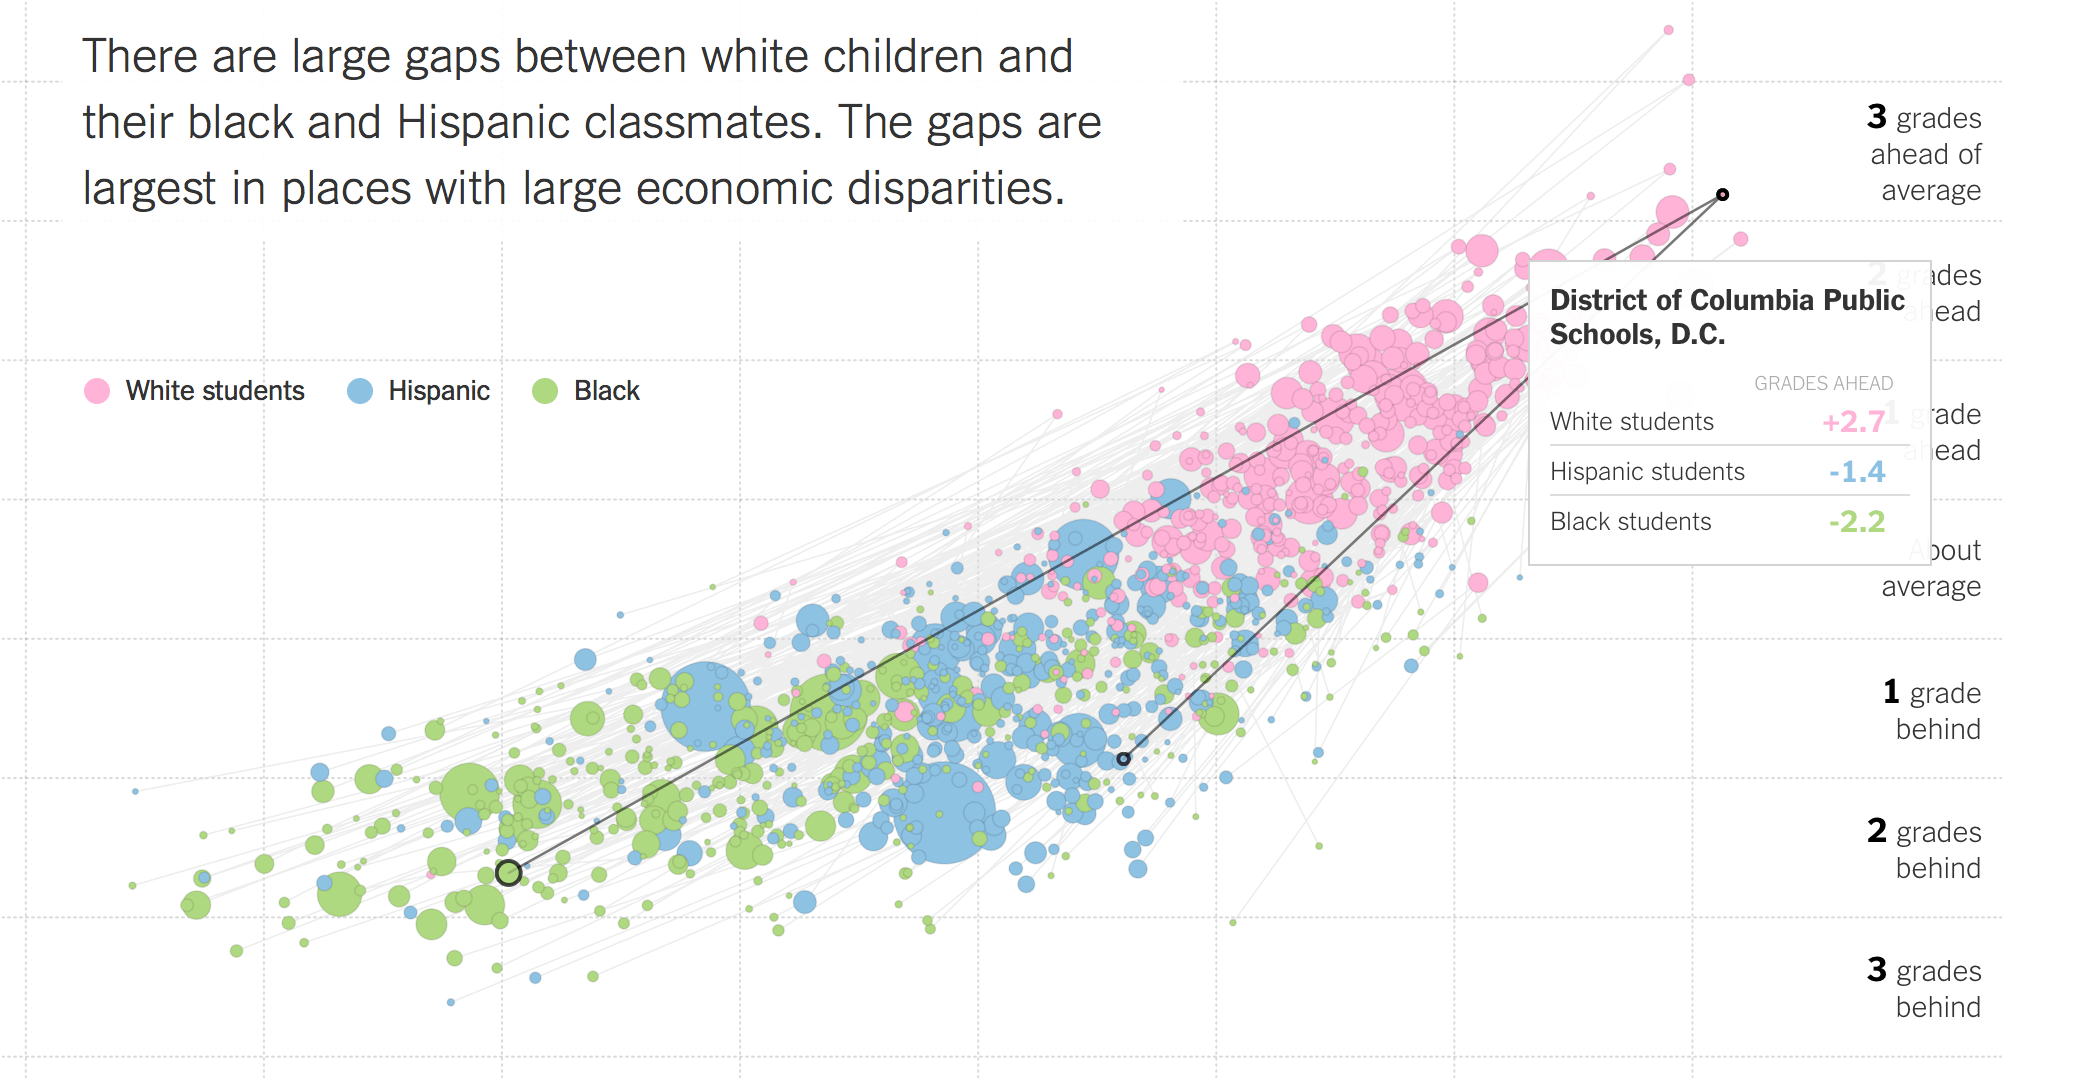
The second graphic shows the wealth and achievement gaps between kids of different races. There are lots of takeaways from the tool, including the likelihood of kids of color growing up in poverty and the wide variation in achievement among districts with similar income levels. But the most notable is just how large the gaps are inside certain districts.
In Washington, D.C., for example, the average white student is 2.7 years above grade level; her black and Hispanic peers are 2.2 and 1.4 years below respectively.
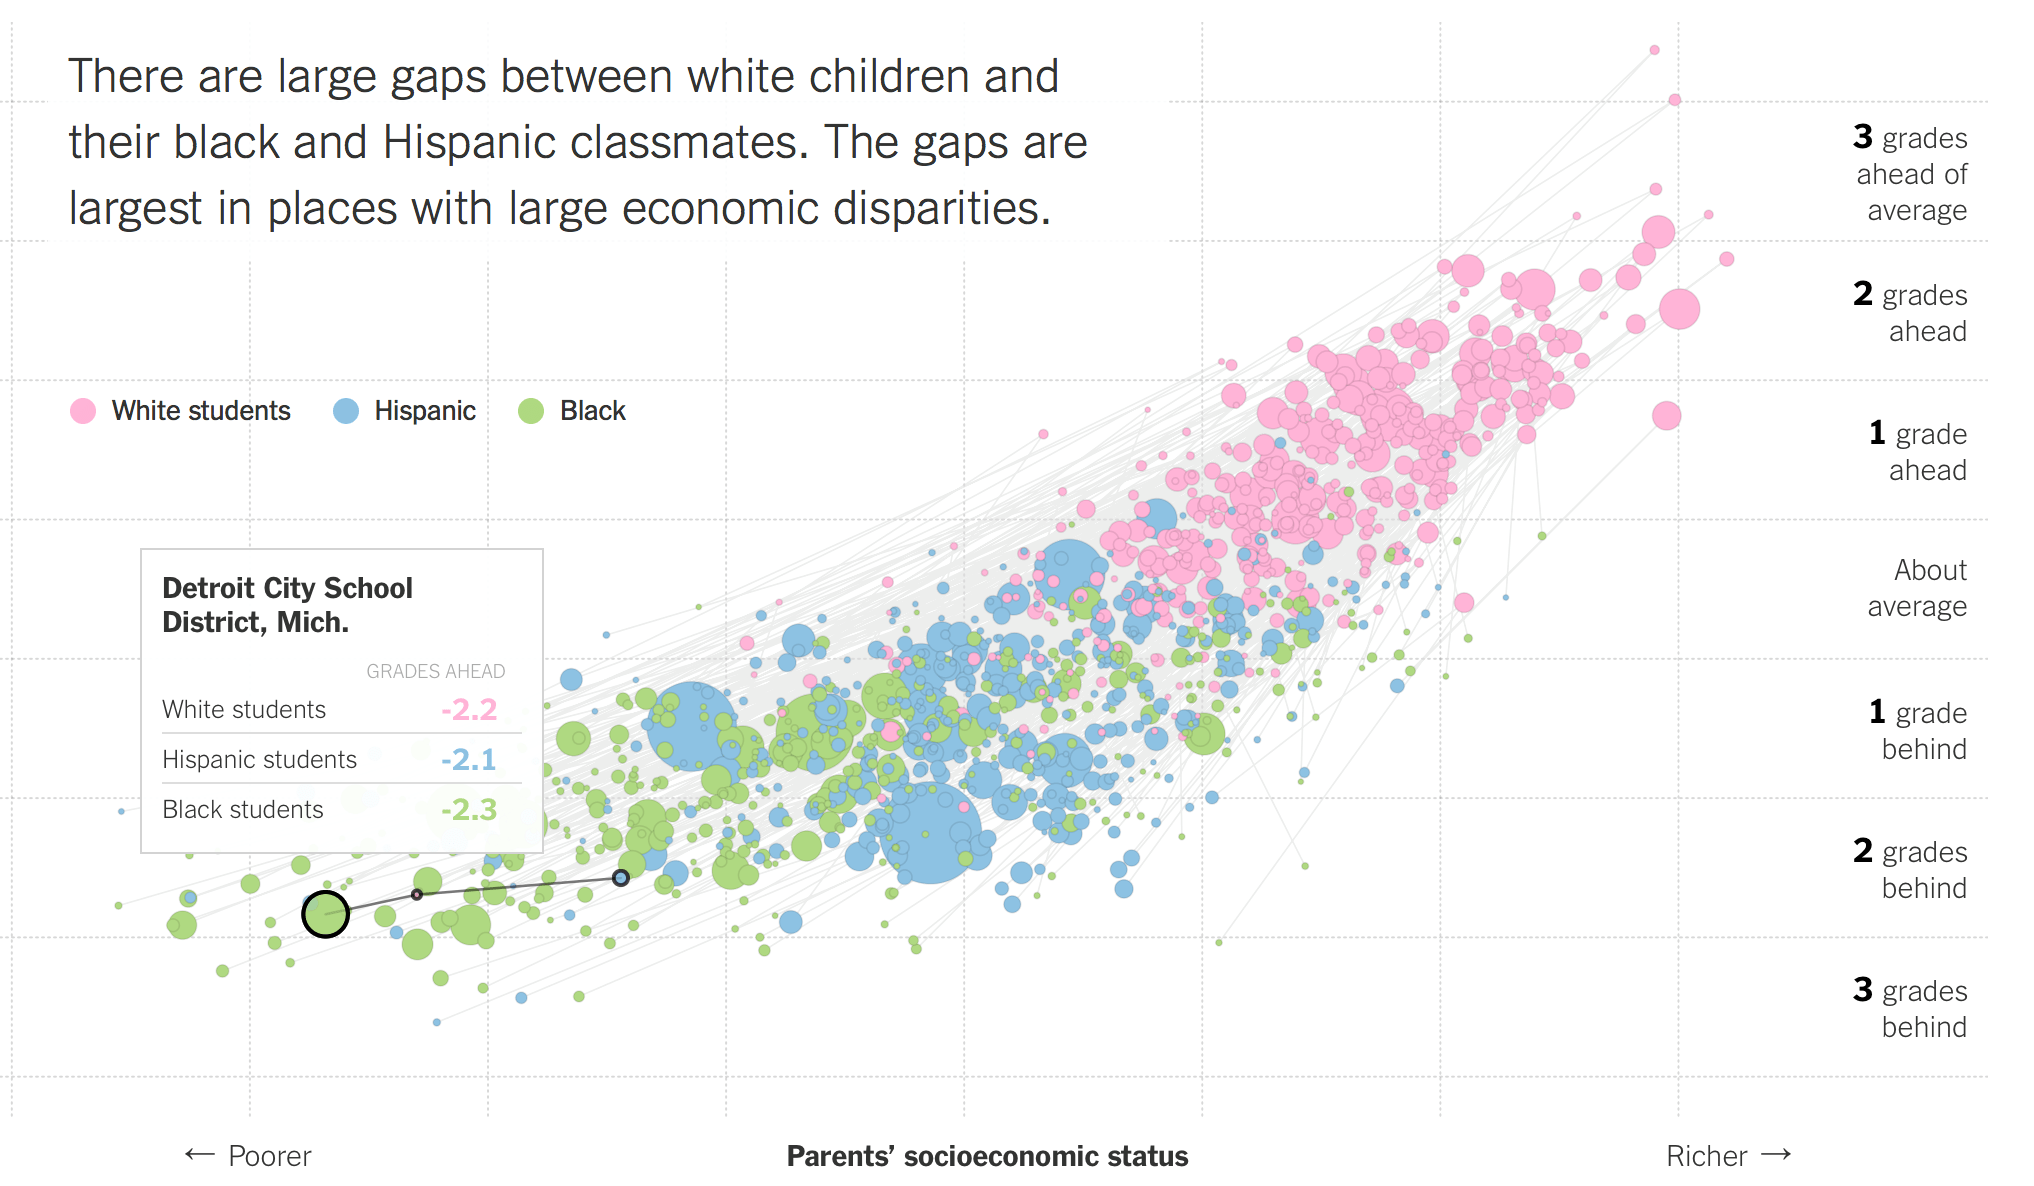
But in some urban districts, all racial groups are poor and tragically low-performing. In Detroit, white, black, and Hispanic kids are more than two years behind on average.
The researchers have also created a number of maps not discussed in the article. The one below shows levels of student learning by district. Many of our urban areas are colored dark purple, signifying much less than a year’s worth of academic growth annually.
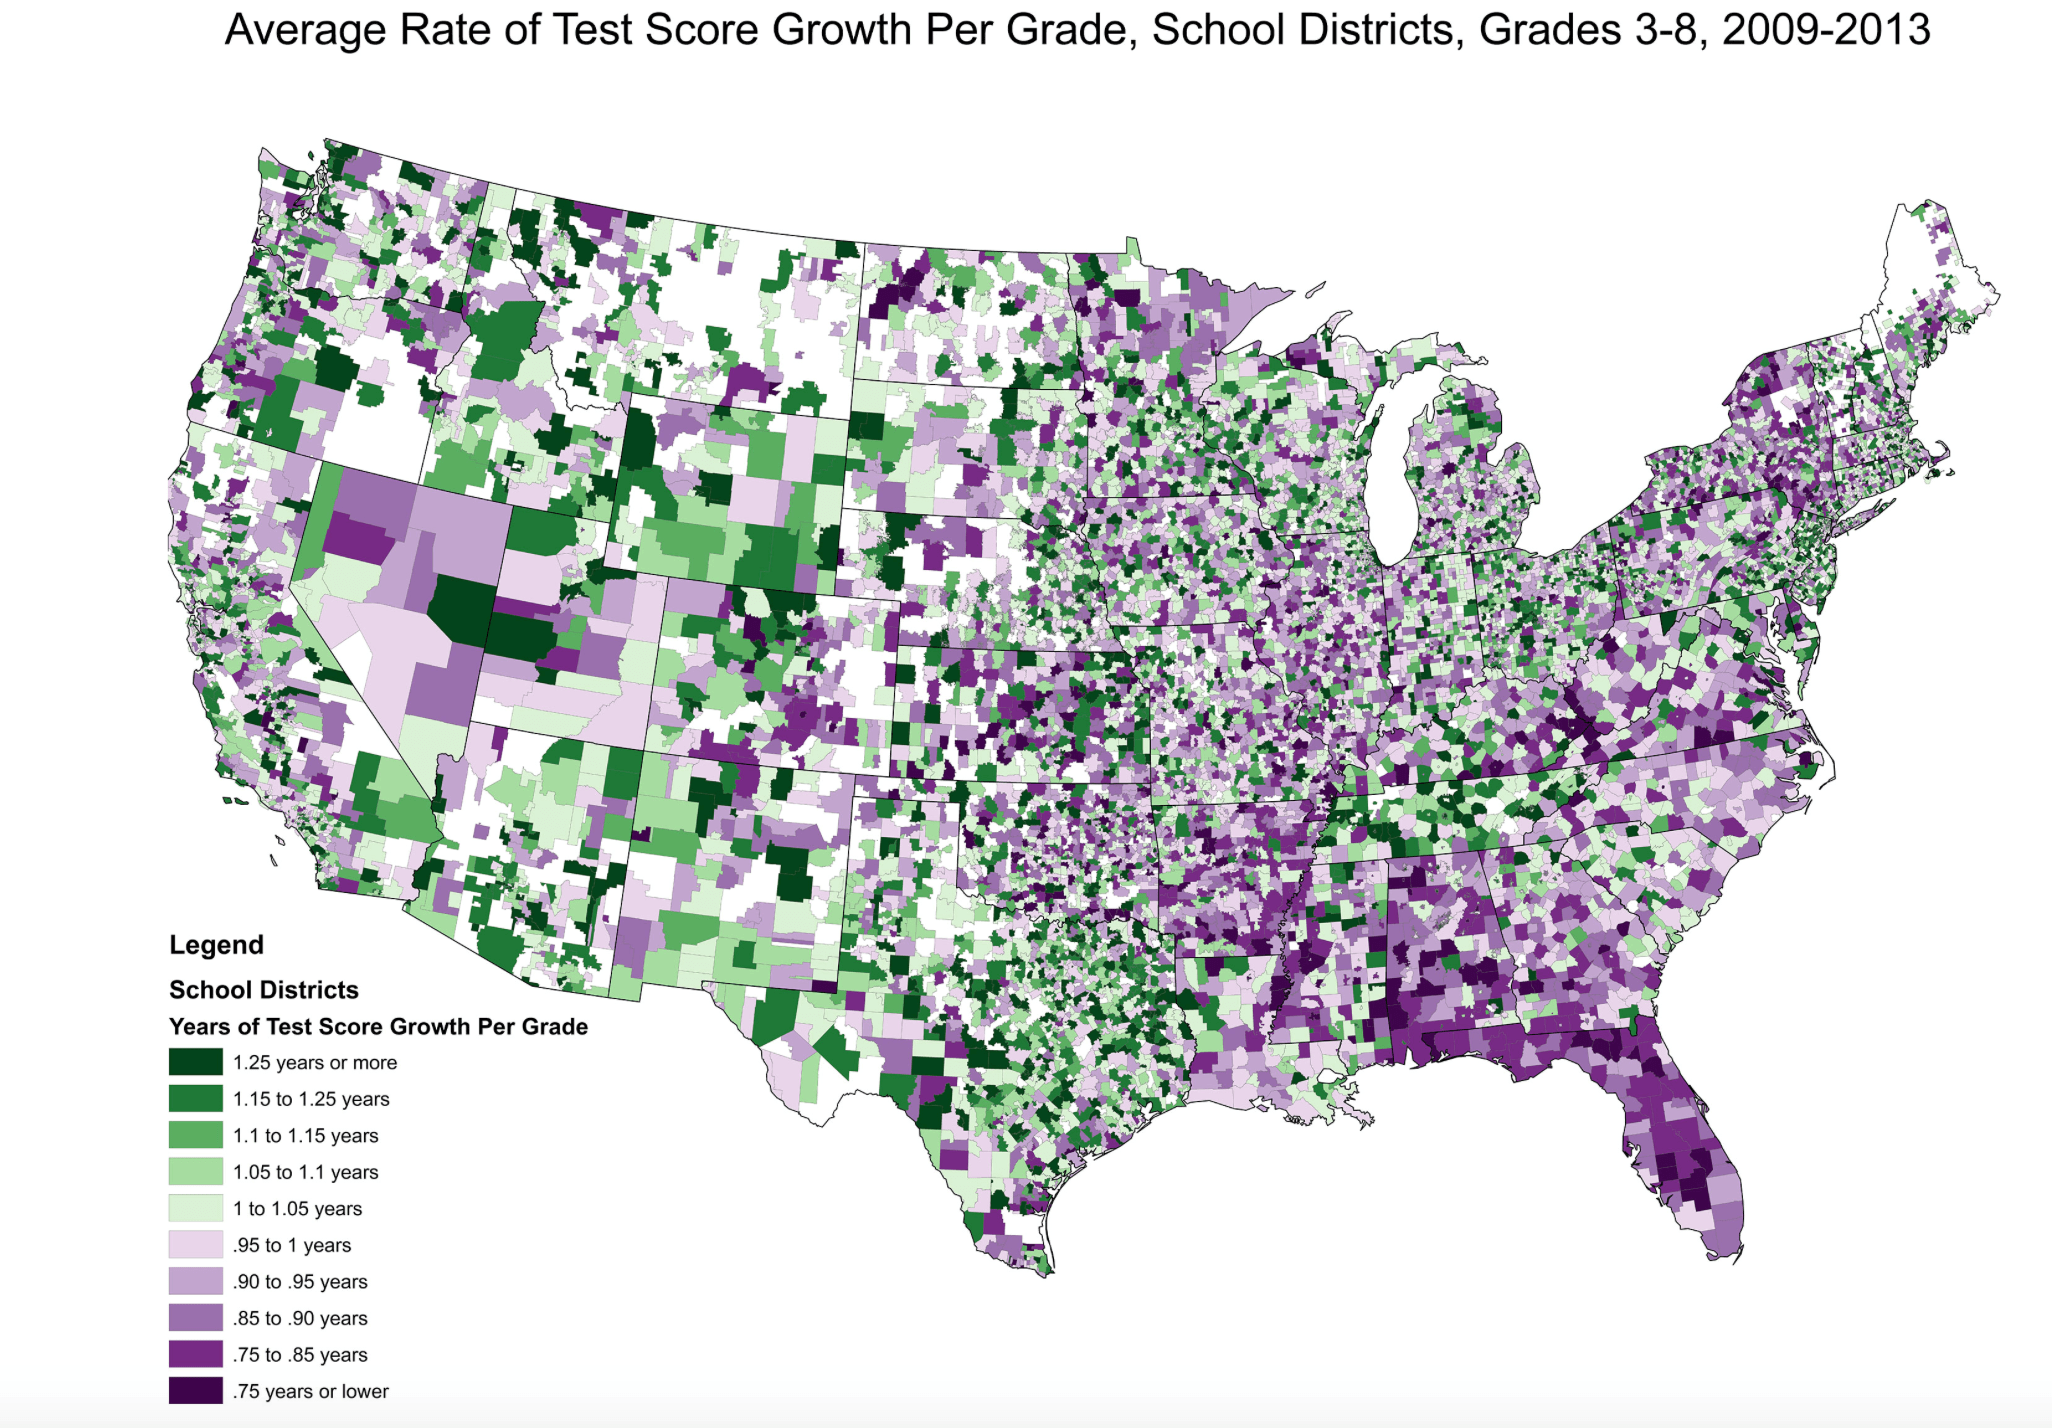
However, a critically important story is left untold by all of these graphics. That’s because the data is provided at the district level. In other words, these are district averages.
But thanks to decades of research, we know that there are many, many high-performing, high-poverty schools. We know that disadvantaged kids can learn at the highest levels when they can access successful learning environments. The results of such superb schools, however, are lost in district averages. So a casual observer of these graphics might assume that socioeconomic status is, in fact, destiny. But in the words of the research center behind the database, “Racial, socioeconomic, and gender disparities in academic performance and educational attainment are stubborn features of the U.S. educational system. These disparities are neither inevitable nor immutable, however.”
So the fundamental question for all of us is this: If we know that high-performing, high-poverty schools are possible, why is it that not a single urban district in this entire nation has been able to bring those results to scale—even after fifty years of effort? Why is it that, at the district level, poverty and race are such predictors of performance?
Today, there are a growing number of nonprofit organizations running a dozen or more highly successful charter schools, so we know that scaling is possible. (Note: The interactive graphics do not include charter schools that function as LEAs; they only include traditional districts.)
This is the key distinction I’d like to draw. We can create organizations that operate consistently outstanding urban schools that serve disadvantaged kids. However, 0 percent of those organizations are traditional urban school districts. This is why I wrote The Urban School System of the Future. This is why people are working on “portfolio” systems and why Mike Petrilli just wrote about creating new systems of schools. This is why states have created non-district charter sectors and new types of districts, like the RSD and ASD.
Such efforts share a single set of beliefs: Low-income kids are capable of achieving at the highest levels; great schools can make a world of difference; the traditional urban school district is not the only path to great schools. As you explore these graphics showing the tight relationship between district achievement and socioeconomic status, remember that “district” is an operative word.
So my second request is this: Please consider dedicating some of your talents to the work of developing new ways of organizing, overseeing, and governing urban schooling.