
There is a large literature linking the quality of education to economic growth, and numerous economists and development agencies, including the World Bank, have endorsed this connection. Most analysts also recognize that it’s not simply the years of schooling that matter, but rather the cognitive skills education imparts on the future workforce. Observers who want to measure these cognitive skills often look to the Organisation for Economic Co-operation and Development (OECD)’s Programme for International Student Assessment (PISA), as a high-quality, comparative indicator of student skills.
Perhaps, then, it is no surprise that PISA itself is viewed as a key predictor of countries’ economic growth. As economist Eric Hanushek has written: “The PISA scores are a good index of the future quality of the labor force in each country, and the quality of the labor force in turn has been shown to be a decisive factor in determining the long-run growth rates of nations.”
But consider the following data. Figure 1 shows PISA math and reading scores in 2009 for the U.S. and peer nations. Since PISA scores are supposed to be a leading indicator of future growth, I use PISA data from fifteen years prior—the students who were assessed then are now around thirty and are economically active adults today.
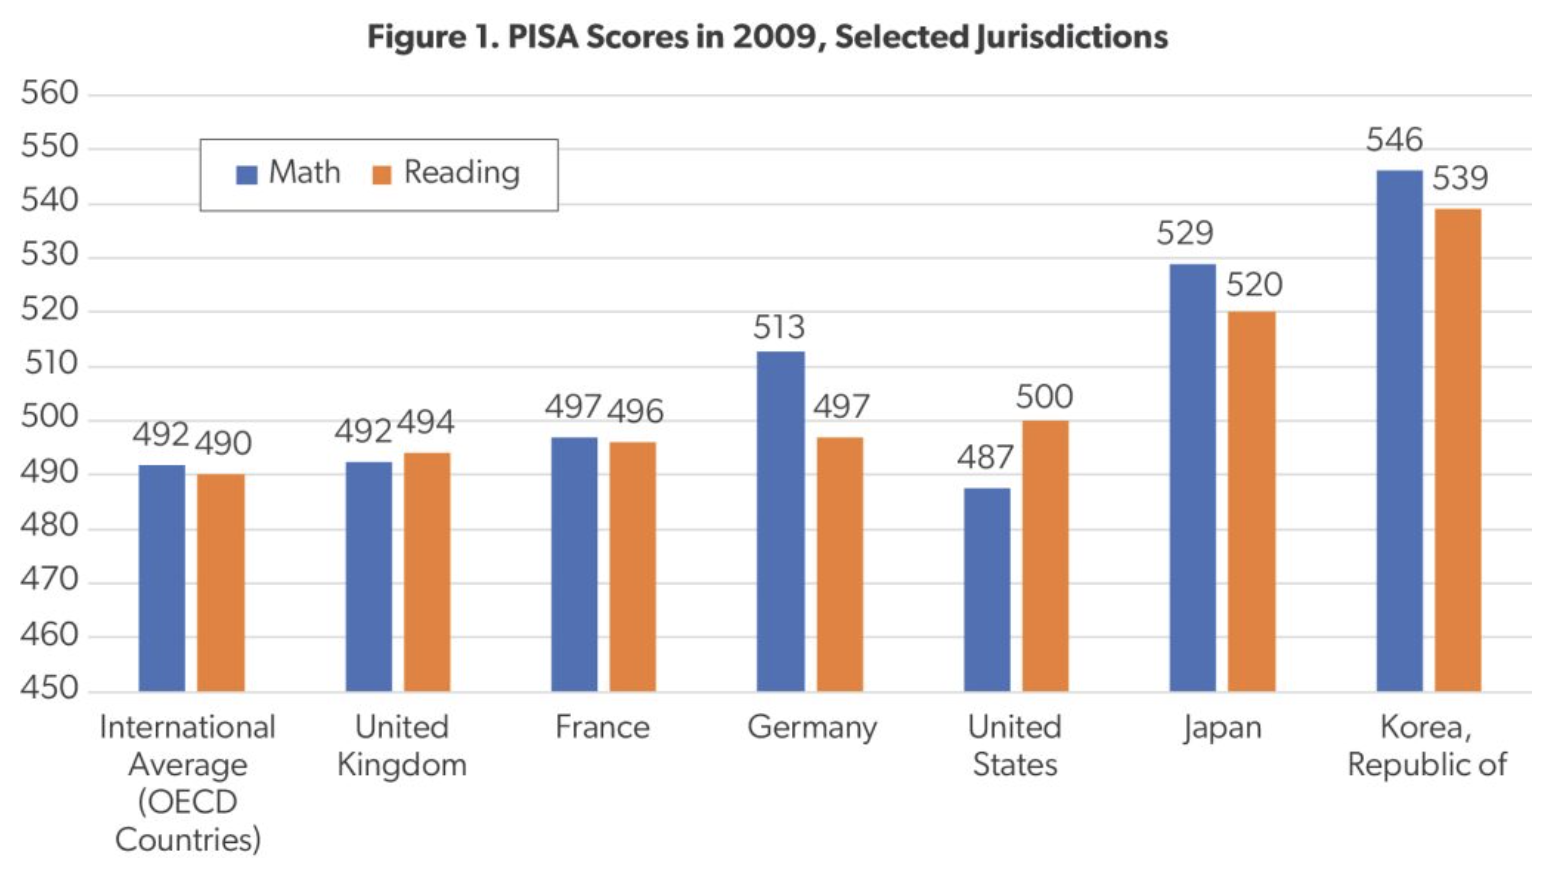
Let’s first examine scores for math, often regarded as the best subject area to predict economic development. Figure 1 shows that American youth do not stack up particularly well against peer nations. U.S. students outperformed the OECD average, which includes low-performing countries like Turkey and Mexico, and tested at the same level as students in the United Kingdom. But we lagged France (10 points) and Germany (26 points). The gap between the U.S. and Japan (42 points) and Korea (59 points) was even larger.
American students did better in PISA reading, performing at the same level as our European competitors and beating the OECD average. However, the U.S. lagged Japan (20 points) and Korea (39 points) in reading, as well.
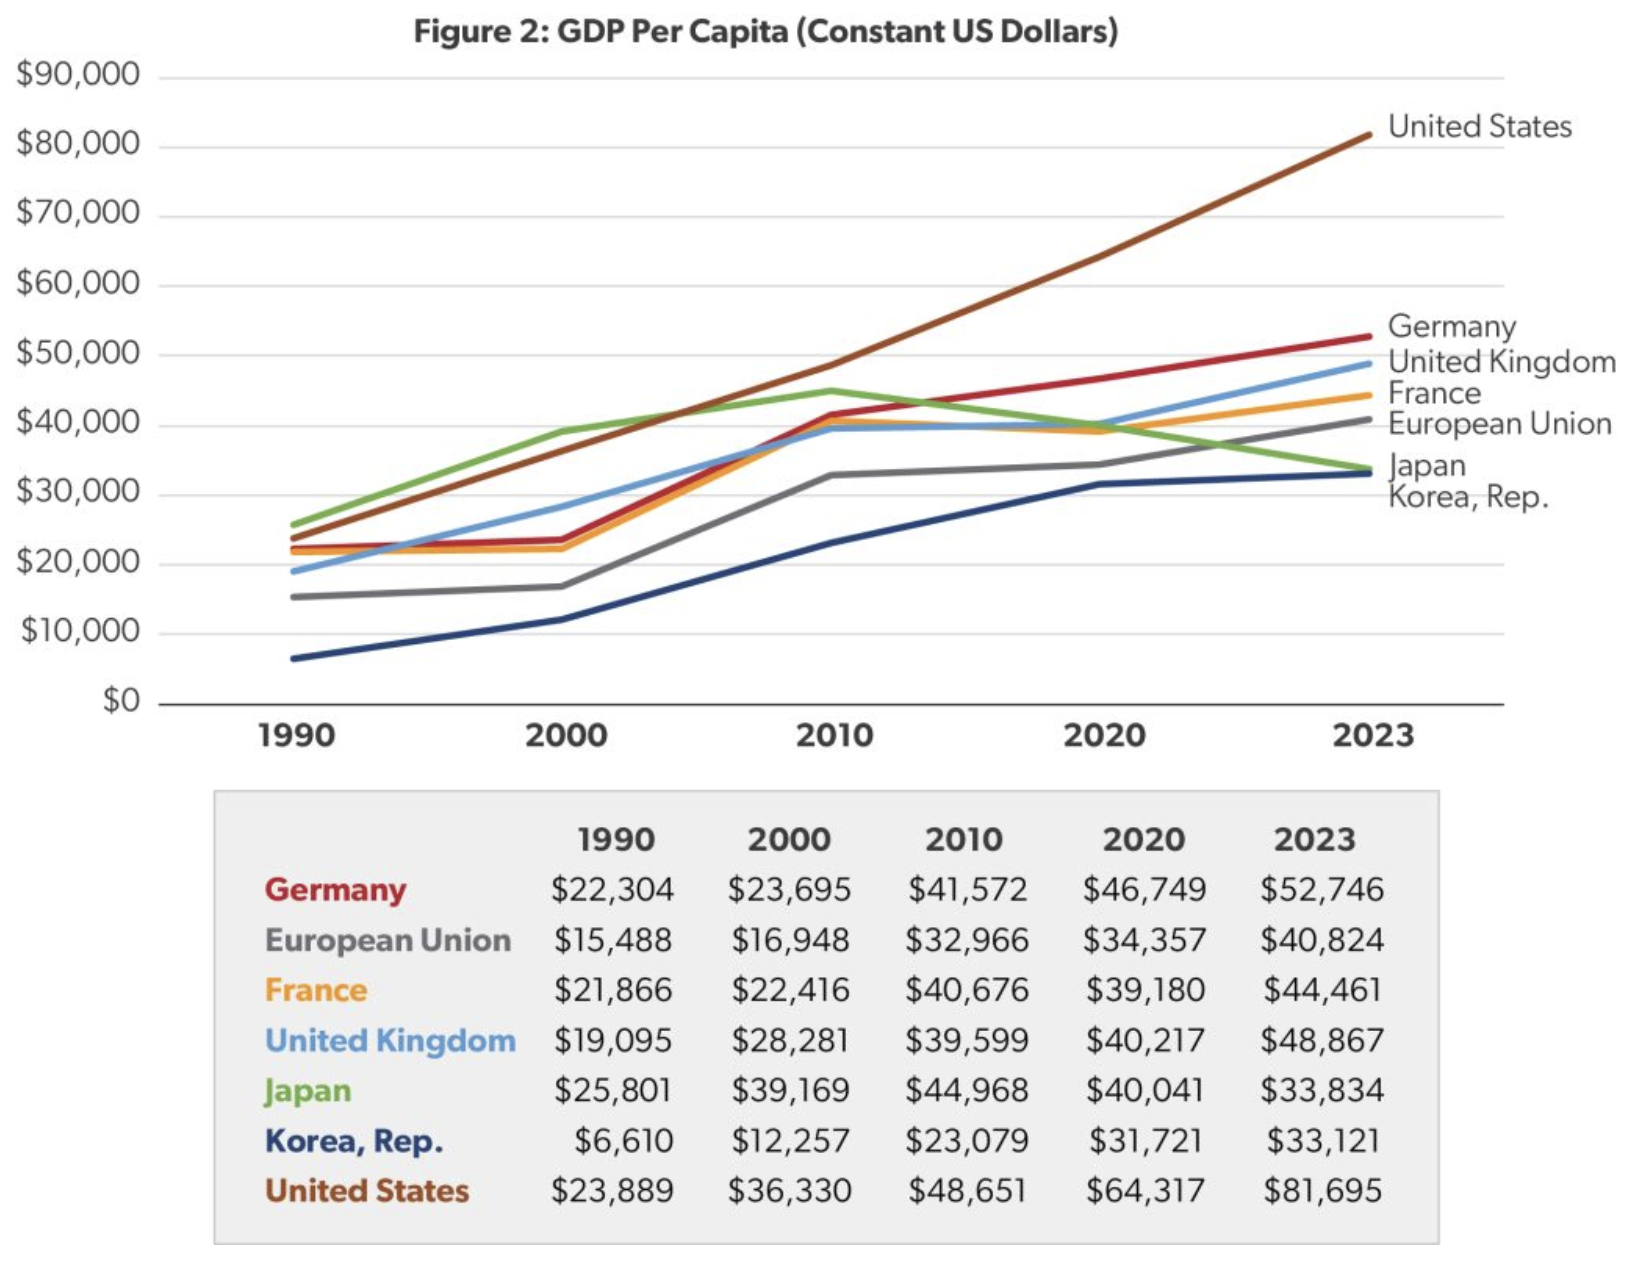
When PISA results are released, there is always rending of garments and gnashing of teeth surrounding America’s comparatively poor performance and how this portends economic disaster. But is this concern justified? Using GDP per capita as an indicator, the answer is a resounding “no.”
We have data for a far longer time span for GDP than for PISA (which did not begin until 2000). Figure 2 shows growth in GDP per capita across these same countries. In 1990, except for Korea, all these nations were tightly clustered—indeed, the U.S. lagged Japan. But even as our PISA scores have remained mediocre, the US has experienced a far faster increase in GDP per capita than any of these competitors, passing Japan in 2010 and widening the wealth gap since then.
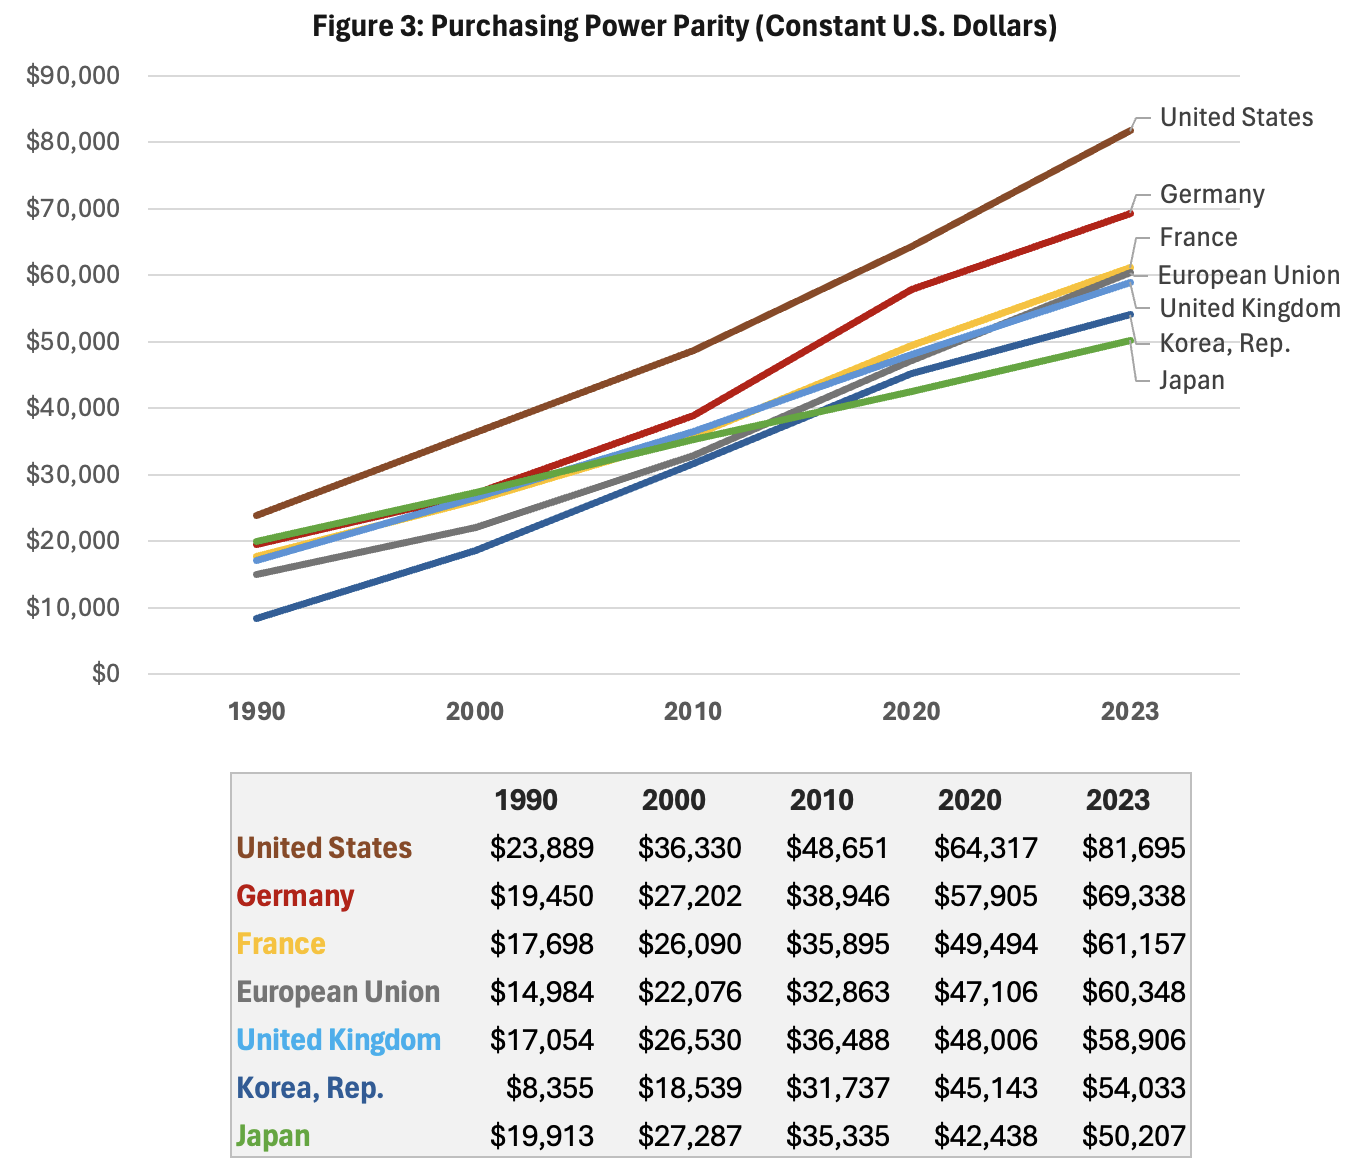
Some of the United States’ apparent economic advantage is driven by the strength of the U.S. dollar. Further, differences in the cost of living across these countries may make the U.S. seem richer compared to other countries. Figure 3 looks at the same time span as Figure 2, but now using purchasing power parity, which, by adjusting for the cost of common goods across countries, generates a more consistent comparison of GDP. The adjusted numbers aren’t quite as stark as before, but they continue to illustrate the growing strength of the United States economy.
Do better test scores matter?
For highly developed OECD countries, PISA scores are not a strong indicator of GDP growth. Maybe assessments like PISA are measuring the wrong thing. PISA has been trying to pivot away from “traditional” aspects of education performance (like reading, writing, and math) to more amorphous “forward thinking” concepts such as “twenty-first-century skills” and “creative problem solving.” Conceivably, if PISA measured these skills, it might be more predictive of economic growth—but it will take years to find out.
I have spent decades advocating for better educational practices to increase student performance. But perhaps the U.S. has already achieved a sufficiently strong educational “floor” to support solid economic growth, and policymakers might do better to invest in other factors responsible for American prosperity.
Among those factors behind U.S. wealth are American workers’ higher productivity and longer hours worked, as well as Silicon Valley—which has led the high-tech sector from the dot-com boom to today’s rapid deployment of AI. This has been one of the driving forces behind the far more vigorous start-up culture in the U.S. than in the European Union. Demographically, the U.S. population is far younger than many OECD peers. The median age in the U.S. is thirty-eight versus forty-nine in Japan and forty-five in Korea. The U.S. fertility rate is also far higher than other countries on this list (except for France). And the U.S. has a strong tradition of independent courts that enforce contracts, making it a predictable venue for investment.
The list of important reasons for America’s current prosperity goes on—but high test scores do not seem to be among them.
Would I love to see the U.S. top the PISA “league tables”? Of course. But that may be a parochial lens shaped by my long involvement in education research and development. Rather than fixating on test scores, I would bet on the many other advantages the U.S. has to propel our economy into the future.