At a time when the national conversation is focused on lagging upward mobility and yawning income inequality, it is no surprise that many educators point to poverty as the explanation for American students’ mediocre test scores compared to their peers in other countries. If teachers in struggling U.S. schools taught in Finland, says Finnish educator Pasi Sahlberg, they would flourish—in part because of “support from homes unchallenged by poverty.” Michael Rebell and Jessica Wolff at Columbia University’s Teachers College argue that middling test scores reflect a “poverty crisis” in the United States, not an “education crisis.” Adding union muscle to the argument, American Federation of Teachers president Randi Weingarten calls poverty “the elephant in the room” that accounts for poor student performance.
But does this explanation hold water?
It’s an important question. If critics of education reform are correct that our schools are doing as well as can be expected given the economic challenges that their students face, they could also be right in saying that school reform is beside the point, misguided, or even doing more harm than good.
So what does the evidence show? To prove that poverty is the major factor driving America’s meager academic achievement, at least one of these claims need to be established:
- America’s poor students perform worse than other countries’ poor students; or
- The child poverty rate in the United States is substantially higher than the rates in countries with which it is compared.
Let’s examine each in turn.
Do U.S. students from low-income families underperform their peers overseas?
Low-income students everywhere do worse on tests of academic achievement than their more affluent peers. That’s as true in the United States as it is in every other country ever studied, and it’s been true for as long as scholars have collected achievement data.
The question isn’t whether America’s low-income students do worse than our upper-middle-class kids. (They do.) It’s whether our poor students are particularly low-scoring compared to other countries’ poor students. Is that what’s dragging down our averages?
To explore this question, we’re obliged to wrestle with measurement issues. The problem is complicated because no international data set contains both good measures of family income and good measures of student test score performance.
The best available data are collected by the Program for International Student Assessment (PISA), which is sponsored by the Organization for Economic Co-Operation and Development (OECD). For its own analyses, PISA uses an index of economic, social, and cultural status (ESCS) that considers parental occupation and education, family wealth, home educational resources, and family possessions related to “classical” culture. PISA analysts use the index to stratify each country’s student population into quartiles.
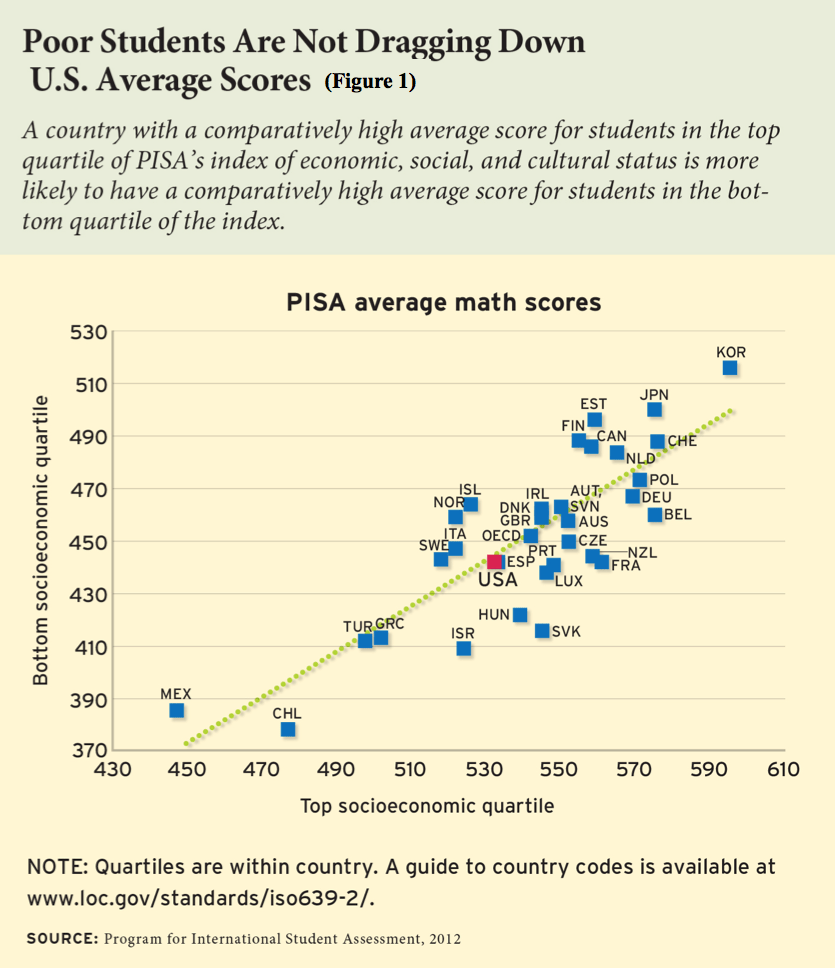
Not everyone will agree with the way the ESCS index is constructed, but the data presented in Figure 1 are nonetheless instructive. The test scores of students in the bottom quartile of the ESCS index are plotted against those of students in the top quartile. If students in these two quartiles did equally well in each country (as compared to similarly situated students in other countries), then the dotted regression line displayed in green would have a steeper slope, and every dot would fall exactly on that line. As you can see, the actual pattern is not that perfect: Countries like Belgium and France are relatively better at teaching their higher-status students, while other countries like Canada and Finland do relatively better at instructing students from lower-status families. But notice that the United States falls almost exactly on the regression line. It does equally well (or equally poorly, if you prefer) at teaching the least well-off as those coming from families in the top quartile of the ESCS index.
If we look at a different marker of socioeconomic status—parental education levels—we find a similar pattern. In the United States, parents without a high school diploma are much more likely to be in poverty than their better-educated peers, and their children are much more likely than their peers to be low-performing and to drop out of school themselves.
In a study that examined whether some countries are particularly effective at teaching students from disadvantaged backgrounds, Eric A. Hanushek, Paul E. Peterson, and Ludger Woessmann found something interesting: It makes little difference whether countries are ranked by the performance of students whose parents had a college education or by the performance of students whose parents had no more than a high school diploma. If a country is comparatively effective at teaching the first group, it tends to be no less effective (compared to others) at teaching the second. The United States performs as expected, proving to be not especially effective at teaching students from the best-educated or the least-educated families. The authors write,
Overall, the U.S. proficiency rate in math places the country at the 27th rank among the 34 OECD countries that participated in the Program for International Student Assessment (PISA). That ranking is somewhat lower for students from advantaged backgrounds (28th) than for those from disadvantaged ones (20th).
There is no evidence that disadvantaged students in the United States are underperforming other countries’ disadvantaged students. If anything, it’s the “advantaged” American students (those whose parents have a high level of education) who are falling short in international comparisons.
Is America’s child poverty high compared to rates elsewhere?
So far, we’ve demonstrated that disadvantaged students in the United States are performing as expected, given the performance of better-situated U.S. students.
But if more students are poor in this country than in others, it is still possible that students from low-income families are dragging down our national averages. If that is true, poverty could still be the explanation for our mediocre test scores.
In case that concept isn’t intuitive, consider an analogy. Imagine we are comparing two colleges’ athletic programs. Both schools field the same teams, and each team is perfectly matched when it comes to height, on average. The basketball teams are similarly tall; the gymnastics teams are similarly short. But what if School A has twice as many basketball players on its team, and School B has twice as many gymnasts? Those extra gymnasts will drag down the average height of School B’s program.
So we have to decipher what’s going on here. Do we have a larger number of low-income students compared to other countries? Do we have more gymnasts on our team?
For those educators quoted at the beginning of this essay, the answer is yes. They assert that the United States has a sky-high child poverty rate compared to other developed countries.
To support their claim, they use a “relative poverty” measure stipulating that all families with less than half the median income in the country are, by definition, “poor.” By that measure, we do indeed have a lot more children living in poverty than most other advanced economies.
Relying on measures of relative poverty is appealing for its simplicity, but it is a highly misleading approach because it’s more a measure of income inequality than of poverty. That’s a particular problem for countries (like the United States) with high median income and lots of income inequality.
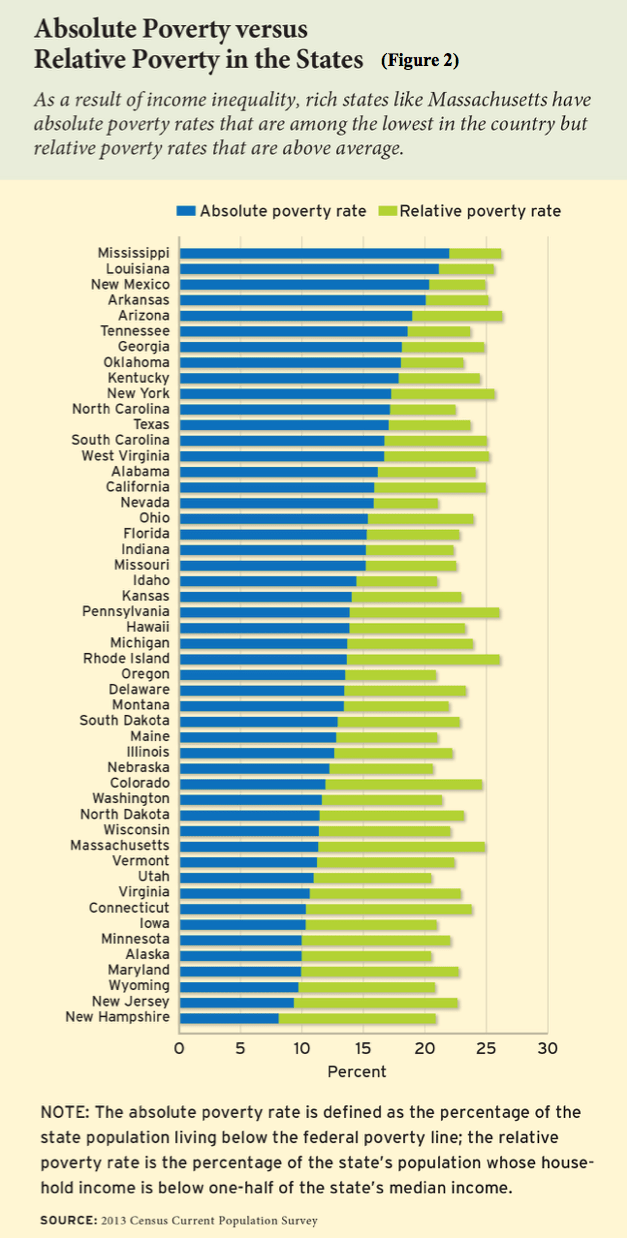
To see how relative poverty rates can be misleading, let’s look at how they compare to absolute poverty rates for the general population in the American states. In Figure 2, we report the proportion of people living in households earning less than half of their states’ median incomes (basing state median incomes on the 2013 Census Current Population Survey). We also show each state’s absolute poverty rate as it is traditionally defined: the percentage of all people in the state living in households below the federal poverty line, which is currently set at $24,250 for a family of four.
For some states, looking at either relative poverty or at absolute poverty makes little difference. Arizona, Mississippi, and Louisiana have a lot of poor people no matter how you slice the data.
But notice where wealthier states like Massachusetts and Connecticut appear on the graph. Their absolute poverty rates are among the lowest in the country. But their relative poverty rates are above average, and notably higher than states like Texas, Tennessee, and Oklahoma. Massachusetts has a higher relative poverty rate than Georgia, Kentucky, and Alabama.
Of course, Massachusetts doesn’t really have more poverty than Alabama—but it does have more income inequality. Nobody argues that Massachusetts’s “large number of poor students” drags down its state test score averages, because it doesn’t actually have a large number of poor students as compared to other states. Yet that’s what you would think if you relied on relative poverty measures.
The same dynamic plays out when we use relative poverty rates to compare countries.
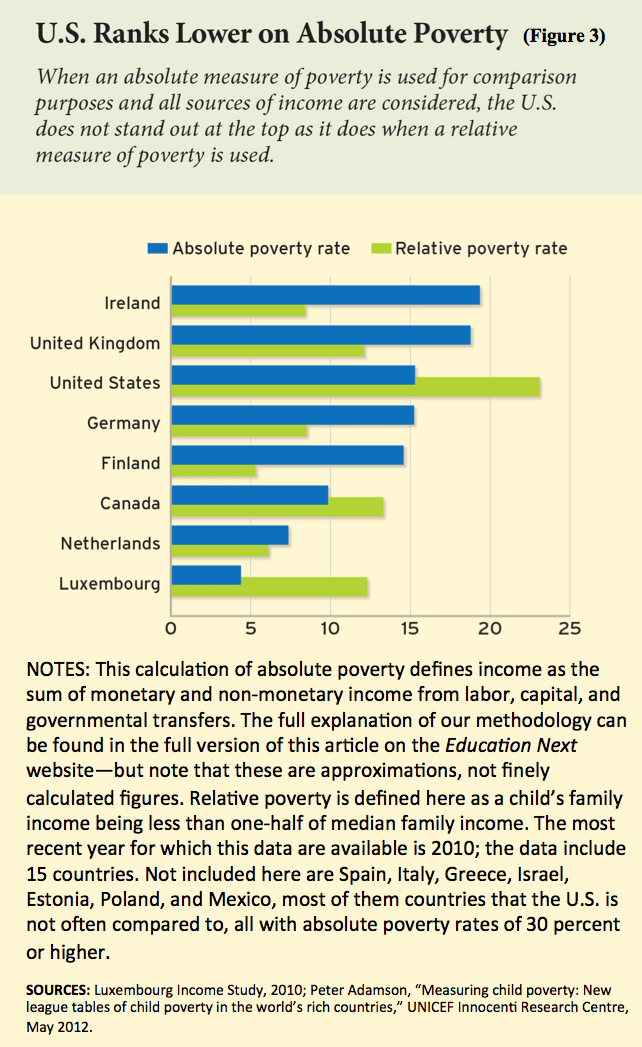
In Figure 3, using 2010 data from the Luxembourg Income Study, we approximated absolute poverty using a methodology that takes into account all forms of income, including social welfare benefits (see here for a full explanation of our methodology). By this measure, the absolute poverty rate in the United States is lower than the that of the United Kingdom, virtually the same as Germany’s, and just barely higher than Finland’s. To be sure, we still have too much poverty. But once social welfare benefits are included and we look at absolute rather than relative poverty, America is hardly an outlier. That’s because many of the U.S. households counted as poor on a relative measure would be considered middle class on an absolute measure.
The United States doesn’t really have more poverty than, say, Germany. It simply has more income inequality. As with Massachusetts, we can’t blame America’s “large number of poor students” for dragging down our average test scores because, compared to other countries, we don’t have an unusually large number of poor students.
Conclusion
Critics of education reform are certainly correct when they say that poverty is a major factor in lackluster academic performance.
Still, poverty is an issue for virtually every nation on the planet. Where reform critics get it wrong is when they claim that America’s average scores are dragged down by the particularly poor performance of low-income students—or that the advantaged kids are doing just fine. That is objectively untrue. And its scores are not dragged down by an unusually high proportion of poor students, as measures of absolute poverty find the United States not to be an outlier at all.
America’s mediocre performance is remarkably consistent. Yes, our affluent students outperform our poor students. But they don’t outperform their peers overseas.
This doesn’t imply that reform, as currently formulated, is on the right track. The enigma of our mediocre student performance is a topic worthy of study and debate, as is the challenge of helping students at all points on the economic spectrum perform better.
What it does show is that poverty can’t explain away America’s lackluster academic performance. That excuse, however soothing it may be to educators, politicians, and social critics, turns out to be a crutch that is unfounded in evidence. We need to stop using it and start getting serious about improving the achievement of all the nation’s students.
Editor’s Note: This article originally appeared in a longer and different form in Education Next—and was that publication’s most-read article of 2015.


