Management sage Peter Drucker once said, “If you want something new, you have to stop doing something old.” In recent years, policy makers have turned the page on Ohio’s old, outdated standards and accountability framework. The task now is to replace it with something that, if implemented correctly, will better prepare Buckeye students for the expectations of college and the rigors of a knowledge- and skills-driven workforce.
While the state’s former policies did establish a basic accountability framework aligned to standards, a reset was badly needed. Perhaps the most egregious problem was the manner in which the state publicly reported achievement. State officials routinely claimed that more than 80 percent of Ohio students were academically “proficient,” leaving most parents and taxpayers with a feel-good impression of the public school system.
The inconvenient truth, however, was that hundreds of thousands of pupils were struggling to master rigorous academic content. Alarmingly, the Ohio Board of Regents regularly reports that 30–40 percent of college freshman need remedial coursework in English or math. Results from the ACT reveal that fewer than half of all graduates meet college-ready benchmarks in all of the assessment’s content areas. Finally, outcomes from the “nation’s report card”—the National Assessment of Educational Progress (NAEP)—indicate that just two in five Ohio students reach a rigorous standard for proficiency in math and reading.
To rectify this situation, policy makers across the nation have lifted standards. While Ohio leaders have been guiding the transition for several years, the 2014–15 school year marked a major turning point. It was the first year for next-generation assessments that match Ohio’s new learning standards; in spring 2015, the PARCC consortium’s exams in English language arts (ELA) and math were administered in Ohio and several other states.[1] Coinciding with these new exams, policy makers also raised cut scores—the minimum score needed to be deemed proficient—in order to more honestly relay how many students are mastering the content of the state’s new academic standards.
Of course, progress is rarely simple and often tumultuous, and last year’s assessment reboot posed several difficulties. They included concerns about the amount of time spent on testing, the transition from paper and pencil to online testing, and the impact of “opt-outs” on policies linked to exam results. Meanwhile, as a result of higher cut scores for achievement, school grades on a few key measures naturally fell statewide. Having foreseen these challenges, both technical and political in nature, Ohio lawmakers instituted a policy known as “safe harbor—a short-term reprieve on the formal consequences tied to performance on state exams. As the assessment environment solidifies, the state will lift safe harbor, starting with the 2017–18 school year.
Ever since 2005, we at the Thomas B. Fordham Institute have analyzed the results of Ohio’s school report cards. This year’s analysis provides a first look at student achievement in this new—and still unsettled—era of heightened academic standards. We offer three observations. (Stay tuned for the full report, to be released on Wednesday, for the nitty-gritty detail.)
First, although Ohio raised its standard for proficiency, its new cut scores still do not yield a completely honest view of college and career readiness. Figure 1 displays a comparison of NAEP proficiency in Ohio, the state’s proficiency rate on the 2014–15 assessments, and the statewide college and career readiness (CCR) rate, using the definition adopted by the PARCC consortium.[2] Ohio policy makers still overstate the number of students who are meeting rigorous grade-level targets in math and ELA when they report 60-percent-plus proficiency.
Figure 1: Statewide student achievement on 2015 NAEP and 2014–15 state exams
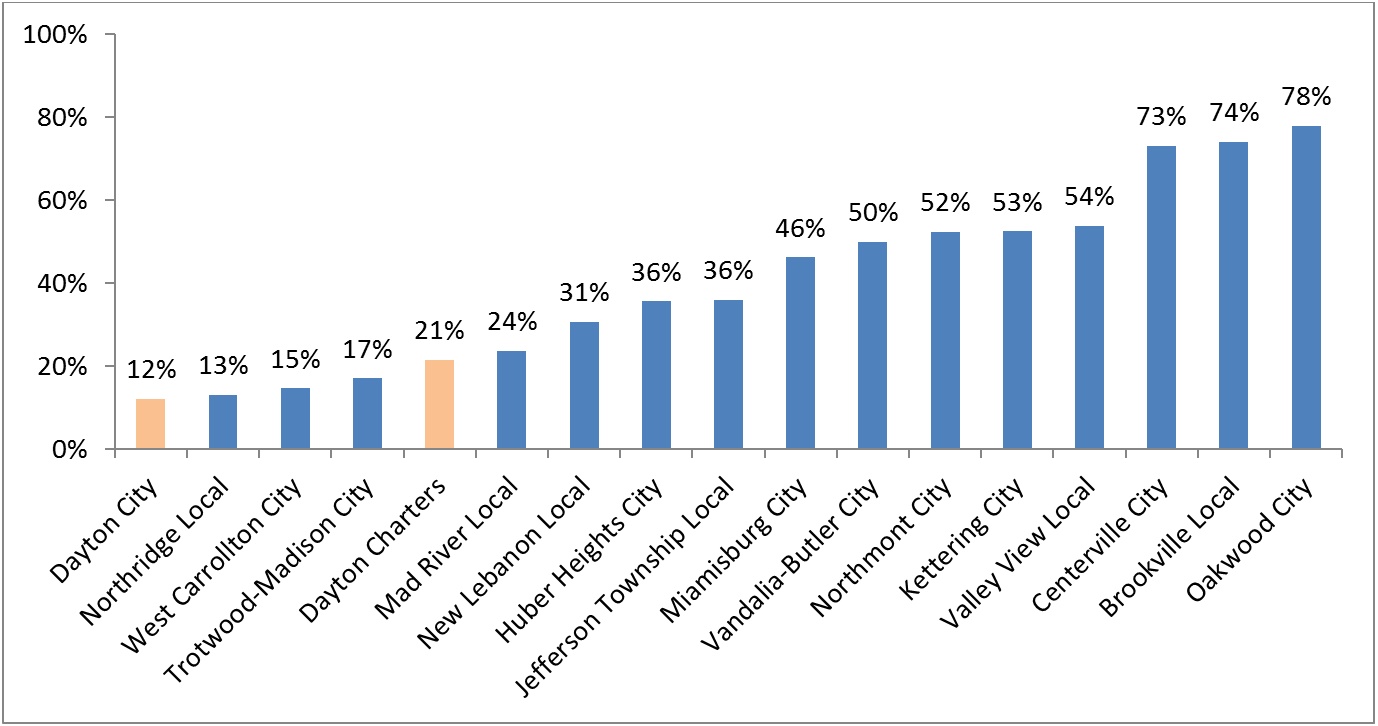
Second, when digging deeper into the state CCR results, we see the staggering inequities in educational outcomes. To be sure, education researchers have detected a wide achievement gap between historically disadvantaged students and their peers since the 1960s, but when using a rigorous gauge of student achievement, the gap appears all the more scandalous. There are several ways to portray inequity in student achievement, but consider the chart below. It displays the CCR rates in Fordham’s hometown of Dayton and its neighboring districts. We notice that in Dayton Public Schools (a high-poverty district), just 12 percent of students are on a sure academic path toward success after high school; meanwhile, upwards of 70 percent of students in a few of the region’s wealthy suburbs meet that same target. Worth noting is the fact that lagging achievement isn’t strictly endemic to Dayton; several poorer districts in the county—and the city’s charter sector—also have CCR rates under 25 percent.
Figure 2: CCR rates for Montgomery County public schools, eighth grade ELA, 2014–15

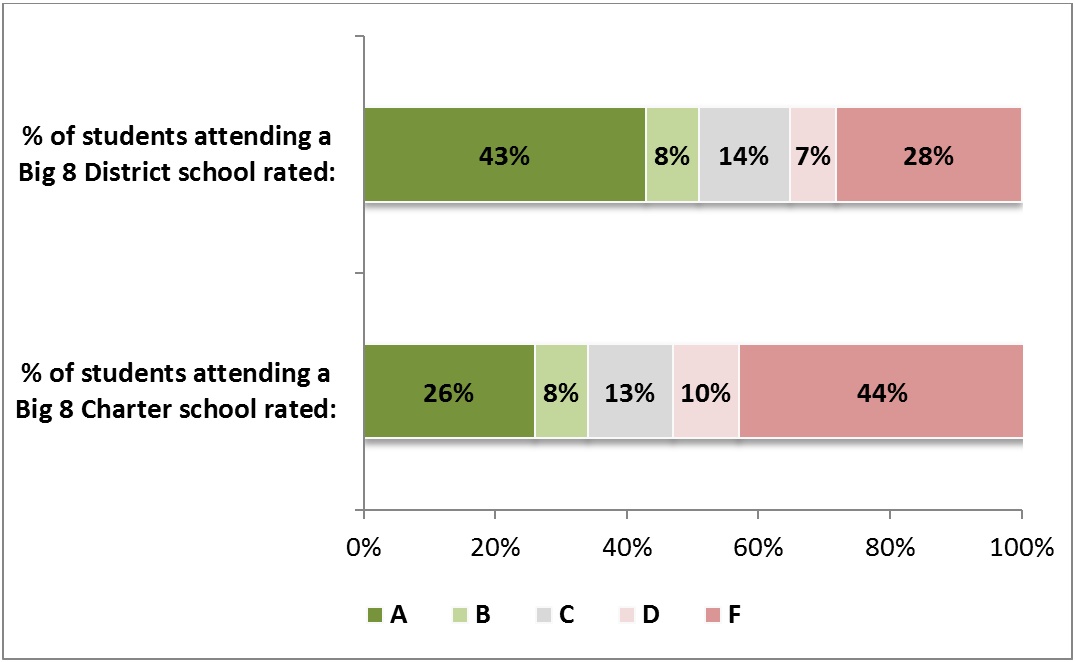
Given these troubling results, there is an acute need for outstanding high-poverty schools. But how many students have the opportunity to attend such schools? In our third and final observation, we note that a fair number of students do attend schools that are accelerating student growth (high value added), but many more enroll in schools that provide little to no growth beyond the norm. The chart below shows that the performance of urban schools on the value-added measure continues to be a mixed bag across both sectors. More than two in five students in the Big Eight districts attended an A-rated school, but one in five attended an F school. Among brick-and-mortar charter schools in the Big Eight, 26 percent of students attended an A-rated school, while 44 percent were enrolled in an F-rated school for value added.
Figure 3: Percentage of students enrolled in district versus charter school by its value-added rating, Ohio Big Eight, 2014–15[3]

* * *
What do these data all mean for policy makers and the general public? First, we must raise the level of discourse around achievement, and policy makers can aid in this task by continuing to ratchet up proficiency cut scores, as they’ve pledged to do. Not only is it a fundamental obligation of state officials to report honest statistics, but by providing an authentic gauge of whether students are on track for success after high school, parents and the public have the information needed to make course corrections before it’s too late. As Michael Cohen, president of Achieve, notes, “Parents and educators deserve honest, accurate information about how well their students are performing.…We don’t do our students any favors if we don’t level with them when test results come back.”
Second, the persistent inequity in educational outcomes must continue to be attacked in bold and perhaps unconventional ways. Happily, the report card data reveal scores of high-poverty schools that are making a difference in students’ lives (our organization proudly sponsors several high-performing urban charters). The public and philanthropic sectors would be wise to correctly identify top-notch urban schools and make aggressive investments in their growth and replication. At the same time, oversight bodies, which include school boards and charter sponsors, should consider permanently closing dysfunctional schools.
Like most states across the nation, Ohio has inaugurated a new era of education reform—one in which higher standards are de rigueur. And with a fresh start on federal education policy, states will have new opportunities to further sharpen their school reform policies in an effort to improve student learning. The work of reform isn’t finished. But at long last, in our small world of Ohio education policy, we can at least say for certain that the old has gone and the new has come.
[1] Starting in spring 2016, tests developed by the Ohio Department of Education and the American Institutes for Research will replace PARCC.
[2] Although Ohio did not officially release CCR rates, it is possible to calculate them; the consortium’s “met [CCR] expectations” is equal to the percentage of students who reach Ohio’s accelerated and advanced levels (levels 4 and 5 on Figure 1).
[3] Schools in the Toledo school district were not included, as their value-added results were not immediately released.


