Report
Career & Technical Education
Ohio’s Career-Technical Education Landscape: An overview of CTE at the high school level
Our latest policy brief provides an overview of the CTE landscape for Ohio high schoolers.
Our latest policy brief provides an overview of the CTE landscape for Ohio high schoolers.

In fall 2022, the Ohio Department of Education released state assessment results from the 2021-22 school year. The data continue to reveal the massive learnings losses that occurred during the pandemic, along with the uneven recovery in its wake. This report offers a close look at Ohio's achievement data from the 2018-19 to 2021-22 school years, and concludes with four recommendations that can help accelerate student learning across the Buckeye State.

Executive summary
Children who start strong in reading are more likely to succeed academically as they progress through middle school, high school, and beyond. Conversely, those who struggle to read in the early grades often falter as they encounter more challenging material; many become frustrated with school and drop out.
As Governor Mike DeWine asserted, the state of Ohio has “a moral obligation” on behalf of students to step in when schools are falling short of academic performance standards. Under the Every Student Succeeds Act (ESSA), federal lawmakers have given states the ability to chart their own course when it comes to fixing under-performing schools.

After a one-year pause in Ohio's school accountability system, the road back to normalcy is uncertain. Fordham's new policy brief titled Resetting school accountability, from the bottom up offers a clear and concise plan to restart state assessments and school report cards.
Now in its fourth edition and fully updated for 2020, Ohio Education by the Numbers Education is a look at vital statistics about Ohio’s schools and the students they serve. We intend it to be a readily accessible resource that keeps education stats—with cites to original sources—at your fingertips.

Since 2005, the Thomas B. Fordham Institute has published annual analyses of Ohio’s state report cards.
Across the nation, headlines have trumpeted soaring high-school graduation rates. Ohio is no exception. Lofty rates leave the impression that the vast majority of students are ready to take their next steps in life. But the truth is that too many students exit high school not fully prepared for college and career.
According to a recent What Works Clearinghouse review, the most effective dropout-prevention strategy is to directly connect schoolwork to students’ career aspirations.
Creating smart, coherent education policy is painstaking work; there are technical, budgetary, and political challenges at almost every turn. But it is some of the most important work that state leaders can undertake.
"Everyone is entitled to his own opinion, but not to his own facts." -- Senator Daniel Patrick Moynihan. That sentiment has never been more profound and applicable than it is today.

Since 2005, the Thomas B. Fordham Institute has published annual analyses of Ohio’s state report card data, focusing on district and charter schools in Ohio’s Big Eight urban areas: Akron, Canton, Cincinnati, Cleveland, Columbus, Dayton, Toledo, and Youngstown.
Education will always be one of Ohio’s highest priorities. It bonds communities together, provides the foundation for the state’s long-term economic success, and—most importantly—helps students across the state to realize their potential and pursue their dreams.

For more than a decade, Ohio’s annual school report cards have offered the public information on school quality. The current iteration of report cards has notable strengths: School ratings are grounded in hard data, they use an intuitive A-F rating system, and several of the metrics encourage schools to pay attention to the achievement of all students.

The Thomas B. Fordham Foundation’s sponsorship annual report highlights our work with eleven schools that served 4,150 students in five Ohio cities during the 2016-17 school year.
Interdistrict open enrollment allows students to attend public schools outside their district of residence. It is among the largest and most widespread of school-choice efforts in the United States but often flies under the radar in policy discussions. In Ohio, over 70,000 students open enroll into schools outside their district of residence.

This guidebook offers simple and easy-to-use vital statistics about Ohio’s schools and the students they serve. The facts and figures contained within this report offer an overview of who Ohio’s students are; where they go to school; how they perform on national and state exams; and how many pursue post-secondary education.

On September 15, Ohio released report cards for approximately 600 school districts and 3,500 public schools (district and charter). These report cards are based on state exam results from the 2015-16 school year, along with several other gauges of student success.

A deep dive into the performance of Ohio’s public schools, statewide and in its eight largest urban areas

The 2015 Fordham Sponsorship Annual Report is our opportunity to share the Fordham Foundation’s work as the sponsor of eleven schools serving approximately 3,200 students in five cities, and our related policy work in Ohio and nationally.
Like other states, Ohio has over the past few years put into place a standards a

Charter schools are quickly becoming a defining feature of Ohio’s public-education landscape, educating over 120,000 children statewide. The “theory of action” behind charters is fairly simple.

The 2014 Fordham Sponsorship Annual Report is our opportunity to share the Fordham Foundation’s work as the sponsor of eleven schools serving 3,200 students, and our related policy work in Ohio and nationally. We are fortunate as an organization that our policy work benefits our sponsorship efforts; and, that our lessons from sponsorship inform our policy and advocacy strategies.

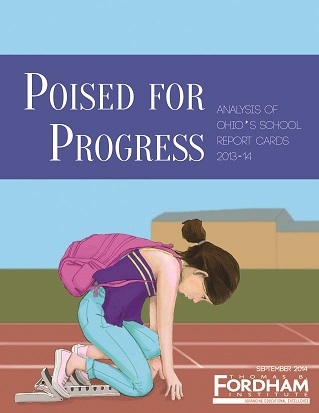
On September 12th, Ohio released school report-card ratings for the 2013-14 school year. This report compiles and analyzes the statewide data, with special attention given to the quality of public schools in the Ohio Big Eight urban areas: Akron, Canton, Cincinnati, Cleveland, Columbus, Dayton, Toledo, and Youngstown (both district and charter school sectors).
Roughly 30,000 kids in Ohio take advantage of a publicly funded voucher (or “scholarship”).

Fordham's 2012-13 sponsorship annual report addresses our schools’ perspective regarding persistent challenges and how the schools address those challenges.
This report is based on the responses to an online survey conducted in Spring 2013 with 344 school district superintendents in Ohio. The survey covered seven education policies, specifically: Common Core State Standards, teacher evaluations, the Third Grade Reading Guarantee, open enrollment, A-to-F ratings for schools and districts, individualized learning (blended learning and credit flexibility), and school choice (charter schools and vouchers). It also included several questions on general attitudes towards school reform in Ohio and two trend items. Download today to discover the key findings!

Profiles of six public high schools that serve poor and minority students to high levels of excellence.

Our annual analysis of school performance in our home state's major urban areas, plus a projection of proficiency rates when the PARCC exams arrive in 2014-15.