Mobile Navigation

  • National
    • Policy
      • High Expectations
      • Quality Choices
      • Personalized Pathways
    • Research
    • Commentary
      • Gadfly Newsletter
      • Flypaper Blog
    • Events
    • Scholars Program
  • Ohio
    • Policy
      • Priorities
      • Media & Testimony
    • Research
    • Commentary
      • Ohio Education Gadfly Biweekly
      • Ohio Gadfly Daily
  • Charter Authorizing
    • Application
    • Sponsored Schools
    • Resources
  • About
    • Mission
    • Board
    • Staff
    • Career
Home
Home
Advancing Educational Excellence

Main Navigation

  • National
  • Ohio
  • Charter Authorizing
  • About

Ohio Menu

  • Topics
    • Accountability & Testing
    • Advanced Education
    • Career & Technical Education
    • Charter Schools
    • Curriculum & Instruction
    • ESSA
    • Evidence-Based Learning
    • Governance
    • Personalized Learning
    • Private School Choice
    • School Finance
    • Standards
    • Teachers & School Leaders
  • Research
  • Policy
  • Commentary
    • Ohio Gadfly Newsletter
    • Ohio Gadfly Blog
    • Events

The Education Gadfly Weekly

Sign Up to Receive Fordham Updates

We'll send you quality research, commentary, analysis, and news on the education issues you care about.
Thank you for signing up!
Please check your email to confirm the subscription.

Ohio Gadfly Biweekly—Ohio is fast becoming a great place for quality charter schools

Volume 13, Number 18
7.25.2019
7.25.2019

Ohio Gadfly Biweekly—Ohio is fast becoming a great place for quality charter schools

Volume 13, Number 18
view
Ohio charter sector quality growth
School Choice

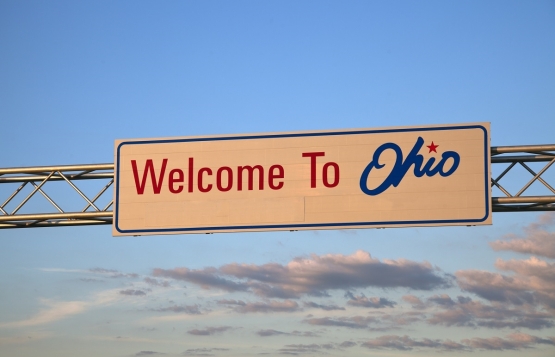
Ohio is fast becoming a great place for quality charter schools

For many years, first-rate charter networks looked at Ohio and immediately “swiped left.” Sadly, the state’s charter sector had a well-earned reputation for mediocre performance, was too often mired in

Aaron Churchill 7.25.2019
OhioOhio Gadfly Daily

Ohio is fast becoming a great place for quality charter schools

Aaron Churchill
7.25.2019
Ohio Gadfly Daily

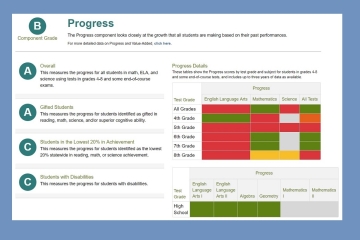
Time to bring the value back into Ohio’s “value added” school grades

Vladimir Kogan | Stéphane Lavertu
8.5.2019
Ohio Gadfly Daily

Four things the budget didn’t do that Ohio lawmakers should tackle next

Jessica Poiner
7.29.2019
Ohio Gadfly Daily

School funding in Ohio: How much is being spent and should we spend more?

Aaron Churchill
7.31.2019
Ohio Gadfly Daily

The long-term effects of private school choice on college enrollment and graduation

Jessica Poiner
8.5.2019
Ohio Gadfly Daily

Hidden from the headlines

7.30.2019
Flypaper
view
value added measure

Time to bring the value back into Ohio’s “value added” school grades

Vladimir Kogan, Stéphane Lavertu 8.5.2019
Ohio Gadfly Daily
view
Next education policies

Four things the budget didn’t do that Ohio lawmakers should tackle next

Jessica Poiner 7.29.2019
Ohio Gadfly Daily
view
School funding in Ohio, part 1

School funding in Ohio: How much is being spent and should we spend more?

Aaron Churchill 7.31.2019
Ohio Gadfly Daily
view
Voucher SR image

The long-term effects of private school choice on college enrollment and graduation

Jessica Poiner 8.5.2019
Ohio Gadfly Daily
view

Hidden from the headlines

John A. Dues 7.30.2019
Flypaper
view
Ohio charter sector quality growth

Ohio is fast becoming a great place for quality charter schools

Aaron Churchill
7.25.2019
Ohio Gadfly Daily

For many years, first-rate charter networks looked at Ohio and immediately “swiped left.” Sadly, the state’s charter sector had a well-earned reputation for mediocre performance, was too often mired in controversy, and suffered from skimpy funding.

But all that is rapidly changing due to bold policy reforms—so much so that Ohio is quickly transforming into an attractive locale for high-performing schools. Two critical policy advancements are creating a healthy environment where quality charters can take root.

  1. Recognizing the need to overhaul its charter laws, the General Assembly passed landmark reforms in 2015. The notable changes include strengthening charter authorizer policies to demand more responsible oversight practices; closing statutory loopholes that allowed chronically low-performing schools to escape accountability; and enacting several commonsense governance provisions. These forceful reforms have reshaped the charter sector. Dozens of low-capacity authorizers and poor-performing schools, including an abysmal online school, have gone away. This sifting process is restoring confidence that charters can govern themselves responsibly, and it’s helping to protect the reputation of top performers. Most importantly, these reforms are starting to bear fruit when it comes to pupil achievement: School report card ratings and a recent CREDO evaluation both indicate that brick-and-mortar charter performance is on the upswing.

  2. Cognizant of the state’s large charter-funding gaps, Governor Mike DeWine and the legislature just this month enacted a milestone appropriation that drives additional state dollars to high-performing, high-poverty charter schools. Over the next two years, $60 million—up to $1,750 per low-income student—in supplemental funding will be disbursed to quality charters so that they can increase their capacity to serve more children in need of a great education. Importantly, these funds are also available to stellar national charter networks seeking to expand into the Buckeye State. Overall, the passage of this funding program demonstrates an appetite among lawmakers to leverage state dollars to support great charters, and it represents a big step forward in efforts to narrow funding disparities.   

While Ohio’s policy environment for charters has dramatically improved, the need for extraordinary, beat-the-odds charter schools remains acute. Consider just a few data points about students attending schools in Ohio’s “Big Eight” cities—areas that have historically faced major educational challenges. (For a more comprehensive review, see this report.) Figure 1 shows that seventh grade proficiency rates slump well below the state average and are mostly stuck in the 30s, even dipping as low as 19 percent in Youngstown.

Figure 1: Seventh grade ELA and proficiency across Ohio Big Eight districts, 2017–18

Seventh Grade ELA proficiency​

Note: The statewide average in seventh grade ELA and math was 64 and 59 percent, respectively.

The next figure reveals depressingly low percentages of students reaching the state’s college-remediation-free benchmarks on the ACT or SAT exams.

Figure 2: Remediation-free ACT or SAT scores across Ohio Big Eight districts, classes of 2016 and 2017

Remediation free ACT and SAT​

Note: The statewide average remediation-free rate was 26 percent.

Last, we see that too few Big Eight schools, whether district or charter, make significant impacts on student growth over time. Figure 3 shows that just 17 percent of district schools in the Big Eight achieved an A or B on the state’s “value added” growth measure. Meanwhile, 64 percent received an F. Unfortunately, students stuck in these low-rated schools are unlikely to be making the progress needed to reach rigorous academic benchmarks by the time they exit high school.

Figure 3: Distribution of overall value-added ratings across Big Eight schools (district and charter), 2017–18

Overall value added distribution​

***

Ohio has a lot going for it. Wallet Hub, for instance, recently ranked Ohio as one of the top states in the nation for fun, and CNBC just rated us the tenth best state for business. We’ve got great parks, beautiful lakefront, prestigious colleges and universities, museums, big-time athletics, and hopping (or hipster, if that’s your thing) urban areas.

Thanks to state legislators’ courageous reforms, Ohio is undergoing a renaissance in its charter school sector. Yet the need for excellent schools remains great. Tens of thousands of students, many from less prosperous backgrounds, are still waiting for a life-changing education. For all the terrific charter networks out there: Will you join us?

view
value added measure

Time to bring the value back into Ohio’s “value added” school grades

Vladimir Kogan | Stéphane Lavertu
8.5.2019
Ohio Gadfly Daily

NOTE: The Thomas B. Fordham Institute occasionally publishes guest commentaries on its blogs. The views expressed by guest authors do not necessarily reflect those of Fordham.

There is one goal that all Ohioans share: We want our children to have a high-quality education. But pursuing this goal requires that we measure “quality” correctly. Without a valid measure, parents cannot choose the best educational options for their kids, state and local policymakers cannot properly monitor and govern the schools they oversee, and educators cannot improve their instruction. A bad measure of educational quality can lead parents, policymakers, and educators to inadvertently undermine students’ learning and, ultimately, their life chances.

Measuring school quality is tricky. One must somehow disentangle a school’s contribution to student learning from all other factors over which schools have little influence, such as a student’s motivation and ability, parental involvement and resources, and peer influence. Average proficiency rates at the school or district level are largely attributable to these outside influences. Consequently, praising a school for high proficiency rates is akin to praising it for being wealthy, and disparaging a school for low proficiency rates is akin to punishing it for serving students from poor households. In fact, it is common for schools with low proficiency rates to be of higher quality—in that they impart more knowledge and skills during the school year—than schools with high proficiency rates.

Fortunately, there is a large body of rigorous research that provides clear direction on how to measure school quality. This research indicates that measuring student test score growth from year to year allows one to isolate teacher, school, and district contributions to student learning, or “value added.” For example, one study estimated school value added in this way and sought to determine whether it truly captured the educational effectiveness of those schools. To check, the researcher took advantage of a policy that randomly assigned students to schools. If the value-added estimates were valid, then each of those randomly-assigned students would improve their test scores in math and reading by the amount predicted by each school’s value-added estimates from the prior year. That is exactly what the author found. Moreover, research shows that students with higher-quality teachers—as measured by value-added achievement-growth estimates—experience superior life outcomes.

The bottom line is worth reiterating: Rigorous research indicates that, if estimated properly, value-added measures capture school contributions to student learning, and such test score gains correspond to better real-world outcomes later in life.

The good news is that Ohio has long incorporated value-added measures in its school accountability system, and research indicates that its underlying value-added calculations have significant strengths. For example, by accounting for multiple prior years of student test scores, Ohio’s value-added estimates should more accurately and precisely capture school quality than estimates that fail to do so. Unfortunately, the way that value-added estimates are incorporated into Ohio’s school and district report cards significantly undermines these strengths—leading to year-to-year volatility in school and district grades, which understandably confuses stakeholders and weakens their confidence. Let’s fix that problem.

Separating student achievement growth from “margin of error”

The statistical model that Ohio uses to calculate school value added is technical, but the underlying logic should make sense to those familiar with political polling. When an opinion survey asks voters which candidate they are likely to support in the next election, pollsters typically report two quantities: (1) a candidate’s lead in percentage points and (2) whether the lead is within the “margin of error.” The second component accounts for the inherent uncertainty in any statistical calculation. For example, with a margin of error of plus or minus five points, a candidate ahead by just two points will not rest on her laurels because she will not have much confidence that her lead is real.

Value added works the same way. For each school and district, the state constructs a measure of achievement growth that tells us whether the average student demonstrated more or less than a year’s worth of learning, as well as a “margin of error” for that estimate. If the calculation indicates that, on average, a school’s students demonstrated more than a year’s worth of learning, but the difference is within the margin of error, we can’t be certain that these students really outperformed their peers attending other campuses.

Ohio’s value-added system relies on both the raw growth calculations (known as “gain scores”) and their associated margins of error. The gain score tells us the difference between the average student’s test score growth and a baseline of expected growth. The margin of error tells us whether the gain score is statistically significant—that is, whether this difference is unlikely to be due to chance. As originally implemented in 2008, when the gain score was within the margin of error—that is, when the difference between student achievement growth and expected growth was not statistically different from zero—Ohio report cards would label schools or districts as having “met” the growth target. Those with negative gain scores beyond the margin of error were labeled as “below” the growth target, and those with positive gain scores beyond the margin of error were deemed “above” the growth target. These designations were meant to identify schools for which we had strong evidence that their students were falling behind—those whose negative “gain scores” were unlikely to be due to random measurement error—and to recognize those posting impressive growth.

Although report cards did not indicate what the actual gain scores were (more on that in a bit), this methodology was statistically sound. The value-added metric became somewhat problematic, however, when lawmakers replaced the “met,” “below,” and “above” value-added designations with five categories corresponding to letter grades A through F. They based these letter grades on different levels of statistical significance—essentially, by defining different thresholds for calculating the margin of error. Schools and districts received A’s if the statistical model indicated great confidence that they had gain scores greater than zero (akin to the “above” designation) and B’s if the model indicated less confidence that a school or district exceeded expected gains. D and F designations were based on similar thresholds for schools and districts with negative gain scores, and a C designation went to schools and districts with student achievement growth that was not statistically different than expected.

There are multiple problems with this change. One problem is due to how stakeholders interpret letter grades. The implication is that a school with an A imparts more knowledge than one with a B. But that is not necessarily the case. For example, a school might receive a B simply because it has fewer students—a smaller sample size—than the school that received an A, even if students in the former actually posted higher growth. Another problem is that switching from three to five performance categories meant that the difference in the error thresholds became quite small—particularly for D’s and B’s. Thus, it became likely that from year to year, by random chance, a school or district bounced from A to C, or from C to F.

These problems are serious when one considers the stakes associated with report card grades. Note that these issues are not a consequence of the underlying value-added methodology, which remains strong, but simply due to how the scores it produces are translated into the categories reported on the school and district report cards.

This year’s state budget makes major changes to the grades but retains the essential limitations of the A through F grading, including its reliance on arbitrary statistical significance thresholds. Instead of addressing the root of the problem, the updates simply change how specific margins of error map onto test scores. The changes allow districts and schools to receive higher report card grades with no change in actual performance—for example, allowing those with negative growth to receive a B and giving a C to districts and school buildings that would have received the lowest “below” designation under the old classification system.

Make value added valuable

We have two general recommendations for improving the value-added metric.

First, we recommend that report cards provide the actual gain score that indicates how much achievement growth a school or district’s students experienced relative to what is expected in each grade, as opposed to merely reporting the statistical significance of that growth. That would be far more informative for all stakeholders—such as parents, teachers, administrators, and other interested citizens—and it would put far less weight on arbitrary benchmarks of statistical significance. This would be a more transparent system—particularly if the estimates are translated into a more intuitive metric, such as percentiles.

Second, we recommend that accountability-related assessments of the reported growth estimate be based on large student samples and a high benchmark for statistical significance. These changes should lessen the extent to which measurement error affects stakeholder conclusions about school quality. This option could entail simply going back to the original three-category methodology, in which schools and districts are judged as “above,” “met,” or “below” typical growth based on whether the gain scores were outside of the margin of error.

Ohio could also combine these recommendations. Although this might be too much detail for some readers at this early stage, what we have in mind is integrating the raw gain scores and their margins of error into a single metric, essentially shrinking growth estimates toward zero when they are estimated less precisely. A number of individual school districts already do this for their teacher evaluation systems, and Ohio’s own teacher evaluation system already incorporates one form of such statistical “shrinkage.”

Whatever policymakers decide to do, we recommend reporting the gain score using an intuitive metric (as opposed to merely a letter grade) and to link it to report card grades in a more precise way.  For example, in addition to presenting the gain scores in terms of percentiles, report cards could indicate whether schools “met” or “exceeded” expected achievement growth based on a stringent benchmark for statistical significance. In turn, schools that met or exceeded this benchmark could receive an overall report card grade no lower than a C. Such a strategy would provide more useful information (the gain score), minimize volatility in overall report card grades, and avoid the punishment of effective schools that serve disadvantaged students.

To be sure, each approach we have reviewed has its own set of tradeoffs. It’s important that lawmakers make further changes carefully and deliberatively, anticipating the unintended consequences. But it is also clear that a change in the reporting and grading system is needed. Having a value-added system that ignores the actual growth scores and relies on arbitrary statistical thresholds can undermine the efforts of parents, policymakers, and educators who work so hard to deliver a high-quality education to our children. It is rare that rigorous research offers such clear policy guidance, but that is the case with value added. We know that measuring school quality in this way is valid—that it captures school contributions to student learning, and that this learning is predictive of life outcomes. Let’s take advantage of that knowledge.

Vladimir Kogan is an associate professor in The Ohio State University’s Department of Political Science and (by courtesy) the John Glenn College of Public Affairs. Stéphane Lavertu is an associate professor in The Ohio State University’s John Glenn College of Public Affairs. The opinions and recommendations presented in this editorial are those of the authors and do not necessarily represent policy positions or views of the John Glenn College of Public Affairs, the Department of Political Science, or the Ohio State University.

view
Next education policies

Four things the budget didn’t do that Ohio lawmakers should tackle next

Jessica Poiner
7.29.2019
Ohio Gadfly Daily

Last fall, Fordham began releasing a series of education reform proposals for policymakers to consider in the budget cycle.

Now that Governor DeWine’s first budget season has (finally) come to a close, it’s worth taking a second look at these recommendations. Several of them—such as expanding eligibility to private school scholarships and investing in brick-and-mortar charter schools—were incorporated into the budget. But there are others that didn’t make the cut. Here are four policies worthy of consideration when lawmakers return from summer break.

1. Provide tax benefits to employers that train apprentices

Career and technical education (CTE) is a hot topic in Ohio. The state budget included $25 million to increase the number of students who earn industry-recognized credentials. Ohio is also in the midst of drafting a state plan for Perkins V, the recently reauthorized federal law that governs how states implement and expand access to CTE programs. Ohio is already implementing a temporary plan that promises the creation of a pilot program aimed at coordinating work-based learning (WBL) opportunities for students. WBL can take many forms, but one of the most promising is an apprenticeship, which allows students to gain paid on-the-job training and allows businesses to build their talent pipelines.

In Ohio, students ages sixteen and up can participate in one of the state’s registered apprenticeships. There are no state data on how many high schoolers participate in this form of WBL, but it’s unlikely to be many. That could be because employers don’t see it as a cost-effective recruitment and training strategy. To fix that, lawmakers could allow businesses to reduce their state tax liabilities based on the number of students who complete a state-registered apprenticeship at their worksite.

2. Create a data system that links K–12, higher education, and workforce outcomes

Between the student-focused budget and initiatives like Attainment Goal 2025, New Skills for Youth, and Perkins V implementation, Ohio is taking big steps forward in supporting more seamless transitions from high school into college and career. But without high quality data, it’s impossible to measure results and track them over time. That’s why the state should start connecting K–12 and higher education data with workforce outcomes such as wages, career fields, and unemployment records. An integrated information system—which fully protects individual student level privacy—would allow the Ohio Department of Education and the Ohio Department of Higher Education to fulfill federal requirements within Perkins V and ESSA, and more importantly would provide the public, advocates, and researchers with quality data about how various college and career readiness initiatives are progressing.

3. Create a curriculum-review committee

Ohio has had its fair share of debates over standards, but very few conversations have paid attention to curriculum—a key lever for successfully implementing high standards. That’s a shame, since research shows that curriculum reform can have a big impact. Louisiana, for example, has seen some serious growth on state tests, the ACT, and  AP exams since tackling curriculum reform. I’ve written before about how Ohio could follow in Louisiana’s footsteps. A good place to start would be for ODE to establish an independent review committee comprising Ohio educators to evaluate the quality of textbooks and curricular materials. Their recommendations would help districts select the best materials, and ODE could incentivize good choices by offering them at a discount. Critically, final decisions about what curricular materials to adopt would remain a local prerogative.

4. Provide clear information to parents about college readiness

Class grades, GPAs, and feedback from teachers are important, but state tests are unique because they provide parents with an objective “external audit” of student learning. Many families use state test results to double-check that their students are on track for college. Unfortunately, the proficiency standards Ohio uses for state exams aren’t aligned with college-ready benchmarks. Thousands of students pass through the K–12 system believing they’re on a pathway to college thanks to their proficient scores on state exams, only to take entrance exams like the ACT or SAT and discover they aren’t likely to qualify for admission to the school of their dreams or will have to take expensive, non-credit-bearing remedial courses if they get on campus.

My colleague Aaron Churchill has proposed several solutions for this data mismatch. They include changing proficiency cut scores to more closely align with college-ready benchmarks, or overhauling the classification system entirely. Although neither of these options would impact graduation rates—the graduation standard would still be set lower than college-ready—changes to cut scores are almost always controversial. A more politically tenable option might be to improve the reports of statewide exam results that parents receive. Starting in middle school, these reports could include data that predict what a student’s ACT or SAT score would be, based on state exam results. This calculation can already be done, but it isn’t currently shared with parents. The information would give parents and guardians a more accurate picture of their students’ growth and would ensure that they don’t find out too late that their children are off-track.

***

There’s still plenty to unpack after this busy budget season, and looming debates about academic distress commissions, school funding, and report cards are sure to dominate the fall legislative session. But pursuing the four policies outlined above would go a long way toward proving that lawmakers are ready and willing to keep their focus on doing what’s best for kids year-round. Here’s hoping that’s exactly what they do!

view
School funding in Ohio, part 1

School funding in Ohio: How much is being spent and should we spend more?

Aaron Churchill
7.31.2019
Ohio Gadfly Daily

In the coming weeks, I’ll be working on a blog series that digs into Ohio’s school funding system. Although the topic is always relevant, school funding is poised to take center stage as state policymakers mull legislation put forward by Ohio Representatives Robert Cupp and John Patterson. Their proposal, developed in conjunction with a group of school district officials, would create a new state funding framework. Forthcoming posts will attempt to cover the key policy issues, such as the base amount, the allocation formula, “caps and guarantees,” school choice programs, incentive funding, supplemental aid for low-income students, and more. Get ready. It’s bound to get wonky.

Before diving into particulars, it’s important to look at the big picture. Just like purchasing a car, one of the first things legislators should consider is the sticker price. Bottom line: This is a Cadillac school funding plan.

According to recent estimates, a fully implemented plan would spread an additional $1.5 billion per year in state aid across Ohio public schools, a roughly 15 percent increase above current state expenditures on K–12 education. To ease the fiscal pain, the plan includes a phase-in period in which the state would fund just 16.7 percent of the costs in year one and end with a fully funded plan by year six. Yet even this gradual implementation would add about $350 million in year one to the state budget, rising to $650 million in year two relative to current levels.[1] These numbers don’t even include additional spending expected after studies on special-education and poverty costs are completed. Despite the hefty price tag, the plan does not identify a revenue source to cover the added costs, perhaps naively assuming that good economic times will keep on rolling (and raising questions about what happens if they don’t).

Given the sizeable spending increase being proposed, we first need an understanding of how much Ohio currently spends on K–12 education, as surveys find that citizens underestimate school spending. Does the state have a serious problem with “underfunding” its public schools that might warrant such a large cash infusion? Or does spending appear to be at reasonable levels and generally in line with the rest of the nation? And would simply injecting more taxpayer money into the public-education system be likely to boost student achievement?

Ohio’s current school expenditures

The chart below, taken from our webpage Ohio By The Numbers, displays the most recent per-pupil spending data published by the U.S. Department of Education for Ohio and several neighboring states. The expenditures reported below include operational expenses—things like classroom instruction and support services—but exclude capital outlays and interest payments. These data reflect the spending of funds derived from local, state, and federal taxpayer sources (about 90 percent is state and local).  

Figure 1: Ohio school expenditures versus national and nearby states, FY 2016
 

School funding in Ohio, part 1 fig 1​

Data source: National Center for Education Statistics (NCES).

As figure 1 shows, Ohio spends on average almost $12,000 per student, not including capital expenses. Unfortunately, there is no clear scientific way to determine whether this amount is “enough,” but we can think about it in a few ways. First off, one could ask whether they’d pay this amount out-of-pocket for public education, assuming no school taxes. Would we consider this price too steep? A bargain? Of course, we don’t permit the “invisible hand” to determine the value of public education, so we are left trying to figure out how much to spend through the political process. At a macro level, one possible way citizens and policymakers could view Ohio’s overall spending on K–12 education is to compare expenditures to other states. If spending lags way behind, Ohio could risk losing educator talent to states that can afford to offer higher compensation—an argument that was recently made in the low-spending state of Oklahoma. Yet as figure 1 above indicates, Ohio’s expenditures track closely with the national average and they surpass those of nearby states such as Michigan and Indiana. They do, however, fall short of Pennsylvania and Illinois, and overall, Ohio ranks nineteenth in the nation in per-pupil expenditures—neither among the biggest spenders nor the thriftiest either.[2] 

Spending and student achievement

Now let’s say Ohio legislators choose to “go big” on school spending, perhaps approving the nearly $1,000 per student in extra spending the Cupp-Patterson plan recommends.[3] Should taxpayers expect big achievement gains? In general, academics are divided about the returns to K–12 expenditures, and the state-level data displayed in figures 2 and 3 offer some basic insight into why no clear consensus has emerged. We notice that some higher-spending states—places like Illinois, New York, and Pennsylvania—fare very similar (and sometimes worse) than Ohio on national exams. Still, the über-high-achieving Massachusetts might offer a case for higher spending (mindful of course of its strong accountability systems and higher cost of living). But then again there’s Indiana, a state that spends less than Ohio yet achieves superior results on reading and matches us in math. This is not to say that additional dollars won’t ever provide an educational boost. There is evidence indicating that they can improve low-income students’ outcomes (and evidence that they don’t), but the notion that spreading more money widely around the state, as the Cupp-Patterson plan generally does, will automatically raise results rests on shaky ground.

Figure 2: Eighth grade reading achievement on the 2017 NAEP versus FY 2016 per-pupil expenditures
 

School funding in Ohio, part 1 fig 2​

Figure 3: Eighth grade math achievement on the 2017 NAEP versus FY 2016 per-pupil expenditures
 

School funding in Ohio, part 1, fig 3​

Source: National Assessment of Educational Progress (NAEP) and NCES. Note: The per-pupil expenditures displayed in figures 2 and 3 do not adjust for regional cost-of-living differences across states. However, the overall picture of spending versus achievement does not change noticeably when using spending data adjusted for cost-of-living. For charts displaying those data, please see this link.

***

The hefty price tag of the Cupp-Patterson plan should be the first thing legislators scrutinize. In so doing, they need to bear in mind the significant funds already being spent on students’ K–12 education. At the same time, policymakers should ponder whether the extra costs would be commensurate with added benefits to students. On both counts, legislators—especially fiscal conservatives—may have reason for concern.

Nevertheless, if Ohio were in the midst of a baby- or immigration-boom, or if schools were being asked to educate increasing numbers of harder-to-serve children, it would make sense to ramp up spending. In the next post, I'll take a look at whether these factors are in play.


[1] The most recent cost estimates—released in early July just prior to the passage of the state budget for FYs 2020–21—do not take into account the increased K–12 expenditures associated with the “Student Wellness and Success” program. Whether those funds would remain in an updated Cupp-Patterson plan is not yet known.

[2] According to an Education Week analysis of FY 2016 data, Ohio ranks twenty-first highest in the nation in per-pupil spending after adjusting for regional cost-of-living differences.

[3] There are approximately 1.6 million students in Ohio, and in general, the Cupp-Patterson plan disburses the extra funds widely across Ohio’s public schools (school districts, joint-vocational districts, and charters and STEMs).

view
Voucher SR image

The long-term effects of private school choice on college enrollment and graduation

Jessica Poiner
8.5.2019
Ohio Gadfly Daily

As with most education issues, the research on private school choice is a mixed bag. Some studies indicate positive effects, while others suggest neutral or negative effects. What the vast majority of studies have in common is a focus on short-term outcomes—mostly student test scores. But the Urban Institute has published several reports over the last few years—three of which they recently updated—that examine longer-term outcomes, such as college enrollment and graduation. These studies are a critical addition to the canon of private school choice research, as people with stronger post-secondary attainment levels are likely to lead healthier lives, earn more income, and avoid the welfare and criminal justice systems.

One evaluation focused on the Florida Tax Credit Scholarship program (FTC), which began providing scholarships to low-income students during the 2002–03 school year. To study FTC’s impact on college enrollment and graduation, researchers used data from the Florida Department of Education that were linked to records from Step Up for Students, the nonprofit that administers FTC, and the National Student Clearinghouse, a nonprofit organization that collects data on post-secondary enrollments and outcomes. Analysts studied the outcomes of just over 16,000 FTC participants who took standardized reading and math tests in a Florida public school, then participated in FTC the following year. Each of these students was matched to five nonparticipating students enrolled in the same baseline school, grade, and year, and with similar characteristics such as test scores, race, and free lunch participation.

Results indicate that students participating in FTC during elementary and middle schools are 6 percentage points more likely to enroll full time in a two- or four-year college. Those who participated in FTC for the first time in high school were a whopping 10 percentage points more likely to enroll in college than their non-FTC peers. Results also found modest but positive estimated impacts on bachelor’s degree attainment: Students who entered FTC in elementary or middle school showed an increase in completion of 1 percentage point, while those entering in high school showed an increase of 2 percentage points. The estimated impact on enrollment and degree attainment tended to increase based on the number of years students participated in FTC.

Another evaluation looked at the Milwaukee Parental Choice program (MPCP), which was created in 1990 and has grown to serve nearly 29,000 students in 2018–19. For this report, the dataset included a sample of 1,926 MPCP students in grades three through eight, as well as 801 ninth graders, for a total of 2,727 students. Each MPCP student was matched to a similar student enrolled in Milwaukee Public Schools (MPS) in 2006 based on grade level, neighborhood, initial test scores, and demographic variables. Data on college enrollment and graduation came from the National Student Clearinghouse.

Findings indicate that ninth grade students enrolled in MPCP and MPS attended two-year colleges at nearly equal rates, but MPCP students were significantly likelier to enroll in a four-year university. Estimated graduation rates for two- and four-year institutions were about the same for both groups. Students enrolled in MPCP in 2006 in grades three through eight, meanwhile, were 5 percentage points more likely to enroll in any type of college by 2018. In terms of completion, only 3 percent of students from both MPCP and MPS graduated from a two-year college by 2018. At four-year colleges, however, MPCP students graduated at a rate 3 percentage points higher than their public school peers—a statistically significant difference.

The third evaluation looked at Washington, D.C.,’s Opportunity Scholarship Program (OSP)—the nation’s only federally funded voucher program. Available to D.C. residents who attend participating private schools, it has enrolled 1,000–2,000 students annually since its creation in 2004. Researchers used a different methodology than what was employed for the Florida and Milwaukee studies, and examined the college enrollment patterns of participants in OSP’s first two lotteries. They worked with OSP’s current administrator, Serving Our Children, to reconstruct baseline files from the original lottery applications of 1,776 students who applied for a scholarship in 2004 or 2005 and are now old enough to have enrolled in college. Their resulting estimates are referred to as “intent to treat,” since they measure the effect of being offered a scholarship.

The resulting estimates, none of which were “statistically distinguishable” from zero, show that students who were offered a scholarship were somewhat less likely to enroll in college within two years of expected graduation from high school. The pattern holds for two- and four-year colleges, and for four-year public and private colleges.

Overall, the findings are encouraging. Students who participated in private school choice programs in Florida and Milwaukee were more likely to enroll in and graduate from college than their public school peers. Results from Washington, D.C., however, show few differences in college enrollment between students who won and lost the voucher lottery, though the small sample sizes make the results less precise.

Still, two things should be kept in mind. First, even with the positive impact of private school choice, low-income students in the studied areas and nationally still have discouragingly low college-completion rates. Second, while studying long-term outcomes is valuable, the results are from students who participated in these programs many years ago—and all three of these programs have changed significantly since then. This makes it exceedingly difficult to draw conclusions about what is or isn’t currently working.

SOURCE: Matthew M. Chingos, Daniel Kuehn, Tomas Monarrez, Patrick J. Wolf, John F. Witte, Brian Kisida, “The Effects of Means-Tested Private School Choice Programs on College Enrollment and Graduation,” The Urban Institute (July 2019).

view

Hidden from the headlines

7.30.2019
Flypaper

Headlines about colossal mismanagement issues in Ohio charters—the biggest being the ECOT meltdown—dominate the school choice narrative in the Buckeye State. These stories raise the question: Why are Ohio charters so bad? This query and the dominant narrative that flows from it have long provided cover for charter opponents, even as some of the negative coverage is well-deserved. But it’s the wrong question—and it distracts us from a bigger, far more compelling story.

Policymakers, the media, politicians, the general public, and anyone else who cares about the state’s children should instead be asking how, in Ohio’s inhospitable ecosystem, any charter schools are able to find success.

Buckeye charters are nonprofit, nonsectarian, public schools that can be brick-and-mortar or online, and are overseen by a board with governance, fiduciary, and academic oversight responsibilities. They are accountable to a sponsor that has been approved by the state, to the Ohio Department of Education, and to the families who send their kids there. They administer the same state tests and receive the same state report card as traditional public schools. They serve the same proportion of students with special education needs. And they can be closed for poor performance.

They also have numerous limitations that put them at a significant disadvantage compared to their traditional public school counterparts. Brick-and-mortar charters can only exist in areas where traditional districts have chronically underperformed, which means they’re mostly attended by low-income students of color. Yet they receive significantly less funding than traditional public schools receive because they’re excluded from local tax revenue.

These and other restrictions have been either enacted or maintained using the political cover of a few bad actors. And together they’ve essentially made charters into a wholly separate class of underfunded public schools. As a state, we should be ashamed, for our choices have harmed disadvantaged families the most. These moms and dads are stuck with deciding between a low-performing district school or a charter with better student outcomes but significantly fewer resources.

It’s a deeply inequitable education system and a stark miscarriage of justice. Yet, despite the story having been ripe for the telling for years, all Ohio’s heard is silence. And sadly, there doesn’t appear to be a good reason for this. Instead, the powers that be just don’t seem to get it.

Even now, as the Ohio legislature has passed Governor DeWine’s laudable proposal for additional funding for charters, my blood boils. To be sure, narrowing the funding gap for public charters is an important step. Still, how do you justify underfunding any public schools serving poor kids and kids of color? I’m all for school accountability, but we need to come to the table and discuss the systemic inequity issues first.

So how about now? Can we tell this story now? Can we start asking the right questions about Ohio charters? Can we begin developing a supportive ecosystem for these public schools so that the success stories are because of—and not in spite of—a flawed system? Who’s ready to have those conversations?

Fordham Logo

© 2026 The Thomas B. Fordham Institute
Privacy Policy
Usage Agreement

National

P.O. Box 110
Burke, VA 22009

202.223.5452

[email protected]

Ohio

P.O. Box 82291
Columbus, OH 43202

614.223.1580

[email protected]

Sponsorship

130 West Second Street, Suite 410
Dayton, Ohio 45402

937.227.3368

[email protected]