
Standards & Accountability
Bad old vo-tech ways return in Ohio’s urban districts
For years, career-technical education (CTE) was saddled with a bad reputation.
For years, career-technical education (CTE) was saddled with a bad reputation.

For years, career-technical education (CTE) was saddled with a bad reputation. The stigma was not undeserved, as it was all too often a “dumping ground”—as a Rand Corporation study once put it—for students whom schools believed could not succeed academically. Regrettably, low-income, special-education, and minority students were more likely to be placed in these weak “vo-tech” programs, leaving them with menial skills and little hope for career advancement after high school.
Understanding the harms of this approach, policymakers have worked in recent years to upgrade CTE. One way that Ohio has sought to strengthen career-tech is by encouraging students to attain industry-recognized credentials (IRCs). Earning these IRCs is supposed to bolster students’ technical skills and signal their readiness for jobs in the real world. Today, Ohio students can pursue a wide range of IRCs that include welding or plumbing certificates to professional certifications such as a state-tested nursing assistant.
But these IRCs are only good for students if they have value in the workplace. Otherwise, they’re not worth the paper they’re printed on, and worse yet, they take time and attention away from pursuing academic competencies and technical skills that will better serve students when they head to work.
On the positive side, Ohio incentivizes high-value IRCs through the Innovative Workforce Incentive Program (IWIP). This program provides schools up to $1,250 when students earn IRCs in selective career fields such as healthcare and manufacturing.
On the other hand, the state does a poorer job encouraging high-quality IRCs through its graduation requirements. As discussed in this piece, a lack of quality control appears to have allowed schools to push struggling students to the finish line through low-level IRC “pathways.” If not corrected, this will be another troubling example of low-quality CTE programs being used to shortchange students.
***
As a quick refresher on Ohio’s graduation requirements, students struggling to meet state “competency” standards—i.e., passing the Algebra I and English II exams—have a variety of alternative routes to graduation, including earning IRCs. To implement this option, the state has utilized a system in which each IRC on a wide-ranging list of roughly 600 credentials is assigned a value between one and twelve points. Students can meet the competency element for graduation if they earn at least twelve points in a particular career field.[1]
The points system correctly recognizes that not all IRCs are of equal value. But the state also allows students to “bundle” multiple IRCs to meet the twelve-point mark. A student doesn’t need to earn a single high-value, twelve-point credential to graduate. Instead, they can accumulate a bunch of IRCs (within a career field) that add up to twelve points.
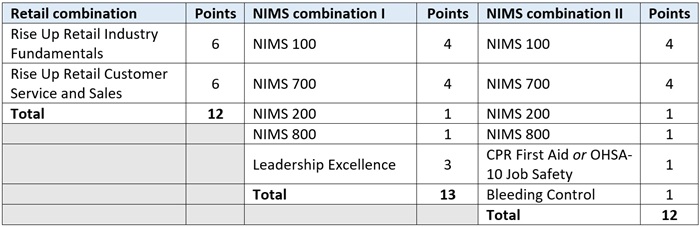
Table 1 provides examples of how this “bundling” works, using illustrations that will be relevant when we turn to actual IRC data. We see, for instance, that a student can meet graduation requirements by collecting two retail-based certificates. While retail occupations deserve our respect, it’s also an industry that pays relatively low wages, particularly for workers with weak math and reading skills who are unlikely to move into the management ranks. It’s also somewhat odd to see these certifications offered as a graduation pathway, as most retailing jobs don’t require these credentials.
The other two columns display IRC combinations based on emergency management certificates known as NIMS. Though they may sound impressive, the courses range from just two to four hours long and students could presumably rack up these certificates in a few weeks. They couldn’t rely solely on the four NIMS credentials to graduate, as they only add up to ten points. But that’s where bundling comes into play—to reach twelve points, just one or two additional IRCs are needed. One option is to complete a “leadership excellence” certificate—of which we know just about nothing—worth three points. Another is to complete two of three of the following one-point credentials: CPR First Aid, OSHA-10 hour job safety, or bleeding control certificate. These IRCs are more akin to supplements that provide some useful skills and workplace knowledge, but are not designed to be “core” technical credentials that by themselves help young people get hired or advance in the workplace. Overall, it’s extremely hard to tell how students benefit from these NIMS bundles.
Table 1: IRC combinations that equal twelve or more graduation points
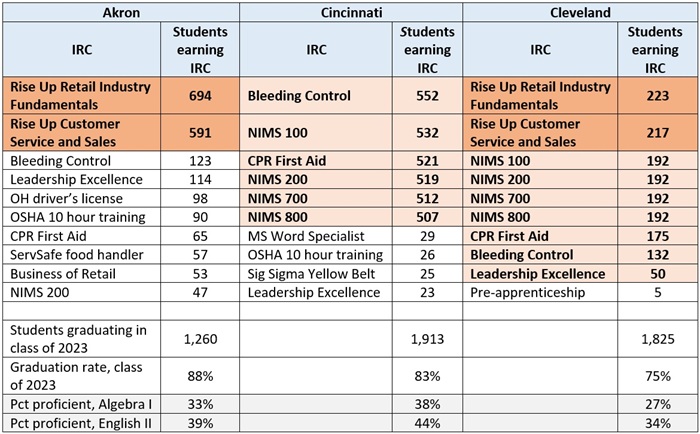
As we at Fordham have discussed previously, and show again here, Ohio’s urban school districts are using these dubious IRC-based alternative “pathways” to graduation. Consider the data below, which shows the most commonly earned IRCs in Akron, Cincinnati, Cleveland, Columbus, Toledo, and Youngstown. It’s striking to see only a few IRCs—out of the hundreds that students can earn—dominating the top of these lists. These include the two retail-based certificates and the NIMS certifications, along with the CPR First Aid, bleeding control, and OHSA job-safety certifications. The retail combination—shaded in darker orange—seems to be a widely-used route to graduation in Akron, Cleveland, and Toledo. Meanwhile, the NIMS bundle appears to be commonly used in Cincinnati, Cleveland, Columbus, and Youngstown. The tables also note the districts’ low proficiency rates in Algebra I and English II, which suggests that they were likely searching for alternative routes to graduation for off-track students.[2]
Table 2: Ten most commonly earned IRCs in urban Ohio districts, class of 2023
* * *
Serious career-and-technical education puts students on a pathway to rewarding careers after high school. To truly be a “pathway,” it should be a structured program that includes career exploration during middle school, rigorous technical coursework in students’ career field of choice, pursuit of a credential (if applicable to the profession), and work-based learning.
Unfortunately, what’s appears to be happening in Ohio’s urban districts is some kind of distorted form of CTE in which low-achieving students are getting routed into less rigorous IRC programs to get them diplomas at the last minute. This does nothing for the students who receive certificates that have nothing to do with their career aspirations and have little value in the workforce. Worse yet, subjecting struggling students to this workaround robs them of opportunities to gain real technical skills and achieve academic proficiency.
Ohio policymakers need to put a stop to this, and there are ways to do it. They could, for instance, add a stipulation that a student must earn a nine- or twelve-point IRC to meet the alternative graduation pathway. Policymakers should also remove lower-tier “supplemental” credentials (e.g., CPR First Aid or bleeding control) from the state-approved IRC list. These are nice-to-have certifications—and nothing would stop students from attaining them voluntarily—but the state would choose to not “nudge” students into collecting them for purposes of graduation. Removing these certificates would follow ExcelinEd’s recommendation that these types of “general readiness” credentials “not be considered industry-recognized credentials in the way that they currently are in state CTE programs.”
However it gets done, Ohio cannot allow CTE to become the “dumping ground” for low-achieving students again. That approach wrote off kids who were struggling and left them without a fighting chance to succeed after high school. Let’s not let the past repeat itself.
[1] Students can also earn one of the two required “readiness seals” needed to graduate by earning twelve IRC points.
[2] The state requires students to achieve test scores slightly below proficient. The proficiency data (from 2023-24) do not directly reflect the proficiency rates of the class of 2023; however, these districts have long posted low proficiency rates.

Like leaders in other states, Ohio policymakers have been working to address chronic teacher shortages. During the 2022 state budget, policymakers took a crack at bolstering the teacher pipeline by investing in Grow Your Own programs and tweaking licensure laws. In 2023, Governor DeWine unveiled a teacher apprenticeship program. And in 2024, a proposed (but not passed) bill sought to boost teacher recruitment efforts by supporting student teachers.
Despite this effort and attention, school and district leaders continue to report widespread teacher shortages. There are plenty of reasons why this issue has been difficult to address. But chief among them is that state and local leaders don’t have access to detailed and consistent data on teacher vacancies. Without this information, it’s hard to identify the regions, schools, subjects, and grade levels where shortages exist and respond accordingly.
This year’s state budget could change that. House Bill 96, which contains Governor DeWine’s budget recommendations, calls on the Department of Education and Workforce (DEW) to annually collect school district employment and vacancy data and then summarize and publish it on its website. DEW would be required to gather vacancy data not only for teachers, but also for principals, assistant principals, paraprofessionals, bus drivers, related service providers, and other providers of specialized services. As part of its reporting requirements, DEW must disaggregate the number of vacant positions by type, subject, geographic area (including rural and urban areas), positions that remain unfilled, and the methods used to fill vacant positions, including the hiring of substitutes, retirees, or alternative licensure program candidates and contracting with an educational service center or other entity.
Improved data collection would go a long way toward helping Ohio address teacher shortages. These provisions are a good first step. But as HB 96 makes its way through the General Assembly, there are a few tweaks that lawmakers should consider to ensure that state and local leaders are well-equipped to effectively tackle teacher shortages. Let’s examine three.
1. Ensure DEW collects data from all public schools.
In its current form, the bill calls for DEW to collect vacancy data from school districts. And the vast majority of Ohio students—nearly 1.5 million—attend district schools. But districts aren’t the only public schools in the state. Tens of thousands of students attend Ohio’s other public school options, including charter schools (over 117,000 students), JVSDs (more than 49,000 students), and STEM schools (just under 4,000 students). It’s important for state leaders to gather data from all of Ohio’s public schools to ensure that every student has access to a permanent and effective teacher rather than a carousel of substitutes.
2. Require DEW to disaggregate data at the district and school level.
While analyzing teacher vacancy data from Tennessee, Brown University’s Annenberg Institute for School Reform found that staffing issues are “highly localized.” That means it’s possible for teacher shortages and surpluses to exist simultaneously, and explains why some districts and schools are struggling to staff classrooms while others aren’t. Disaggregating vacancy data by geographic area, as the budget calls for, should help state and local leaders better understand shortages.
But Ohio is a big state. And although HB 96’s requirement to report data at the regional level is helpful, it won’t provide the detail necessary to pinpoint shortages. For example, if rural districts in the northwest corner of Ohio are struggling to hire math teachers, but the rest of Ohio’s rural districts are most in need of science teachers, then the data will likely point to science as the most significant shortage for rural areas. State leaders might respond by establishing grant programs or recruitment initiatives for rural science teachers. And those efforts would surely help districts in desperate need of science staff. But they would do nothing to solve the math teacher shortage in rural northwestern districts, which would get lost in the shuffle of a larger regional effort.
District-level data would ensure that every district, regardless of size or location, is on the teacher shortage radar when it needs to be. It would also empower locally elected leaders, community-based advocacy organizations, and local philanthropy to step in and help. Disaggregating down to the school level is important for similar reasons. In big districts like Columbus and Cleveland, shortages could be concentrated in specific schools or neighborhoods rather than across the entire district. Pinpointing exactly where shortages exist is the only way to effectively address them.
3. Include data on teacher supply in the department’s annually published summary.
Tracking vacancies is the best way to understand teacher demand. But to grasp the full size and scope of teacher shortages—and to craft effective policy solutions that will address them—state and local leaders need data on teacher supply, too. Federal numbers can be helpful for understanding long-term trends, but these data are published on a delay and aren’t detailed enough to account for local context. That’s why lawmakers should require DEW to include data on teacher supply when it publishes district demand and vacancy data. The department should also include an analysis of whether Ohio’s current and projected supply are enough to meet current and future demand. Supply data should include the current number of students enrolled in Ohio’s teacher preparation programs (TPPs), both traditional and alternative, disaggregated by individual program; the most recent number of graduates from TPPs, again disaggregated by program; the current number of teachers with active licenses, disaggregated by license and endorsement area; and the number of teacher candidates who passed licensure exams during the most recent academic year, disaggregated by exam.
***
For the next few months, Ohio policymakers will be firmly entrenched in budget debates. And while collecting teacher vacancy data isn’t as sexy of a topic as funding or private school scholarships, it is crucial. It will be close to impossible for state and local leaders to effectively address teacher shortages without better data. DeWine’s budget proposal takes a good first step. But with just a few small tweaks, these provisions could ensure Ohio is well-equipped to finally tackle its teacher shortage problem.

Last week, the U.S. Department of Education released data from the 2024 round of the National Assessment of Educational Progress (NAEP). “The news,” as one federal official put it, “is not good.” Grim indeed, as reading scores nationally continued a decade-long slide. Math results ticked up, but that’s compared to the rock-bottom scores registered just after the pandemic. Despite the billions spent by the federal government for academic recovery, math and reading achievement nationwide are still significantly below pre-pandemic levels.
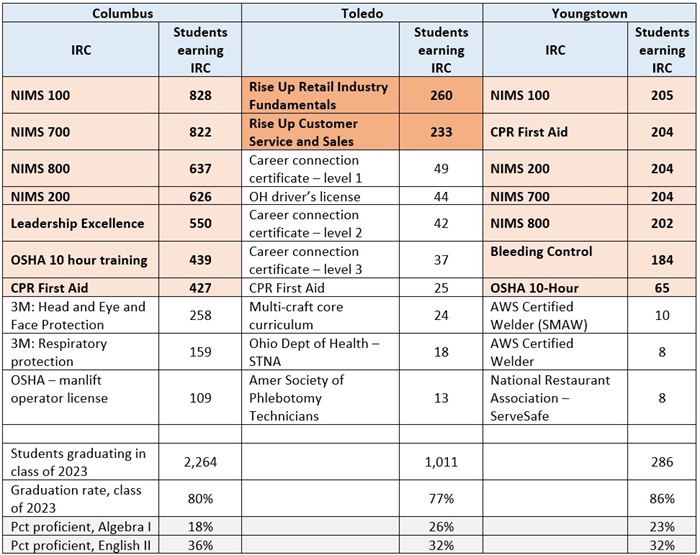
If this weren’t troubling enough, NAEP also reveals an alarming deterioration in the math and reading skills among the nation’s lowest-performing students. Consider the chart below. The top two lines show the scores of high-achieving students—those scoring at the 90th and 75th percentiles on NAEP. While their scores dipped during the pandemic, they have started to recover since then. However, scores of low-achieving students—at the 25th and 10th percentiles—not only fell during the pandemic but continued to decline in 2024. Looking more closely at the figure, we actually see that low-achieving students’ scores have steadily declined since 2013. This has occurred after a decade-plus of solid progress during the 1990s and early 2000s. (Chad Aldeman has a piece showing this trend more plainly.)
Figure 1: National scores on NAEP by achievement percentile, eighth grade math
The results have been widely covered in national publications, and have set off alarm bells among national policy wonks. But is Ohio suffering from the same ailment as the rest of the nation? The answer—unfortunately—is yes. In terms of overall student performance, Ohio’s results tracked closely with the dismal national patterns. And as the following charts show, the achievement of Ohio’s lowest-performing students has also worsened over the past decade.
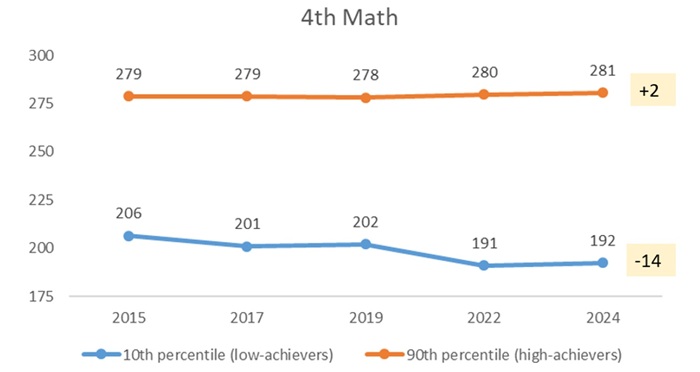
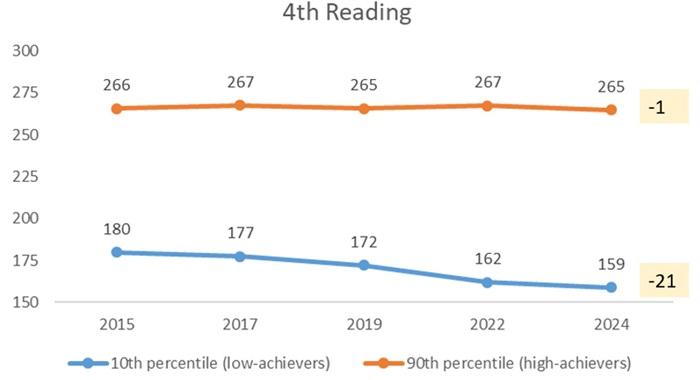
Starting in fourth grade, we see that the scores of Ohio’s highest-achieving students remained remarkably steady from 2015 to 2024. However, students at the bottom 10 percent in math suffered a fourteen-point loss during this period. To put that decline into some context, analysts view a ten-point change as roughly equivalent to a grade level. An even more startling trend emerges in reading, with low-achieving students’ scores plummeting twenty-one points over the past decade. This again stands in stark contrast to the one-point loss for high-achievers.
Figure 2: Ohio scores on NAEP by achievement percentile, fourth grade math and reading
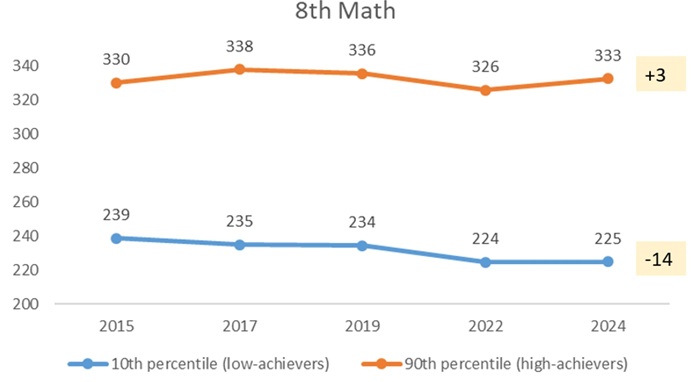
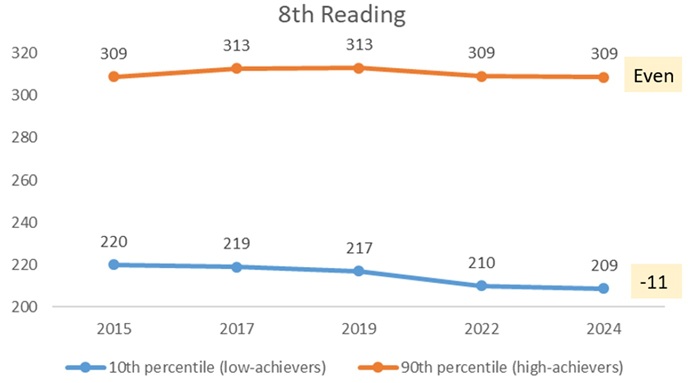
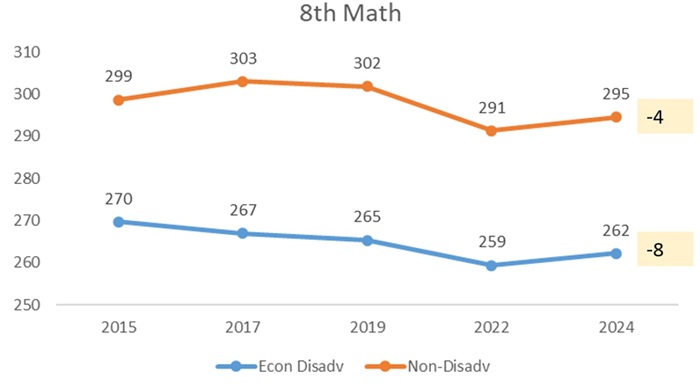
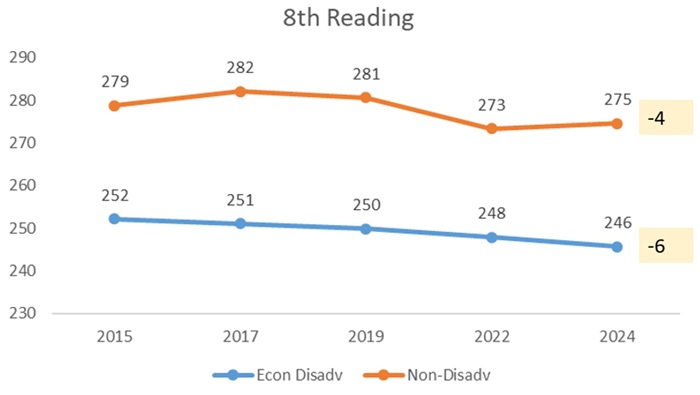
A similar story emerges in eighth grade. The scores of Ohio’s lowest-performing students declined fourteen and eleven points in math and reading, respectively, even as their high-achieving counterparts’ scores have held steady.
Figure 3: Ohio scores on NAEP by achievement percentile, eighth grade math and reading
We don’t know which students exactly are represented in the bottom 10 percent in achievement. But given persistent achievement gaps based on socio-economic status, it’s likely that low-income students are overrepresented (though there are surely non-disadvantaged students in that decile). What do the trends look like for Ohio’s economically disadvantaged students? Figures 4 and 5 indicate that they have lost slightly more ground than their non-disadvantaged peers on all four NAEP exams from 2015 to 2024. In fourth grade reading, for instance, economically disadvantaged students lost nine points while their non-disadvantaged peers lost seven. To be sure, the declines for low-income students are not nearly as severe as for the lowest-performing students, likely reflecting the fact that economically disadvantaged students are represented across the entire achievement spectrum. Nevertheless, Ohio’s achievement gaps based on low-income status have somewhat widened over the past decade.
Figure 4: Ohio scores on NAEP by economically disadvantaged status, fourth grade math and reading
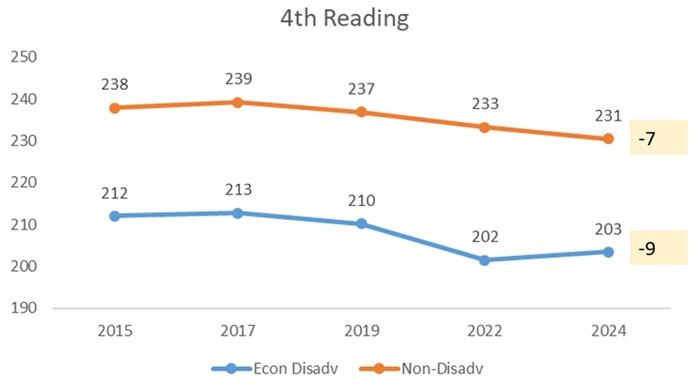
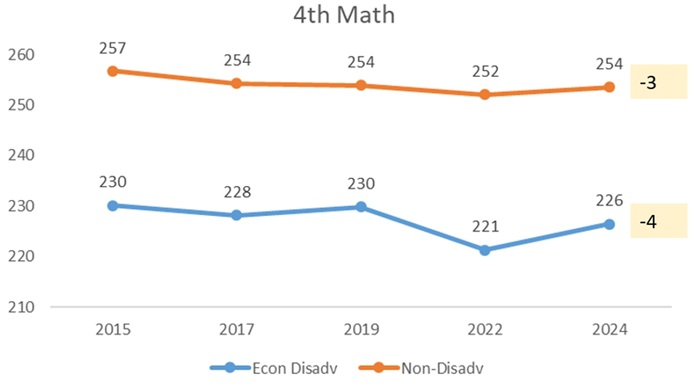
Figure 5: Ohio scores on NAEP by economically disadvantaged status, eighth grade math and reading
* * *
What is clear from these data is that struggling students today aren’t faring as well as in the past, and that unacceptably wide achievement gaps are growing. What’s less clear is why exactly this is happening. Increasing screen time, a shift in focus away from academics, the disproportionate impacts of the pandemic, soaring absenteeism, and softening accountability are all likely culprits. Whatever the case may be, the direction that state leaders go from here will impact the lives of thousands of Ohio students. Will they stick their heads in the sand and pretend like these academic troubles don’t exist? Or will they answer the call—as policymakers elsewhere have done—and turn the tide on the sinking achievement of Ohio’s most at-risk students?

In 2012, Governor John Kasich signed legislation enabling the Cleveland Metropolitan School District (CMSD) to implement a city-wide school turnaround plan. The initiative, known as the Cleveland Plan, was developed by city and community leaders with the primary goal of improving student achievement. To support implementation, the plan established the nonprofit Cleveland Transformation Alliance (CTA).
For more than a decade, CTA has published annual progress reports and managed informational sites for parents. So when the organization recently announced its plans to dissolve, it marked the end of an era. The Cleveland Plan itself is still in effect—the mayor remains in charge of the city’s schools, and plans to meet with education leaders twice a year to check on the district’s progress. But things will look a little different in The Land moving forward. And that makes this a great time to examine whether the district has made progress.
Enter the National Assessment of Educational Progress (NAEP), commonly referred to as the “Nation’s Report Card.” Every two years, NAEP exams are administered to a sample of fourth and eighth grade students in every state in both math and reading.[1] These results allow for apples-to-apples comparisons between states. NAEP’s Trial Urban District Assessment (TUDA) makes it possible to add selected urban districts to such comparisons. Twenty-six urban districts participated in 2024. Cleveland has been one of them since 2003, which means there’s a plethora of data showing how CMSD stacks up to Ohio’s statewide averages and other urban locales around the country.
In late January—just two days after CTA announced that it would dissolve—the U.S. Department of Education published results from the 2024 administration of NAEP. Ohio’s overall results are a disappointment. But they aren’t nearly as bad as the results coming out of Cleveland. Just how bad is it? Let’s take a look.
1. Fourth grade reading
On the 2024 NAEP exam, fourth grade students in Cleveland earned an average reading score of 184, significantly lower than the average score for students across the nation (214), in Ohio (216), and in other large cities (208). Twenty-two TUDA jurisdictions registered significantly higher scores than Cleveland, including San Diego (forty points higher), Miami-Dade (thirty-five points higher), and the District of Columbia (thirty-two points higher). In fact, among TUDA districts, Cleveland’s average score in fourth grade reading was in the bottom three. Only two cities—Milwaukee and Detroit—performed worse. Proficiency rates were similarly abysmal, with just 8 percent of Cleveland students scoring at or above proficient. Only Detroit was worse at 5 percent.
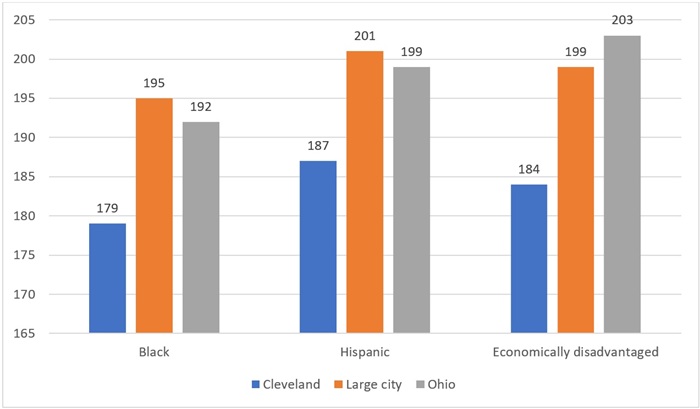
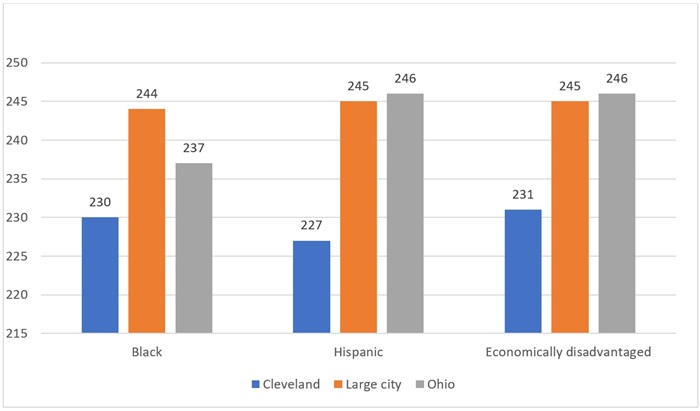
It’s not just the district’s overall performance that’s shockingly low. Black and Hispanic students, as well as those who are economically disadvantaged, are scoring much lower than their peers outside the district. In fact, these groups scored at least fourteen points lower than similar students in other large cities. The score difference between economically disadvantaged students in Cleveland versus similar students across Ohio is a whopping nineteen points.
Chart 1. 2024 average NAEP scores for selected student groups, fourth grade reading
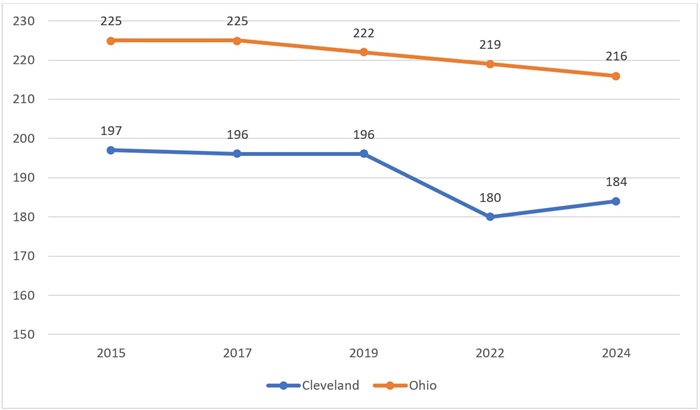
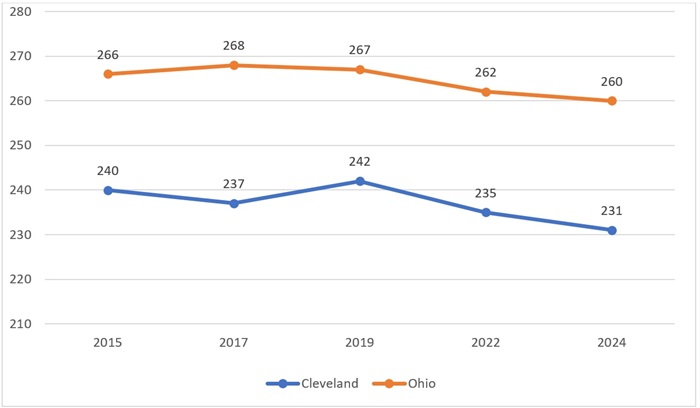
There is some good news—the district posted a four-point gain compared to 2022, which contrasts with Ohio’s statewide average loss of three points. But a significant gap (thirty-two points) remains between Cleveland students and the state average. And the district still has a long way to go to bounce back to its own pre-pandemic averages, which had been mostly flat for three consecutive years.
Chart 2. NAEP scores over time, fourth grade reading
2. Fourth grade math
In fourth grade math, Cleveland performed worse than the rest of the nation (206 versus 237), students in Ohio (239), and those in large cities (231). The majority of TUDA districts performed significantly better than Cleveland, including Charlotte (thirty-four points better), Dallas (twenty-seven points better), and Boston (twenty-six points better). Cleveland’s average score was once again low enough to land it in the bottom three, with only Milwaukee (205) and Detroit (200) faring worse. In terms of achievement levels, only 9 percent of Cleveland students scored at or above proficient.
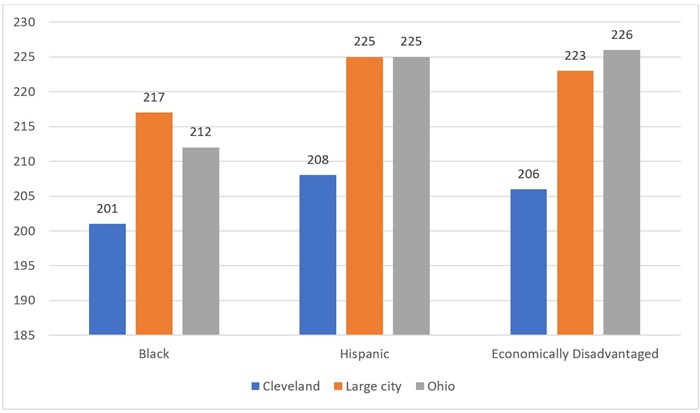
The demographic breakdown of average scores is equally troubling. In Cleveland, Black, Hispanic, and low-income students scored at least sixteen points lower than similar students in other large cities. Moreover, the district’s low-income students scored a whopping twenty points lower than similar students in Ohio.
Chart 3. 2024 average NAEP scores for selected student groups, fourth grade math
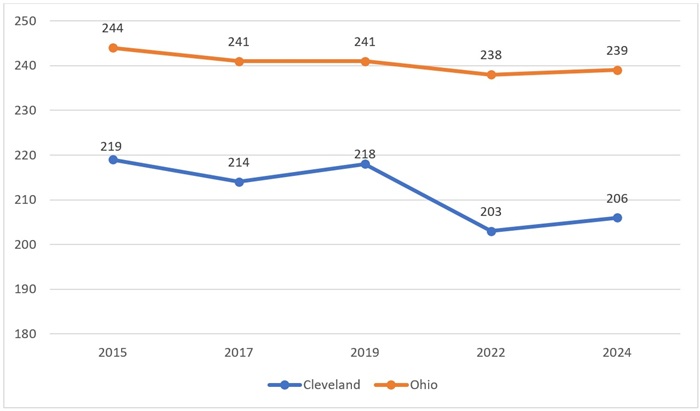
As was the case for fourth grade reading, the short-term trend for fourth grade math offers some hope. Between 2022 and 2024, Cleveland’s score rose by three points, whereas Ohio’s increased by only one. But there’s still a long road ahead. The district will need to improve by twelve points to bounce back to its pre-pandemic levels, and thirty-three to match the state’s 2024 average. If Cleveland continues to improve by only three points every year, catching up will take decades.
Chart 4. Cleveland NAEP scores over time, fourth grade math
3. Eighth grade reading
Cleveland eighth graders earned an average score of 231 on the 2024 NAEP reading exam. Like the fourth grade reading results, Cleveland’s average score is lower than that of students across the nation (257), in Ohio (260), and in large cities (252). A whopping twenty-four TUDA jurisdictions performed significantly better, including Denver (twenty-six points higher), Chicago, and New York City (both were twenty-three points better). Once again, Cleveland was prevented from being the worst-performing district by Detroit, though only by two points. A mere eight percent of Cleveland eighth graders scored at or above proficient. And minority and low-income students again scored well below their peers in other large cities and Ohio. Gaps range between seven to nineteen points.
Chart 5. 2024 average NAEP scores for selected student groups, eighth grade reading
Unfortunately, unlike the fourth grade results, Cleveland’s eighth grade reading scores fail to offer a glimmer of light at the end of the tunnel. Prior to the pandemic, the district registered a promising five-point jump in 2019. As a result, the 2022 pandemic-era decrease didn’t seem all that bad—yes, it was a seven-point drop, but it was only two points lower than the district’s 2017 average. If 2024 scores increased even incrementally, that would be good news. But that’s not what happened. Rather than bouncing back, Cleveland’s average score dropped even further, down from 235 in 2022 to 231 in 2024. That’s the lowest it’s been in the last decade. Ohio’s statewide average also decreased, so at least Cleveland isn’t alone in the bad news bin. But the state’s drop was just two points. Cleveland’s was four.
Chart 6. Cleveland NAEP scores over time, eighth grade reading
4. Eighth grade math
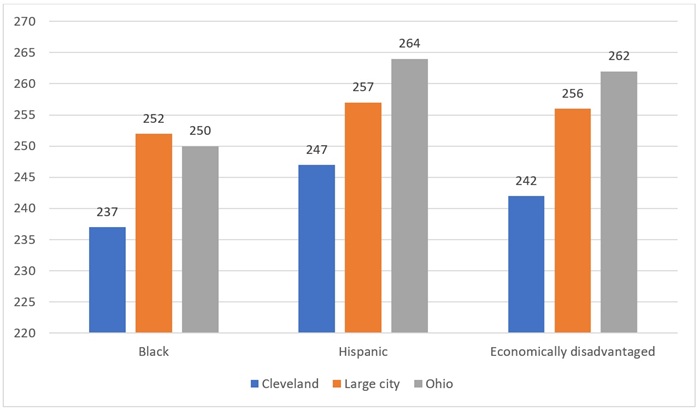
In keeping with the pattern established by the other three exams, Cleveland’s 2024 average eighth grade math score (242) was lower than the average for students across the nation (272), in Ohio (279), and in large cities (266). Most urban districts performed significantly better, including Houston (twenty-three points better), Los Angeles (eighteen points better), and Atlanta (fifteen points better). Only Detroit (237) had a lower average score than Cleveland. Meanwhile, the district’s achievement level results were worse than any other subject. Just six percent of students scored at or above proficient. And sizable gaps exist between the district’s Black, Hispanic, and low-income students and their peers outside the city. Economically disadvantaged students in Cleveland, for example, posted an average score of 242. Ohio’s statewide average for similar students was twenty points higher at 262.
Chart 7. 2024 average NAEP scores for selected student groups, eighth grade math
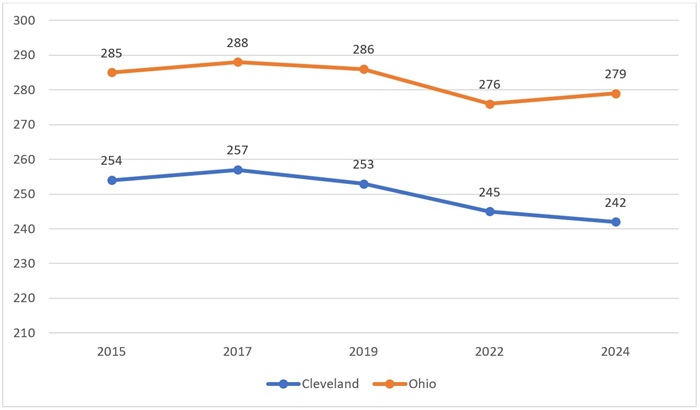
Those are abysmal results. But they’re particularly bad given that Cleveland’s eighth grade math scores have been trending downward over time. As chart 4 shows, achievement was slumping prior to the pandemic, with a four point drop between 2017 and 2019. Ohio’s statewide average mirrored that slump, though it wasn’t quite as steep. But then in 2024, the state’s average jumped three points. It’s the first time since 2017 that Ohio’s statewide average in eighth grade math has gone up. Cleveland, on the other hand, dropped another three points. 2024 marks the third consecutive year of eighth grade math declines for the district.
Chart 8. Cleveland NAEP scores over time, eighth grade math
***
There are several measures that advocates and families can use to gauge progress in Cleveland. In September, district officials were quick to point out that CMSD had earned an overall rating of three stars on its 2024 state report card. It was the first time in history the district had done so, which seemed like cause for celebration. But a closer look revealed that good ratings on the progress (four stars) and gap closing (three stars) measures were covering up one-star ratings in graduation (the district’s weighted graduation rate was just 77 percent) and early literacy (it moved less than one fourth of its off-track K–3 students to on-track). Fewer than one-third of students scored proficient or above on state exams in all subjects in grades 3–8 and on end-of-course exams. And more than half the student body was deemed chronically absent.
District officials might be able to paper over poor results on state report card measures by emphasizing their three-star overall rating. But there’s no way to paper over 2024 NAEP results. Cleveland is falling short compared to NAEP achievement standards—on each of the four exams, fewer than 10 percent of students earned a score of proficient or above. But it’s also falling short compared to everyone else—Cleveland students are performing far worse than students across the nation, in Ohio, and in the majority of urban districts. With the dissolution of CTA, Ohio’s third largest school district is now entering a new era. Here’s hoping that this one produces some better results for kids.
[1] The 2021 administration of NAEP was postponed due to the pandemic. NAEP also administers exams in science, writing, and several other subjects.

While many fret over the proliferation of artificial intelligence (AI), the jury is still out regarding its benefits and drawbacks for K–12 education, and researchers are trying to catch up to the rapidly-expanding technology. The latest of two recent articles on the topic from the World Bank examines one education-related AI project in Africa.
In June and July 2024, 800 first-year students in senior secondary school in Nigeria (ages 16-17) were randomly assigned to attend after-school English classes in computer labs twice a week. Each session began with the teacher introducing the new weekly topic, followed by students interacting with the well-known Copilot generative AI tool from Microsoft, powered by ChatGPT. Teachers guided and mentored students throughout each session, which dealt with both grammar and writing tasks in English. Teachers also led brief reflection exercises at the end of each session. Importantly, a control group of students from the same schools who were not selected for the AI-powered sessions were also followed, although the articles discussing the intervention are light on details. (A proper report is promised soon, but until then, a video gives further detail on what the project looked like in practice.) After the six-week session, all students took a pen-and-paper test to assess their performance in three areas: English language skills, AI knowledge, and digital skills.
Students who participated in the AI-assisted classes performed better on their final tests to the tune of a statistically-significant 0.3 standard deviations. This is equivalent to nearly two years of typical learning in just six weeks. Compared to a database of other RCT education interventions conducted in the developing world, analysts say the AI intervention outperformed 80 percent of them. These include some widespread strategies like structured pedagogy and teaching at the right level. However, we don’t yet have a breakdown of how students did on the three individual parts of the test so it will be important to see the difference between English skills and the technological topics. Benefits accrued to all participating students, not just the highest achievers. And female students—whose success is an ongoing concern in African education—gained more compared to males. Attendance mattered greatly to the impacts, with every additional day of attendance resulting in statistically-significant improvements in learning outcomes. This is important, as attendance was inconsistent for many students due to factors beyond their control (family, weather, etc.). Making such classes fully virtual would reduce this concern, but home/community internet access would likely need to be addressed.
An earlier article published in September briefly describes seven takeaways from the same AI pilot project. On the upside, both students and teachers were highly engaged and reported wishing they had had even more time with the technology. (The introductory sessions were necessarily spent on housekeeping and training on the basics.) Teachers also reported a greater ability to immerse students in the English language using AI rather than other online (or written) resources. On the downside, teachers reported instances of hallucination (AI tools generating false responses and presenting them as facts) and student misuse of the technology, as well as the aforementioned attendance problems.
There’s a whole lot more we need to know about this experiment and others like it before any conclusions can be made beyond “this seems promising.” What kind of instruction did control group students get? How much human intervention is required to minimize AI problems and maximize student benefits? What kind of costs are required to reach the highest number of students? Are there other options besides Copilot that could work better? Until then, we remain at the “experts think” phase of technological innovation, sprinkled with a soupçon of “cautious optimism.”
SOURCE: Martín E. De Simone et al., “From chalkboards to chatbots in Nigeria: 7 lessons to pioneer generative AI for education,” World Bank blogs (September 2024).
SOURCE: Martín E. De Simone et al., “From chalkboards to chatbots in Nigeria: Transforming learning in Nigeria, one prompt at a time,” World Bank blogs (January 2025).

While some aspects of the putative teacher shortage in America are matters of perspective, the dearth of teachers to staff special-education classrooms is real and growing. Could a cash bonus be enough to nudge potential recruits into these jobs? Many policymakers and pundits think so. A new report looks at the surprising outcome of one such effort.
In 2019, looking to fill persistent vacancies, education leaders in Hawaii instituted a plan to boost the annual salaries of special-ed teachers statewide in two ways: a flat $10,000 bonus for doing the job, and additional bonuses for working in the hardest-to-staff schools. Schools were placed into four tiers based on geographic isolation, student need levels, and previous staffing difficulties. Teachers working in Tier 1 schools received an additional $3,000; Tier 2 teachers received $5,000; Tier 3 teachers earned $7,500; and Tier 4 teachers, who worked in the hardest-to-serve schools, were given $8,000. These annual incentives, up to $18,000 over and above the regular salary (averaging about $68,000 at the time), went into effect with the 2020–21 school year.
A group of researchers, led by Roddy Theobald of the American Institutes for Research, examines how hiring for these positions changed in relation to general teacher hiring and across various school tiers before and after the incentives were implemented, as well as which specific mechanisms were driving these effects. And because the comparisons are between teachers in the same schools at the same time, the impacts of the coronavirus pandemic on hiring do not hinder the analysis. Data come from Hawaii Department of Education records and include all teaching positions at traditional districts between 2014 and 2023, excluding those in community schools for adults. The sample includes 115,000 teacher positions across nine school years in seven regions, fifteen complex areas (high schools and their K–8 feeders), and 261 school buildings.
Using a difference-in-differences model, Theobald and his team estimate that the bonus plan reduced the proportion of vacant special-ed teaching positions, relative to general education positions, by 32 percent and the proportion of special education positions that were vacant or filled by an unlicensed teacher by 35 percent. While it is a statistically-significant improvement, those percentages translate to a 1.2 percentage point reduction in overall special-ed vacancies and a 4.0 percentage point reduction in special-ed positions that were vacant or filled by an unlicensed teacher. Helpful, but not a solution to the problem. The largest impacts were seen in the hardest-to-staff schools, including reductions of 15 to 20 percentage points in the proportion of special education positions that were vacant or filled by unlicensed teachers in Tier 4 schools. While these findings do indicate that the additional bonuses were effective incentives for hiring at the higher-tier schools, it is also true that these schools had the most difficult time finding teachers prior to the bonus plan implementation (a.k.a. a greater “scope for change”).
Also notable is that the mechanism at work in driving the increase in special-education teachers was neither a boost in new teachers nor increased retention of existing teachers. It was the fact that general education teachers moved over to special education teaching positions to take advantage of the bonus, usually within the school where they already worked!
The researchers tout these findings as a “hidden in plain sight” solution to blunt Hawaii’s special education teacher shortage, although it is unclear from the discussion whether these switchers were already licensed to teach special education and weren’t doing so or took the opportunity of the impending bonus plan to get licensed in order to take advantage of the bonus. Either way, until big bonuses were on the table, it was more likely that special-ed classes would be overseen by unlicensed subs or other non-teaching staffers than by a gen ed teacher who chose to make the switch. In this light, the effectiveness of a $10,000 to $18,000 per year incentive to make that switch cannot be ignored, even if it didn’t really solve the problem. (You can check out another analysis of this report, including discussion of important limits to the generalizability of these findings, on a recent edition of the Education Gadfly Show.)
In the end, two big questions remain: Will the switchers stay in their special education roles long term, or will the lure of the bonuses prove insufficient to keep them in a more demanding job they had previously opted against taking? Surely it is just as easy for them to switch back to gen-ed at will…especially if vacancies remain (or grow) there. The other question is whether the bonuses will continue. They are currently approved through the 2024–25 school year, but must be re-authorized every year. Even the possibility of a pause or the threat of a reduction in payment could undo all of the impacts observed in an instant.
SOURCE: Roddy Theobald et al., “The Impact of a $10,000 Bonus on Special Education Teacher Shortages in Hawai‘i,” Educational Evaluation and Policy Analysis (January 2025).

NOTE: On February 11, 2025, the Ohio Senate Education Committee heard testimony on Senate Bill 19. It proposes increasing academic intervention services at public schools regarding student mathematics achievement and the establishment of improvement and intervention plans. Fordham’s vice president for Ohio policy provided proponent testimony on the bill. These are his full written remarks.
My name is Chad Aldis, and I am the Vice President for Ohio Policy at the Thomas B. Fordham Institute. The Fordham Institute is an education-focused nonprofit that conducts research, analysis, and policy advocacy, with offices in Columbus, Dayton, and Washington, D.C.
I am here today to testify in strong support of Senate Bill 19. This bill takes a crucial step toward ensuring that Ohio’s students—particularly those who are struggling the most—receive the support they need to succeed in mathematics and English language arts (ELA). It acknowledges the hard truth that far too many Ohio students are not on track for success. However, while SB 19 is a strong piece of legislation, we urge the committee to go even further, particularly in addressing the state’s alarming numeracy crisis.
Ohio’s Math Crisis and the Urgent Need for Action
The data tell a troubling story. The latest National Assessment of Educational Progress (NAEP) results reveal that Ohio’s lowest-performing students continue to fall further behind their peers in mathematics.[1] Since 2015, students at the 10th percentile in math have seen their scores drop precipitously—equivalent to losing more than a full grade level of learning. Meanwhile, their higher-achieving classmates have remained relatively stable, exacerbating achievement gaps that will have lifelong consequences.

This is a crisis as students who fail to develop foundational numeracy skills are at a severe disadvantage in the workforce and everyday life. Whether pursuing careers in STEM fields, the skilled trades, or any other sector, strong math skills are a prerequisite for success.
The Strengths of Senate Bill 19
Senate Bill 19 rightly focuses on providing evidence-based academic interventions to students who score at the lowest level on state assessments. Some of the bill’s key strengths include:
Where the Bill Should Go Further
While SB 19 is a strong step in the right direction, Ohio should take additional steps to ensure comprehensive math (and reading) improvement statewide. Specifically:
Conclusion
The data is clear: Ohio’s struggling students are falling further behind, and unless bold action is taken, these learning gaps will persist long into adulthood. Senate Bill 19 is a commendable effort to address this issue, but the legislature should go even further in strengthening literacy and numeracy interventions to ensure that all students have the opportunity to succeed.
We urge you to not only pass Senate Bill 19 but also to consider incorporating the additional reforms outlined above. The future of Ohio’s students—and our state’s economy—depends on it.
Thank you again for the opportunity to testify. I am happy to answer any questions that you may have.
[1] Ohio’s reading results in NAEP are also troubling, but the state is currently engaged in implementing the comprehensive literacy reforms enacted in HB 33.