In 2012, Governor John Kasich signed legislation enabling the Cleveland Metropolitan School District (CMSD) to implement a city-wide school turnaround plan. The initiative, known as the Cleveland Plan, was developed by city and community leaders with the primary goal of improving student achievement. To support implementation, the plan established the nonprofit Cleveland Transformation Alliance (CTA).
For more than a decade, CTA has published annual progress reports and managed informational sites for parents. So when the organization recently announced its plans to dissolve, it marked the end of an era. The Cleveland Plan itself is still in effect—the mayor remains in charge of the city’s schools, and plans to meet with education leaders twice a year to check on the district’s progress. But things will look a little different in The Land moving forward. And that makes this a great time to examine whether the district has made progress.
Enter the National Assessment of Educational Progress (NAEP), commonly referred to as the “Nation’s Report Card.” Every two years, NAEP exams are administered to a sample of fourth and eighth grade students in every state in both math and reading.[1] These results allow for apples-to-apples comparisons between states. NAEP’s Trial Urban District Assessment (TUDA) makes it possible to add selected urban districts to such comparisons. Twenty-six urban districts participated in 2024. Cleveland has been one of them since 2003, which means there’s a plethora of data showing how CMSD stacks up to Ohio’s statewide averages and other urban locales around the country.
In late January—just two days after CTA announced that it would dissolve—the U.S. Department of Education published results from the 2024 administration of NAEP. Ohio’s overall results are a disappointment. But they aren’t nearly as bad as the results coming out of Cleveland. Just how bad is it? Let’s take a look.
1. Fourth grade reading
On the 2024 NAEP exam, fourth grade students in Cleveland earned an average reading score of 184, significantly lower than the average score for students across the nation (214), in Ohio (216), and in other large cities (208). Twenty-two TUDA jurisdictions registered significantly higher scores than Cleveland, including San Diego (forty points higher), Miami-Dade (thirty-five points higher), and the District of Columbia (thirty-two points higher). In fact, among TUDA districts, Cleveland’s average score in fourth grade reading was in the bottom three. Only two cities—Milwaukee and Detroit—performed worse. Proficiency rates were similarly abysmal, with just 8 percent of Cleveland students scoring at or above proficient. Only Detroit was worse at 5 percent.
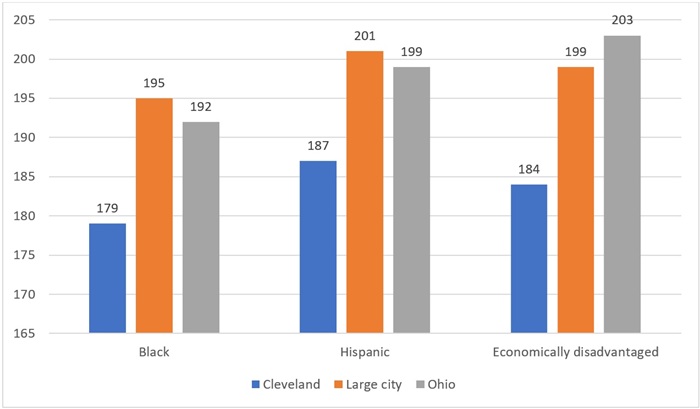
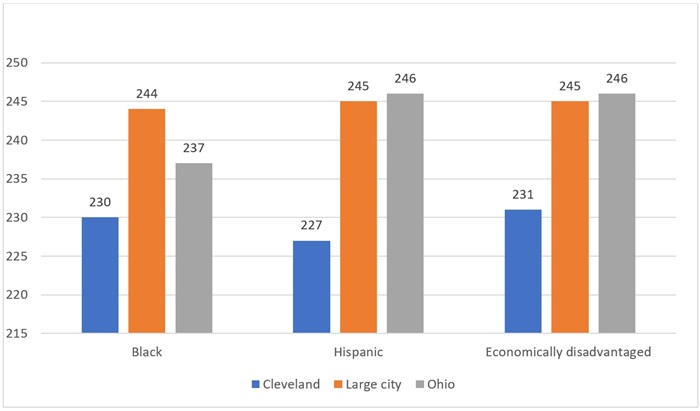
It’s not just the district’s overall performance that’s shockingly low. Black and Hispanic students, as well as those who are economically disadvantaged, are scoring much lower than their peers outside the district. In fact, these groups scored at least fourteen points lower than similar students in other large cities. The score difference between economically disadvantaged students in Cleveland versus similar students across Ohio is a whopping nineteen points.
Chart 1. 2024 average NAEP scores for selected student groups, fourth grade reading
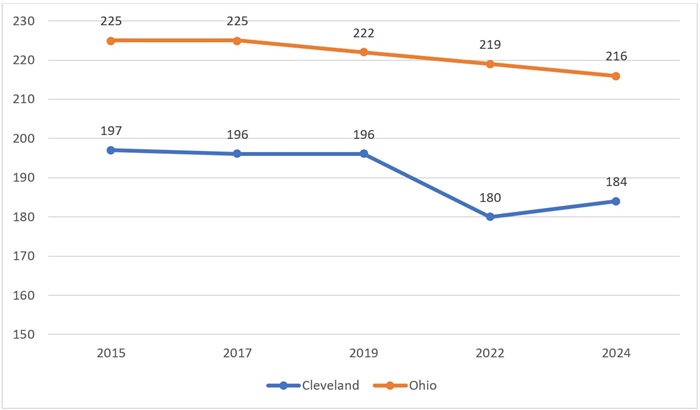
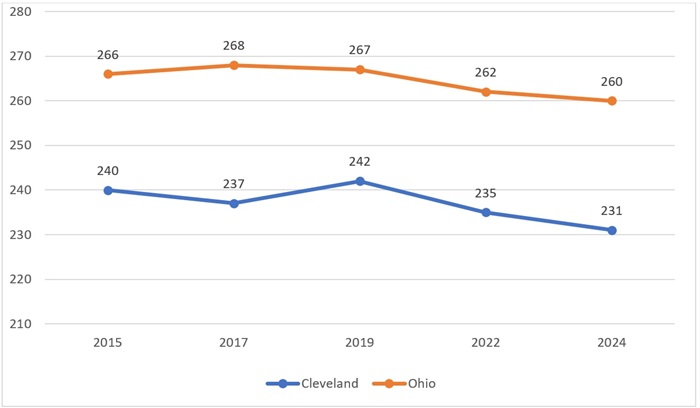
There is some good news—the district posted a four-point gain compared to 2022, which contrasts with Ohio’s statewide average loss of three points. But a significant gap (thirty-two points) remains between Cleveland students and the state average. And the district still has a long way to go to bounce back to its own pre-pandemic averages, which had been mostly flat for three consecutive years.
Chart 2. NAEP scores over time, fourth grade reading
2. Fourth grade math
In fourth grade math, Cleveland performed worse than the rest of the nation (206 versus 237), students in Ohio (239), and those in large cities (231). The majority of TUDA districts performed significantly better than Cleveland, including Charlotte (thirty-four points better), Dallas (twenty-seven points better), and Boston (twenty-six points better). Cleveland’s average score was once again low enough to land it in the bottom three, with only Milwaukee (205) and Detroit (200) faring worse. In terms of achievement levels, only 9 percent of Cleveland students scored at or above proficient.
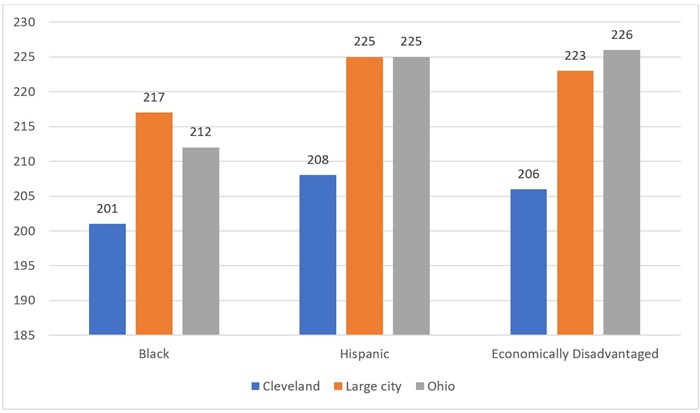
The demographic breakdown of average scores is equally troubling. In Cleveland, Black, Hispanic, and low-income students scored at least sixteen points lower than similar students in other large cities. Moreover, the district’s low-income students scored a whopping twenty points lower than similar students in Ohio.
Chart 3. 2024 average NAEP scores for selected student groups, fourth grade math
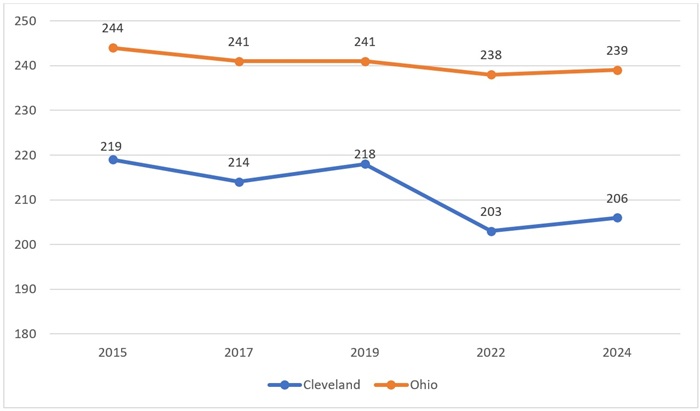
As was the case for fourth grade reading, the short-term trend for fourth grade math offers some hope. Between 2022 and 2024, Cleveland’s score rose by three points, whereas Ohio’s increased by only one. But there’s still a long road ahead. The district will need to improve by twelve points to bounce back to its pre-pandemic levels, and thirty-three to match the state’s 2024 average. If Cleveland continues to improve by only three points every year, catching up will take decades.
Chart 4. Cleveland NAEP scores over time, fourth grade math
3. Eighth grade reading
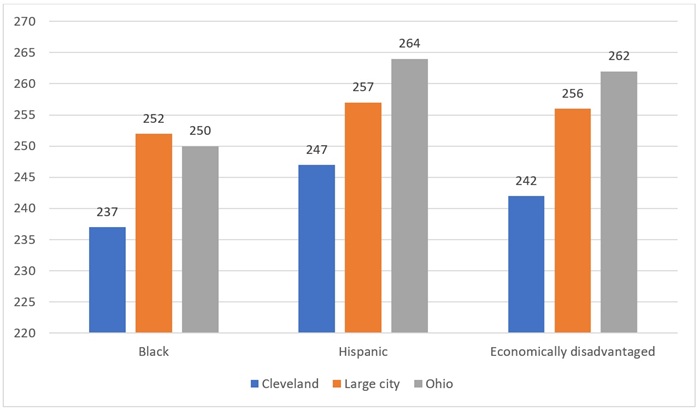
Cleveland eighth graders earned an average score of 231 on the 2024 NAEP reading exam. Like the fourth grade reading results, Cleveland’s average score is lower than that of students across the nation (257), in Ohio (260), and in large cities (252). A whopping twenty-four TUDA jurisdictions performed significantly better, including Denver (twenty-six points higher), Chicago, and New York City (both were twenty-three points better). Once again, Cleveland was prevented from being the worst-performing district by Detroit, though only by two points. A mere eight percent of Cleveland eighth graders scored at or above proficient. And minority and low-income students again scored well below their peers in other large cities and Ohio. Gaps range between seven to nineteen points.
Chart 5. 2024 average NAEP scores for selected student groups, eighth grade reading
Unfortunately, unlike the fourth grade results, Cleveland’s eighth grade reading scores fail to offer a glimmer of light at the end of the tunnel. Prior to the pandemic, the district registered a promising five-point jump in 2019. As a result, the 2022 pandemic-era decrease didn’t seem all that bad—yes, it was a seven-point drop, but it was only two points lower than the district’s 2017 average. If 2024 scores increased even incrementally, that would be good news. But that’s not what happened. Rather than bouncing back, Cleveland’s average score dropped even further, down from 235 in 2022 to 231 in 2024. That’s the lowest it’s been in the last decade. Ohio’s statewide average also decreased, so at least Cleveland isn’t alone in the bad news bin. But the state’s drop was just two points. Cleveland’s was four.
Chart 6. Cleveland NAEP scores over time, eighth grade reading
4. Eighth grade math
In keeping with the pattern established by the other three exams, Cleveland’s 2024 average eighth grade math score (242) was lower than the average for students across the nation (272), in Ohio (279), and in large cities (266). Most urban districts performed significantly better, including Houston (twenty-three points better), Los Angeles (eighteen points better), and Atlanta (fifteen points better). Only Detroit (237) had a lower average score than Cleveland. Meanwhile, the district’s achievement level results were worse than any other subject. Just six percent of students scored at or above proficient. And sizable gaps exist between the district’s Black, Hispanic, and low-income students and their peers outside the city. Economically disadvantaged students in Cleveland, for example, posted an average score of 242. Ohio’s statewide average for similar students was twenty points higher at 262.
Chart 7. 2024 average NAEP scores for selected student groups, eighth grade math
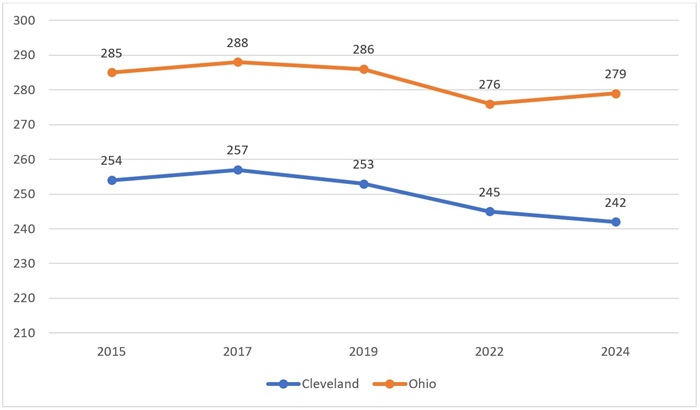
Those are abysmal results. But they’re particularly bad given that Cleveland’s eighth grade math scores have been trending downward over time. As chart 4 shows, achievement was slumping prior to the pandemic, with a four point drop between 2017 and 2019. Ohio’s statewide average mirrored that slump, though it wasn’t quite as steep. But then in 2024, the state’s average jumped three points. It’s the first time since 2017 that Ohio’s statewide average in eighth grade math has gone up. Cleveland, on the other hand, dropped another three points. 2024 marks the third consecutive year of eighth grade math declines for the district.
Chart 8. Cleveland NAEP scores over time, eighth grade math
***
There are several measures that advocates and families can use to gauge progress in Cleveland. In September, district officials were quick to point out that CMSD had earned an overall rating of three stars on its 2024 state report card. It was the first time in history the district had done so, which seemed like cause for celebration. But a closer look revealed that good ratings on the progress (four stars) and gap closing (three stars) measures were covering up one-star ratings in graduation (the district’s weighted graduation rate was just 77 percent) and early literacy (it moved less than one fourth of its off-track K–3 students to on-track). Fewer than one-third of students scored proficient or above on state exams in all subjects in grades 3–8 and on end-of-course exams. And more than half the student body was deemed chronically absent.
District officials might be able to paper over poor results on state report card measures by emphasizing their three-star overall rating. But there’s no way to paper over 2024 NAEP results. Cleveland is falling short compared to NAEP achievement standards—on each of the four exams, fewer than 10 percent of students earned a score of proficient or above. But it’s also falling short compared to everyone else—Cleveland students are performing far worse than students across the nation, in Ohio, and in the majority of urban districts. With the dissolution of CTA, Ohio’s third largest school district is now entering a new era. Here’s hoping that this one produces some better results for kids.
[1] The 2021 administration of NAEP was postponed due to the pandemic. NAEP also administers exams in science, writing, and several other subjects.