If you’ve been following the news lately, you might be led to believe that Ohio school districts are barely scraping by. The narrative runs like this: Ill-funded public schools are in crisis, the stingy legislature has made devastating cuts, private schools (and the families they serve) are “siphoning” money, and the whole system is “unconstitutional.” Sung nonstop by the public-school establishment with its political and media allies echoing it, this catchy song is all over the airwaves.
But if you listen closely, you’ll hear nails scraping on the chalkboard. The singers have been hiding important—and basic—facts about school funding in Ohio while presenting misleading numbers to their listeners.
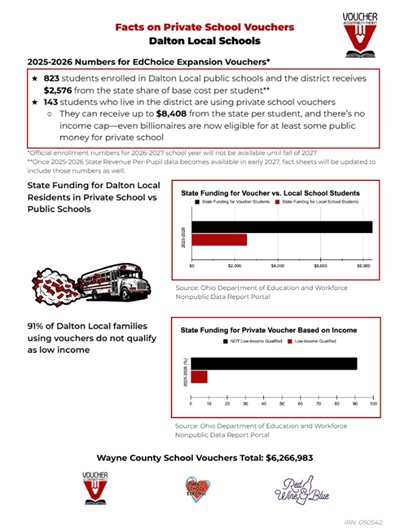 Consider this “fact sheet” from the advocacy group that calls itself Honesty for Ohio. It reports that my own local district (which had no part in creating the flyer) receives just $2,576 in base per-pupil state funding. Peanuts, right? Yet that amount seriously understates the district’s actual state funding which, was $5,706 per pupil in 2025–26.[1] Worse yet, the $2,576 number doesn’t come close to my district’s total per-pupil funding, which was $18,216 last year counting local, federal, and nontax sources along with state funds. But that big bottom-line number is omitted because disclosing it would weaken the goal of these “fact sheets,” which is to whip up opposition to state scholarships for kids to attend private schools.
Another example: a recent editorial by Susie Kaeser, an establishment player from Cleveland Heights-University Heights, raises alarms about a “financial crisis facing public schools” and attacks lawmakers for “triggering this crisis.” She includes a widely circulated but highly misleading 32 percent “state share” statistic—which we’ll come back to below. But nowhere in her 600-word piece does she disclose the total funding for Ohio public schools (it’s $17,568 per pupil). She also omits Cleveland Heights-University Heights’s whopping $27,527 per pupil in overall revenue, an amount that puts it among the highest-funded Ohio districts. Remember, total per-pupil funding is what matters most for students, as it represents the resources actually dedicated to their education. But those sums are intentionally ignored because they don’t fit the narrative.
On many occasions, I’ve tried to correct the record on school funding, yet plenty of misinformation keeps circulating. Allow me to review again the basics about school funding in Ohio using the most recent data from 2025–26 (FY26).
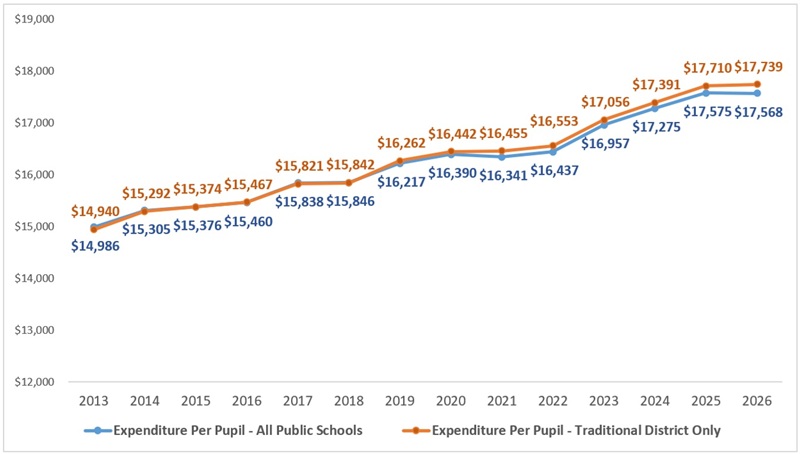
Figure 1 shows inflation-adjusted per-pupil expenditures of Ohio public schools since 2013. We see unambiguous growth, both for all forms of public schools (traditional districts, public charter schools, and JVSDs) and for traditional school districts only. District-only spending reached another record high of $17,739 per pupil last year—18.7 percent higher than in 2013 in “constant” dollars. In other words: Over the past decade—during which school choice has grown—there’s been no “disinvestment” in traditional public schools. In truth, Ohio districts are receiving more money per student now than ever before. Again, that’s after taking inflation into account.
Figure 1. Statewide expenditures per pupil, adjusted for inflation
In their latest round of grievances, public-school advocates also claim that the “state share” of public school funding has fallen to 32 percent—the lowest level, they say, over the past couple decades. But that’s not true, either. As the table below shows, the state share was 43 percent in FY26. Note, too, that the table doesn’t show the state’s full involvement in funding Ohio’s public schools. The 20-mill state-required property tax—a fundamental element of the state’s overall foundation funding program—appears in this table as “local revenue.”[2] If it were included in the state column, it would show that Ohio’s overall “state” investment in public schools exceeds 75 percent out of a total that’s nearing $23 billion.
Table 1. State revenue as a percentage of state and local funding, Ohio traditional school districts
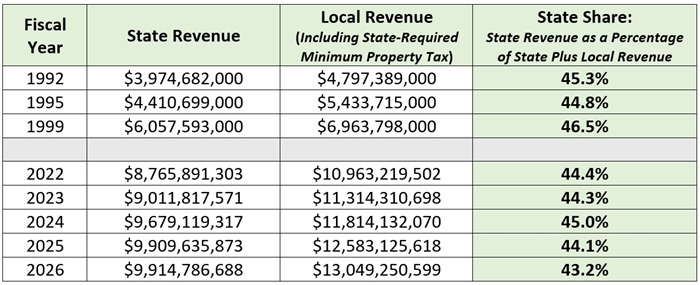
How can there be such a significant difference between what Ohio provides its public schools and what advocates claim? The answer is cherry-picked data. To persuade policymakers and taxpayers that they need more money, public-school groups deceptively focus on a mechanism inside the school funding formula (the “state share percentage”), but it’s also one that disregards billions in state funding. The result is a false and misleading picture of Ohio’s contribution to its public schools.
* * *
In this Thanksgiving season, I am grateful for public schools. I am a graduate of the public school system. My mom was a public-school teacher and my son currently attends public school. I firmly believe that public schools do amazing things for many Ohio students. I root for their success and have advocated for smart and strategic uses of education funding.
My respect for public schools makes all this misinformation so frustrating. Omitting basic data, playing numbers games, and trashing their private-school counterparts may score political points. But in the long run, resorting to these kinds of tricks will further erode Ohioans’ trust in public education. It’s time to stop playing games and advocate for fair funding in an honest way.
[1] The document shows the “state share of base cost per student,” which is a fraction of the total amount districts receive from the state. Per the fine print of the “fact sheet,” the number will be revised, but has not as of the writing of this piece (2025–26 data have been available for about a month).
[2] Revenue generated from the 20-mill minimum property tax rate is officially booked and reported as “local revenue.”