Mobile Navigation

  • National
    • Policy
      • High Expectations
      • Quality Choices
      • Personalized Pathways
    • Research
    • Commentary
      • Gadfly Newsletter
      • Flypaper Blog
    • Events
    • Scholars Program
  • Ohio
    • Policy
      • Priorities
      • Media & Testimony
    • Research
    • Commentary
      • Ohio Education Gadfly Biweekly
      • Ohio Gadfly Daily
  • Charter Authorizing
    • Application
    • Sponsored Schools
    • Resources
  • About
    • Mission
    • Board
    • Staff
    • Career
Home
Home
Advancing Educational Excellence

Main Navigation

  • National
  • Ohio
  • Charter Authorizing
  • About

National Menu

  • Topics
    • Accountability & Testing
    • Advanced Education
    • Career & Technical Education
    • Charter Schools
    • Curriculum & Instruction
    • ESSA
    • Evidence-Based Learning
    • Facilities
    • Governance
    • Personalized Learning
    • Private School Choice
    • School Finance
    • Standards
    • Teachers & School Leaders
    • Think Again
  • Research
  • Commentary
    • Gadfly Newsletter
    • Flypaper Blog
    • Gadfly Podcast
  • Events
  • Scholars Program

The Education Gadfly Weekly

Sign Up to Receive Fordham Updates

We'll send you quality research, commentary, analysis, and news on the education issues you care about.
Thank you for signing up!
Please check your email to confirm the subscription.

The Education Gadfly Weekly: School board members are wearing rose-colored glasses

Volume 25, Number 40
10.9.2025
10.9.2025

The Education Gadfly Weekly: School board members are wearing rose-colored glasses

Volume 25, Number 40
view
Microphone
High Expectations

School board members are wearing rose-colored glasses

While local school board members’ partisanship and ideology largely mirror the American public’s, that’s not the case when it comes to their views on charter schools and teachers unions. And in terms of how they see their own districts’ schools, they might as well being wearing rose-colored glasses. Those are some of the findings in our latest study, which sheds light on the surprising ways that representation does and doesn’t work in one of the country’s most important democratic institutions.

Michael J. Petrilli, Adam Tyner, Ph.D. 10.9.2025
NationalFlypaper

School board members are wearing rose-colored glasses

Michael J. Petrilli | Adam Tyner, Ph.D.
10.9.2025
Flypaper

Families aren’t waiting for schools to be fixed

Robert Pondiscio
10.9.2025
Flypaper

Does AI only help motivated students?

Sean Geraghty | Mike Goldstein
10.9.2025
Flypaper

The impact of Covid K–12 disruption on college enrollment: Evidence from California

Jeff Murray
10.9.2025
Flypaper

The role of high schools in raising civic engagement

Jill Hoppe
10.9.2025
Flypaper

TFA, Gen-Z, and AI | Episode 989 of The Education Gadfly Show

10.8.2025
Podcast
view
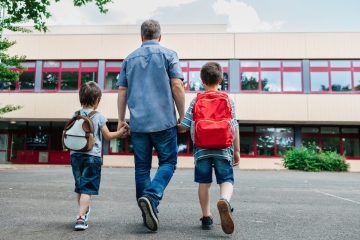
Father and sons walking to school

Families aren’t waiting for schools to be fixed

Robert Pondiscio 10.9.2025
Flypaper
view
Teenager doing homework on computer

Does AI only help motivated students?

Sean Geraghty, Mike Goldstein 10.9.2025
Flypaper
view
College

The impact of Covid K–12 disruption on college enrollment: Evidence from California

Jeff Murray 10.9.2025
Flypaper
view
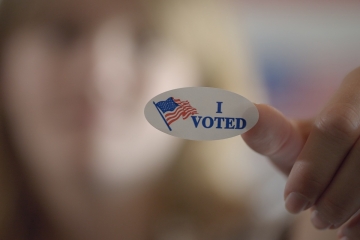
I voted sticker

The role of high schools in raising civic engagement

Jill Hoppe 10.9.2025
Flypaper
view
Aneesh Sohoni

TFA, Gen-Z, and AI | Episode 989 of The Education Gadfly Show

Aneesh Sohoni, Michael J. Petrilli, David Griffith, Ph.D., Adam Tyner, Ph.D. 10.8.2025
Podcast
view
Microphone

School board members are wearing rose-colored glasses

Michael J. Petrilli | Adam Tyner, Ph.D.
10.9.2025
Flypaper

The United States has more school board members than any other group of elected leaders—more than state legislators, more than city councilors. Even after many district consolidations over the past century, we still have over 13,000 school districts, virtually every one with its own board.

Despite its ubiquity and durability, however, the local school board is actually a pretty weird political institution. Since the Progressive Era, most board elections have been designed to “de-politicize” education, and consequently, they are often uncontested and held in odd corners of the calendar when few people vote, which means they’re often dominated by candidates with ties to the education establishment.

Yet school boards are also an enigma. Another vestige of the Progressive Era is that their elections are typically nonpartisan, meaning the ideological leanings and policy instincts of school board candidates are less obvious than for candidates in most other elections. And discussions about teaching, learning, school effectiveness, and pupil achievement, which would seem to be a school board’s chief reason for existing, are often notably absent from these elections—and then from board agendas. The typical school board meeting is more often focused on problems such as facilities management and labor issues than on academics, even as board decisions increasingly intersect with larger political battles, often culture war issues rather than the “three Rs.”

At a time when the country faces acute achievement challenges—just look at the latest NAEP results!—this must be termed misguided if not tragic.

To better understand the state of school boards today, we turned to two seasoned experts, Boston College’s Michael Hartney and George Mason University’s David Houston, to conduct our latest study, Who’s on Board? School Boards and Political Representation in an Age of Conflict. It includes perhaps the most ambitious survey of these groups ever attempted, with data from more than 5,000 board members in 3,093 distinct school districts, and sheds light on who America’s school board members are today, what they believe, and how their perspectives compare with the general public. Unlike most earlier surveys of school board members, Hartney and Houston were able to could compare board members’ responses to the beliefs of the American public, using questions modeled after those found in recent national surveys. They could also draw on the results of a 2001 survey of school board members that asked many of the same questions about their racial, ethnic, and other demographic identities, enabling comparisons of school board characteristics over time.

What emerges is a complicated portrait, with school board members relatively well-aligned with their constituents in some ways and notably less so in others. The authors find that board members are more likely to be White and college-educated than the nation as a whole. That is, in part, because of the country’s many rural and small-town school districts, which themselves are disproportionately White, but it holds even after adjusting for district size. The views of board members, meanwhile, diverge from those of typical Americans on some important issues. For example, the report finds that board members are unusually hostile to charter schools when compared to the public at large (and even more so when compared with Black adults). At the same time, board members view the performance of their own districts through rose-colored glasses, grading them far higher than their constituents do.

Taken together, these findings reveal fundamental tensions at the heart of school governance, and they suggest that the nation’s most local form of democracy may, in important ways, be drifting out of step with its citizens.

Who governs?

School board members look even more different from the nation as a whole than they used to. Most notably, as America has become significantly more Hispanic in recent decades, the proportion of school board members who are Hispanic hasn’t budged, even as the share of members who are Black has fallen. This means that, while the percentage of Americans who are White is down 10 percentage points since 2001, the share of school board members who are White has actually risen during the same period. (The gender gap, however, has closed.) (Table 1).)

Table 1: School board members are more White and more educated than the public.

1

Note: For details on the methodology, see the full report.

Nationwide, there are similar proportions of Democrats, Republicans, liberals, and conservatives on school boards compared to all U.S. adults. However, once the authors account for district size, they find that board members lean further to the left. Enrollment-weighted estimates show that 35 percent of board members call themselves liberals and 55 percent—a majority—are Democrats. Among the U.S. public, just one in four identifies as liberal and 43 percent are Democrats.

This is not the first time that observers have noted a representational mismatch in American governance. Congress, for instance, has long been Whiter, more affluent, and better educated than the general public. But the fact that school boards exhibit similar gaps raises important questions about their legitimacy and responsiveness.

The most anti-charter group in the country?

When it comes to actual education issues, board members’ beliefs and priorities are often out of step with that of their communities. The attitudes of board members toward charter schools are perhaps the starkest example. With the exception of teachers’ unions, school boards are likely the most charter-averse constituency in K–12 education.

Fifty-nine percent of their members oppose charter-school formation, while only 29 percent support it. Among the U.S. public, the pattern is reversed: 45 percent support charters, while just 36 percent oppose. The divide is even more pronounced when racial differences are taken into account. Black adults, for example, are 25 percentage points more supportive of charter schools than the average local board member.

Figure 1: Board members oppose charter schools far more than the public.

1

Note: For details on the methodology, see the full report.

What explains this gap? Part of the answer may be institutional self-interest. Like unions, school boards likely view charters as competition. Opposition may thus reflect a defensive instinct to protect district enrollments, funding, and influence.

Other factors may relate to race and ideology. Given that board members are, on average, Whiter and more liberal than the communities they represent, skepticism toward charters aligns with broader partisan and demographic patterns in which White liberals are the most hostile demographic to charter expansion. To the extent that boards position themselves as opponents of charter growth, however, they risk not only constraining parental choice but also alienating communities that see charters as a pathway to better opportunities.

Grade inflation

Another critical finding is the stark gap between school board members and the public they serve when it comes to the performance of their own schools.

When asked to grade their own districts, three-quarters of board members award an “A or B.” Among the general public, however, only about half grade their own schools so highly. That 25-point gap suggests that those in charge see their schools in far rosier terms than do the parents and citizens on the ground.

Figure 2: Board members give their schools higher grades than the public does.

2

Note: For details on the methodology, see the full report.

How could this be? It may be that board members are simply invested in the system and inclined toward institutional loyalty. Their close working relationships with superintendents, teachers, and administrators may predispose them to interpret data and outcomes in the most favorable light. And their higher levels of education may shape their standards for judgment in ways that differ from those of the broader public.

But whatever the reason, the consequences are significant. If board members consistently overestimate the quality of their districts, they may fail to recognize the urgency of reform in those same districts. They may dismiss parental complaints as outliers rather than indicators of systemic problems. And they may approve policies or budgets that assume widespread satisfaction when in fact many are dissatisfied.

This grade inflation on the part of board members is more than a psychological quirk. It is a governance challenge. It raises the possibility that school boards are insulated from the very feedback loops that democratic accountability is meant to provide. Thus, frustration at the grassroots is fueled by complacency at the top, a combustible combination in an era of heightened political polarization alongside faltering student achievement.

Reconnecting governance to communities

The findings of this bold and comprehensive study—including demographic distinctiveness, opposition to charters, and the mismatch in judging local schools—converge on a common theme: a widening disconnect between school boards and their constituents. As political scientist Vladimir Kogan notes in his recent book, partisan polarization in education has become “top-down [and] elite-driven,” which helps explain why boards may be increasingly untethered to community sentiment.

For policymakers and reformers, the message is clear. Efforts to strengthen school performance and results-driven accountability must grapple with the fact that today’s boards are not always reliable proxies for community sentiment. Initiatives to expand education choice must anticipate resistance from boards even when demand from families is strong.

If we want America’s school boards to actually embody the democratic spirit and come closer to representing the views of the communities they serve, we may need to make them more democratic. That would mean rethinking reforms that may have made sense a century ago but that no longer work very well. For example, perhaps school board elections should shift to November in even-numbered years. Candidates should be a lot more transparent about their views of district performance and what needs to change. State and local ed-reform groups and advocates—and the media—should become far more attentive to who is running, what their agenda is, and where they’re coming from. 

More politics and transparency might sound like a strange prescription for our polarized and noisy time, but it may just be the cure for a system that has become unrepresentative, unresponsive, and unwilling to embrace change.


view
Father and sons walking to school

Families aren’t waiting for schools to be fixed

Robert Pondiscio
10.9.2025
Flypaper

Coming out of Covid and with an efflorescence of alternatives to traditional public schools, it’s been clear for a while that the relationship between families and schools is in play to a degree that would have seemed impossible just a few years ago. For generations, the public school down the street was the unquestioned default; education reformers might argue about how to fix it, or champion competitors like public charter schools, but few questioned its permanence.

That’s changing and probably for good. Parents are no longer waiting for reforms to arrive or bear fruit. They are seizing new opportunities to direct their children’s education, aided by policies that allow dollars to follow students instead of funding systems. Education savings accounts (ESAs) are the leading edge of that change. Now enacted in more than a dozen states, ESAs deposit a portion of state per-pupil funding into accounts that parents can use for approved educational expenses—tuition, tutoring, curricula, therapies, even to defray costs associated with homeschooling.

The idea is simple but profound: Public funding for education no longer has to mean attendance at a single assigned school—or a school at all. A new report suggests this shift is not only real—it’s sticky. The University of Arkansas’s Department of Education Reform has released its second annual evaluation of the state’s Education Freedom Accounts. Authored by Daion L. Daniels, Alison Heape Johnson, Joshua B. McGee, and Patrick J. Wolf, it shows participation more than doubled in 2024–25 to 14,256 students (10,834 private school attendees; 3,422 homeschooling).

To my mind, however, the most telling data point is the program’s 91 percent retention rate into year three. That number suggests that families are not dabbling impulsively with alternatives to traditional public schools or leaving them in a fit of pique only to return. They’re making durable changes. If this trend holds and is replicated in other ESA states, it should set off alarm bells in public school districts nationwide. It suggests that once parents exercise choice, they rarely go back.

Achievement results are respectable: On nationally normed assessments, EFA students scored around the 57th percentile in math and 59th in English language arts. But the bigger story is persistence and its visible effects. As families commit, providers are multiplying. The Arkansas report shows more than 2,100 approved private schools and service providers are available in 2025–26, up from 1,800 the year before. If parents prove loyal to their choices, it will be worth watching whether these new institutions and service providers display the same staying power—evidence that a parallel education ecosystem is taking root.

Because ESAs are still in their infancy, reliable enrollment and persistence data are hard to come by. But early indications suggest that Arkansas is not an outlier. Across states with broad eligibility, families are moving quickly:

  • Arizona now counts nearly 94,600 ESA students, a figure larger than the enrollment of Mesa Unified—the state’s biggest district—and enough to place it among the top 30–40 districts nationally.
  • Florida serves more than 500,000 students through its universal voucher and scholarship programs.
  • Iowa’s Students First ESA enrolled nearly 28,000 students in its second year, ahead of projections.
  • West Virginia’s Hope Scholarship supports about 10,000 students this year, with projections to double in 2025–26.
  • Utah’s Fits All Scholarship launched with about 10,000 seats and was oversubscribed immediately.
  • New Hampshire’s ESA program serves close to 10,000 students and has raised its cap again for 2026–27.

The programs, policies, and mechanics differ from state to state—ESA, voucher, or tax credit—but the pattern is consistent: Eligibility drives uptake. When parents are given broad access, many use it.

Critics often argue that ESAs mainly subsidize families already in private schools. That may be partly true at the outset, but it misses the larger dynamic. As the Arkansas report suggests, new and durable funding streams invite new entrants: low-cost private schools, microschools, hybrids—much as the charter movement did a generation ago. Said differently, an ESA doesn’t change who is eligible to receive a free public education. It changes who is eligible to provide it.

The Arkansas findings, paired with rapid growth in Arizona, Florida, and elsewhere, show that this is no longer merely a theoretical possibility. The shift is happening—and parents are sticking with it. This summer, Congress created the first federal scholarship tax credit in the One Big Beautiful Bill Act. Beginning in 2027, taxpayers will be able to claim a dollar-for-dollar credit up to $1,700 for donations to state-approved scholarship organizations. States must opt in, but where they do, new dollars will flow via “scholarship granting organizations” to schools and providers. The credit is a force multiplier. In states with universal choice, it pulls private philanthropy into the system, helping families cover transportation or fees. In voucher and tax-credit states, it strengthens scholarship-granting organizations and trims waitlists. In states without choice laws, it offers a back door: Governors can opt in, SGOs can organize, and scholarships can flow without new ESA statutes.

Policy debates will continue, including the effects of choice on school districts. But the ship has already sailed with the usage numbers telling the story: Families are not waiting for system-level reforms to arrive. Where access is broad, participation follows—and persists. That does not spell the end of public education. It signals a new default. The public purpose in education is shifting from propping up systems to financing learning wherever families find it.

The Arkansas report is an early confirmation: Americans are voting with their feet, and they are not going back.

view
Teenager doing homework on computer

Does AI only help motivated students?

Sean Geraghty | Mike Goldstein
10.9.2025
Flypaper

From Silicon Valley to the World Economic Forum, boosters insist that artificial intelligence will transform education—closing learning gaps and personalizing instruction for every child.

We’re betting it won’t.

Two years ago, we argued here in “Transformative for the motivated and mere meh for the unmotivated” that AI would supercharge motivated learners while doing little for the unmotivated. We proposed a bet on whether Khan Academy’s AI-powered tutor would lift outcomes broadly.

Those data still aren’t out, so here’s our new wager: If AI really delivers for typical students—not just the self-starters—then by 2030, the schools, districts, or countries that use the most AI should show the biggest test-score gains.

Our bet: There will be no relationship.

If anything, AI might widen gaps—slightly increasing the number of motivated kids racing ahead while the unmotivated stand still, not much moving the average.

We expect NAEP scores to fluctuate for all sorts of reasons—pandemic recovery, curriculum reforms, demography, funding. But if AI is the breakthrough its boosters claim, the pattern should be unmistakable: The more AI in classrooms, the larger the gains. We don’t think that pattern will appear.

Early randomized trials offer little reason for optimism. One review examined 2,500 studies of AI and learning. Only 51 met even minimal standards. Just eight were in K–12, nearly all with small samples and short-term outcomes like unit exams or teacher-designed rubrics.

No scholar has yet published a yearlong study of hundreds of students comparing heavy AI tutoring, AI-assisted teaching, and business-as-usual instruction with state test results.

A few results are intriguing but narrow. Jill Barshay wrote how AI temporarily helped Turkish high schoolers learn more science—until they forgot it faster. Stanford’s co-pilot study found AI nudges made human tutors to be 4 percent more effective. In another paper, those Stanford scholars evaluated something we created: our AI “talk meter,” which improved human tutor behavior by prompting the educator to talk less and getting the kids to talk more. 

These were modest steps, not revolutions.

To be clear, some of our friends who build AI education tools are seeing legitimate, measurable gains—real learning improvements worth celebrating. Yet those impacts remain small, far from the sweeping transformation boosters predict.

David Labaree once wrote that schools are “remarkably resistant to change.” That remains true. Over decades, districts have implemented waves of “innovations”—ed tech, credit recovery, teacher evaluation systems, high-dosage tutoring, advisory programs—without mastering the details needed for impact.

AI is likely to follow that pattern. Some teachers are genuinely thriving with AI lesson planning and grading help—saving time. We applaud them. But there’s no evidence yet that this enthusiasm will translate into large-scale classroom transformation—or measurable learning gains.

Here’s what we see.

The good news: Some teachers are bringing back blue books to defeat AI-generated essays. Still, most students are using AI as a substitute for effort. The “who cares if nobody writes anymore” argument misses the point. Writing remains a key proxy for learning to make a reasoned argument. When students outsource that process, they lose more than grammar practice—they lose thinking practice.

Motivated teachers do get some genuine value from AI: better coaching scripts, faster feedback, lighter grading loads. But the scale of benefit is small. It’s unlikely to move national scores.

AI confers enormous advantages on kids who already care. The curious, the ambitious, the self-starters—they’re thriving. They’re using AI to learn coding, foreign languages, physics tricks, or even bass fishing at warp speed. Most kids, though, use AI like they use every other piece of ed tech: “How can I exert the least effort without getting in trouble?” That’s the “10 percent problem.” Roughly one in ten students use AI (or Khan Academy, or similar tools) as intended. The rest don’t.

AI may double that fraction—from 10 to maybe 20 percent. That’s progress. But it’s still far from the sweeping transformation boosters envision.

The missed opportunity

The most underused AI move remains simple: “Explain it to me like I’m in third grade.”

That command could unlock understanding for many struggling students. It’s not dumbing down; it’s scaffolding comprehension. But too often, students instead use AI to complete work they don’t understand—then hand it in for a grade. Teachers, aware of this, are reverting to handwritten work. It’s a modern replay of Ted Sizer’s Horace’s Compromise: both sides quietly lowering expectations to survive the system.

In many classrooms, kids now spend long stretches on assignments that have near-zero learning value, such as texts that are too hard to comprehend and problem sets that are too complex to solve independently. AI might at least prune those, helping students reach the same modest level of understanding more efficiently.

Imagine an unmotivated teenager told to clean his room. It takes 20 minutes to make the bed (poorly) and pick up his clothes (a few still miss the hamper). Now imagine a technology that achieves that same “sort of clean” in ten minutes. That’s not transformation. It’s efficiency.

But if AI can reclaim time otherwise lost to low-yield work, we could spend that time-dividend wisely. Earmark it for what teens need most outside school:

  • Real sports and fitness they actually enjoy.
  • Part-time jobs and volunteering.
  • Pleasure reading and musical instruments.
  • Unstructured adventures with friends.

AI may not lift NAEP scores or shrink achievement gaps. But if it frees hours for teens to build skills, health, and human connection, that’s the kind of learning worth betting on.

Robert Pondiscio once captured a hard truth about Success Academy charter schools, which he and we admire immensely. Robert wrote: “We can either attempt to serve all disadvantaged children equally, or we can do all in our power to ensure that receptive and motivated students can reap the full benefit of their talents and ambitions.” He was describing Success Academy’s model, but the same logic fits AI in education.

Early AI tools seem to, like other edtech, mostly help the receptive and motivated—the kids already leaning in—but that’s still real progress. If technology deepens engagement for those students, and even pulls a few more into that “motivated” camp, it’s a gain worth celebrating, not dismissing.

Mike Goldstein and Sean Geraghty founded the Center For Teen Flourishing.

view
College

The impact of Covid K–12 disruption on college enrollment: Evidence from California

Jeff Murray
10.9.2025
Flypaper

Except for cancelled proms and mothballed graduation celebrations, the class of 2020 largely escaped the negative impacts of pandemic school closures that wreaked havoc on younger students. As graduating seniors, their academic requirements were largely complete, and priority was given to making sure those who still needed a course or a credential got it, even if most other school functions were locked down or limited. Graduates who planned to go on to college, however, couldn’t escape Covid’s impact on post-high school plans. New research looks at California graduates to determine if and how their college enrollment patterns shifted.

A quartet of researchers from the University of California, Davis, and the University of Texas, Austin, link individual-level administrative data on hundreds of thousands of California high school graduates from 2016 to 2020 to FAFSA completion data from the California Student Aid Commission and college enrollment records from the National Student Clearinghouse. They create pooled mean data for the classes of 2016, 2017, and 2018, and compare that to the class of 2019 to craft a picture of pre-pandemic trends. These trends are then compared to enrollment pattern changes observed for the class of 2020. College enrollment data are measured at the spring semester following high school graduation (e.g., spring 2021 for 2020 graduates) to try to separate short term deferrals from actual lack of enrollment. The results are broken down by college type—in-state community colleges (two-year), the University of California system (four-year), other California state universities (also four-year), and everything else (California private colleges and any out-of-state institution, both two-year and four-year).

As may be expected, they find sizable negative effects on college enrollment for California’s graduating class of 2020. They estimate that Covid disruption lowered overall college enrollment by 7.6 percent by the spring of 2021, this on top of an already-declining rate from 2016 to 2019. Declines were largest in the community college sector (a 12.6 percent drop), for Black and Latino students (13.9 and 9.3 percent, respectively), for low-income students (10.3 percent), and for students from high schools with already-low college-sending rates. Interestingly, enrollment in the highly selective University of California system actually increased by a small but significant 4.5 percent over pre-pandemic rates. Gains were concentrated among Asian and White students and from schools that historically sent a large share of their graduates to college.

The authors conclude that those graduates who were most likely to go on to college in a normal year did not let the pandemic stop them in 2020, although many likely opted to stay closer to home than might otherwise have been the case. Many likely also deferred from fall entry to spring due to concerns over online learning or health worries, although detailed data on that question are not presented in the report. Of those graduates whose college matriculation was always less certain, however, many could well have chosen to forego the effort due to a myriad of pandemic concerns.

These findings furnish just a snapshot of the behavior of public school graduates in one state and thus may have limited generalizability. But the authors assert that California policymakers’ responses to Covid disruptions may be of wider interest. They note that the Golden State has recently passed legislation requiring all high school seniors to submit a FAFSA, expanding financial aid entitlement programs, and further increasing resources for community colleges (beyond federal aid)—all efforts to help institutions recover from the pandemic. The data indicate these are well-targeted investments…if recouping lost enrollment is the main goal. But the pandemic may have permanently altered who is going to college, what they are looking for from postsecondary education, and whether their future goals can be achieved by faster and cheaper non-institutional means such as apprenticeships or on-the-job training.

SOURCE: Scott Carrell et al., “College Canceled: What Happened to California’s High School Graduating Class of 2020?,” Educational Researcher (September 2025).

view
I voted sticker

The role of high schools in raising civic engagement

Jill Hoppe
10.9.2025
Flypaper

In the 2020 presidential election, barely half of 18- to 24-year-olds voted, compared to 76 percent of those in the 65–74 age group. While there are many reasons for lower turnout among youth (e.g., out-of-state college attendance, work conflicts, registration issues), a new working paper by Columbia University’s Kirsten Slungaard Mumma explores the role of high schools in shaping civic engagement.

The study uses data from Indiana public schools, focusing on students who entered ninth grade between 2007–08 and 2015–16 (456,700 students across 335 schools). The author merged education records with Indiana birth records and national voting files to link students to both their parents’ and their own voting histories.

Mumma used a value-added framework to estimate “school civic effects” (the effect that high schools have on the probability of voting). To predict student voting outcomes, her model controlled for demographics, eighth-grade test scores, prior attendance and behavior, parental voting behavior, and county characteristics. The gap between predicted and actual outcomes was then averaged for each school’s graduating class (the school-cohort level) to capture the school’s unique contribution to civic engagement. Descriptive evidence shows wide variation in civic engagement across schools (about a 19 percentage point gap by age 22) and school demographics, prior academic performance, and parental voting are strong predictors of a student’s adult voting behavior.

The study also examines the extent to which three non-civic school factors predict adult voting: (1) test score value-added on tenth-grade English and algebra exams; (2) non-cognitive skills, summarized in an index of ninth-grade attendance, suspensions, expulsions, course pass rates, and on-time promotion; and (3) college-going behavior, measured by SAT/ACT participation within four years of entering high school (though it’s worth noting that Indiana requires all juniors to take the SAT, which may limit its usefulness as an indicator of college intent).

Results suggest that non-civic factors raise likelihood of voting but less than civic effects themselves. For example, a one standard deviation increase in school civic effects corresponds to a 1.6 percentage point increase in the probability of voting by age 22, and 1.4 percentage points for participation in the first general election. This means that, even after controlling for multiple measures, the high school one attends is associated with one’s likelihood of voting. By contrast, gains in test scores or college exam participation are associated with only a 0.6 percentage point increase in voting, while non-cognitive effects are not significantly related to adult voting.

School and county characteristics also influence civic effects to an extent. Charter schools appear to have stronger civic effects though this advantage disappears once other factors are controlled for. School size shows a negative relationship with civic effects, meaning that larger schools tend to have smaller impacts on likelihood of voting. Schools in politically competitive and less Republican counties also tend to generate larger civic effects. Civic norms are especially influential. Parental voting behavior, which Mumma interprets as a measure of peer civic norms, is strongly associated with civic outcomes: A single standard deviation increase in average maternal voting is associated with a 1.7 standard deviation increase in school civic effects.

Beyond school and county characteristics, the study also considers whether the content of what schools offer, through coursework and extracurriculars, affect school civic effects. Participation and scores in AP U.S. History and AP Government are positively related to civic effects, but civics-related extracurriculars (e.g., debate, We The People, and mock trial) show little consistent association once other school characteristics are controlled for. The number of civics-related extracurricular activities is not significantly related to civic effects; in other words, simply offering civics-related extracurriculars does not guarantee stronger voting outcomes.

While some findings reinforce findings from previous research—such as the influence of schools and parents on children’s civic engagement—the study shows that high schools themselves leave a measurable imprint on whether young people vote.

The study also opens the door for future research on how teachers, staff, and school practices may foster a climate that encourages lasting civic participation. Future research might gauge the effects of high schools on raising other types of civic engagement, such as volunteering for a political campaign or other forms of activism, especially given the rise of student-led protests over the last half century.

High schools matter for long-term civic outcomes—not just through test scores or college readiness, but also through their contributions to civic participation. Strengthening school practices and civic-focused initiatives in schools that lag in both academic and civic effects could help prepare the next generation not only to succeed in education and work, but also to participate more fully in democracy.

SOURCE: Kirsten Slungaard Mumma, “High School Effects on Civic Engagement,” Annenberg Institute at Brown University (September 2025).

view
Aneesh Sohoni

TFA, Gen-Z, and AI | Episode 989 of The Education Gadfly Show

10.8.2025
Podcast
 

This week, Aneesh Sohoni, CEO of Teach for America, joins The Education Gadfly Show to discuss TFA’s impact in the classroom and beyond, why teaching is a compelling opportunity for Gen Z college graduates, what corps members are saying about AI in the classroom. 

Then, on a special Research Minute, Adam Tyner shares findings from Who’s on Board? School Boards and Political Representation in an Age of Conflict, Fordham’s brand new report by David Houston and Michael Hartney surveying school board members across the country.

Recommended content: 

  • Could an AI-driven “job apocalypse” push the best and brightest into teaching? —Michael J. Petrilli, Thomas B. Fordham Institute
  • Who’s on Board? School boards and political representation in an age of conflict —David M. Houston and Michael T. Hartney for the Thomas B. Fordham Institute (October 2025)

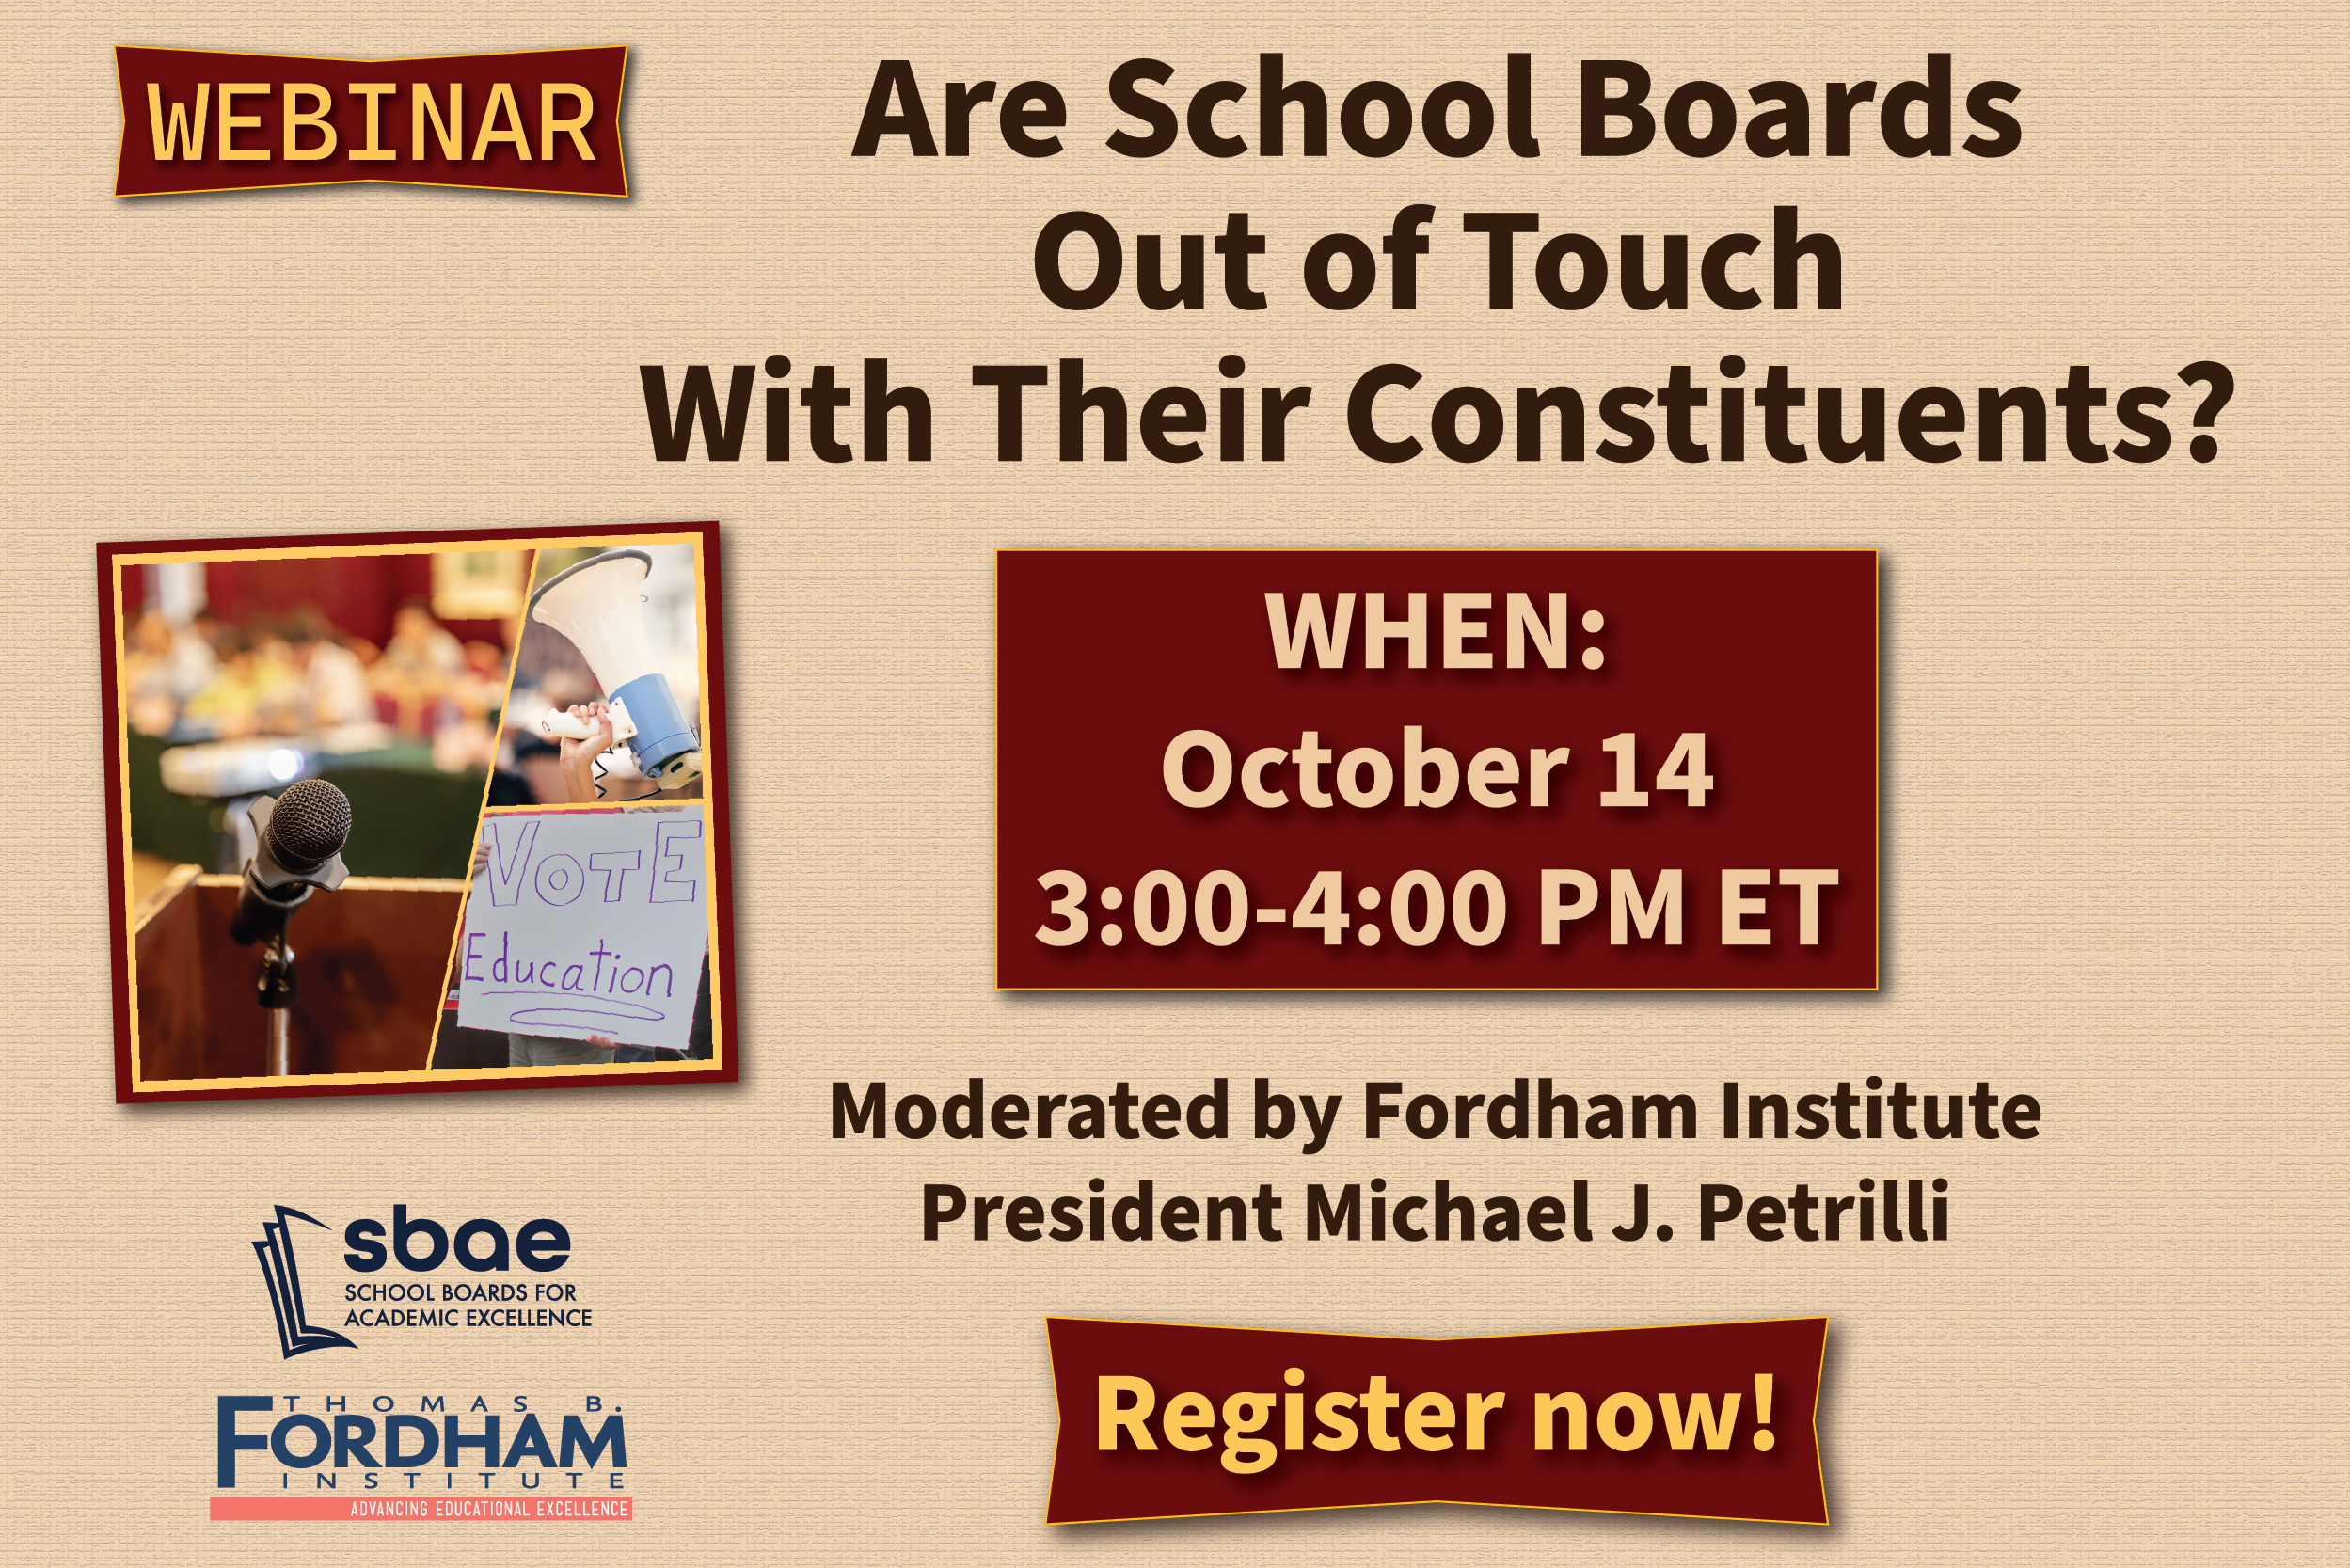
Upcoming webinar on October 14 at 3:00 PM ET: Are school boards out of touch with their constituents?

Webinar Graphic

Feedback Welcome: Have ideas for improving our show? Send them to [email protected]

Fordham Logo

© 2026 The Thomas B. Fordham Institute
Privacy Policy
Usage Agreement

National

P.O. Box 110
Burke, VA 22009

202.223.5452

[email protected]

Ohio

P.O. Box 82291
Columbus, OH 43202

614.223.1580

[email protected]

Sponsorship

130 West Second Street, Suite 410
Dayton, Ohio 45402

937.227.3368

[email protected]