Mobile Navigation

  • National
    • Policy
      • High Expectations
      • Quality Choices
      • Personalized Pathways
    • Research
    • Commentary
      • Gadfly Newsletter
      • Flypaper Blog
    • Events
    • Scholars Program
  • Ohio
    • Policy
      • Priorities
      • Media & Testimony
    • Research
    • Commentary
      • Ohio Education Gadfly Biweekly
      • Ohio Gadfly Daily
  • Charter Authorizing
    • Application
    • Sponsored Schools
    • Resources
  • About
    • Mission
    • Board
    • Staff
    • Career
Home
Home
Advancing Educational Excellence

Main Navigation

  • National
  • Ohio
  • Charter Authorizing
  • About

National Menu

  • Topics
    • Accountability & Testing
    • Advanced Education
    • Career & Technical Education
    • Charter Schools
    • Curriculum & Instruction
    • ESSA
    • Evidence-Based Learning
    • Facilities
    • Governance
    • Personalized Learning
    • Private School Choice
    • School Finance
    • Standards
    • Teachers & School Leaders
    • Think Again
  • Research
  • Commentary
    • Gadfly Newsletter
    • Flypaper Blog
    • Gadfly Podcast
  • Events
  • Scholars Program

The Education Gadfly Weekly

Sign Up to Receive Fordham Updates

We'll send you quality research, commentary, analysis, and news on the education issues you care about.
Thank you for signing up!
Please check your email to confirm the subscription.

The Education Gadfly Weekly: The remarkable educational attainment gains of the reform era

Volume 25, Number 41
10.16.2025
10.16.2025

The Education Gadfly Weekly: The remarkable educational attainment gains of the reform era

Volume 25, Number 41
view
College graduates
High Expectations

The remarkable educational attainment gains of the reform era

What’s missing in today’s conversations about American education is that the declines we’ve seen since 2013 or so came on the heels of two decades of remarkable progress. Perhaps my fellow ed-policy wonks understand that, but I doubt the general public does. And it wasn’t just test scores. Students graduated from high school and college in much greater numbers, too.

Michael J. Petrilli 10.16.2025
NationalFlypaper

The remarkable educational attainment gains of the reform era

Michael J. Petrilli
10.16.2025
Flypaper

The “deprivatization” threat: How private schools could soon look like public schools

Dale Chu
10.16.2025
Flypaper

A better way to measure school quality

Daniel Buck
10.16.2025
Flypaper

A first look at data on students waiving English Learner services

Jeff Murray
10.14.2025
Ohio Gadfly Daily

How to make sure science of reading reforms reach teachers

Elainah Elkins
10.16.2025
Flypaper

TFA, Gen-Z, and AI | Episode 989 of The Education Gadfly Show

10.8.2025
Podcast
view
Students in a classroom

The “deprivatization” threat: How private schools could soon look like public schools

Dale Chu 10.16.2025
Flypaper
view
Parent and child walking to school

A better way to measure school quality

Daniel Buck 10.16.2025
Flypaper
view
EL service waivers SR image

A first look at data on students waiving English Learner services

Jeff Murray 10.14.2025
Ohio Gadfly Daily
view
Students in a library

How to make sure science of reading reforms reach teachers

Elainah Elkins 10.16.2025
Flypaper
view
Aneesh Sohoni

TFA, Gen-Z, and AI | Episode 989 of The Education Gadfly Show

Aneesh Sohoni, Michael J. Petrilli, David Griffith, Ph.D., Adam Tyner, Ph.D. 10.8.2025
Podcast
view
College graduates

The remarkable educational attainment gains of the reform era

Michael J. Petrilli
10.16.2025
Flypaper

The national conversation about education, to the extent that one is actually happening, tends to come in two dialects today. The first involves a lot of appropriate hand-wringing about the decline in student achievement that started about 10 or 12 years ago, before the pandemic sent it over a cliff. This has been particularly acute for our lowest-performing students, who are disproportionately poor, Black, and Hispanic.

The more hopeful discussion is about Mississippi and some of its southern peers, which have bucked these trends, or at least made more progress against the headwinds than the rest of the country. That has, in turn, spurred some excellent journalism about why California, New England, and other states and regions have allowed themselves to fall so far behind.

But what’s hardly ever said in either of these conversations is that the declines we’ve seen since 2013 or so came on the heels of two decades of remarkable progress. Perhaps my fellow ed-policy wonks understand that, but I doubt the general public does. And we can’t say it often enough.

That’s for two key reasons. First, as Kant said, the actual proves the possible. It’s important to give people hope that we can turn around today’s challenging circumstances because we did it before, not so long ago. And second, some of the same policies and approaches that worked last time around might work again today. The conventional wisdom might be that education reform failed, but that is factually and historically incorrect.

Which is what made David Brooks’s New York Times column last week all the more praiseworthy. He noted that Republicans “are now kicking Democrats in the butt” on education policy—but more importantly—he reminded readers about the huge progress we made during the reform era:

Student achievement test scores in reading, math, and most other academic subjects shot upward between the mid-1990s and about 2013. In 1990, 48 percent of America’s eighth graders scored below basic competency in math. But by 2013 that was down to just 26 percent. The best part of this progress was that the scores of the most disadvantaged students shot up the most. Among Black students, the share of those scoring below basic in math fell from 78 percent to 48 percent. Among Hispanic students, it fell from 66 percent to 38 percent.

Student outcomes are rarely just about what happens in the schools. The policies of that so-called neoliberal era helped, too. Economic growth was strong; income inequality decreased. Between 1983 and 2010, the child poverty rate fell from 30 percent to about 17 percent.

Those are enormous gains, amounting to two to three grade levels of progress over the course of a generation or two of students. We would love to see that kind of progress today!

But to David I would say: It wasn’t just test scores. It was also educational attainment. The proportion of young people graduating from high school and completing two- and four-year college degrees also increased dramatically during this period. That’s true on average, but particularly for Black and Hispanic students. Let’s see what this looked like.

(Note: These data are from the Census Bureau, via NCES, and come from a survey of Americans ages 25–29 reporting their highest level of education. We display the data by high school graduating class so we incorporated an eight-year lag. [Twenty-six years old when taking the survey, more or less, minus 18 years old when graduating high school equals eight years.] The latest data are from 2024, meaning the high school graduating class of 2016.)

Figure 1. Education attainment by graduating class, all students, 1997–2016

1

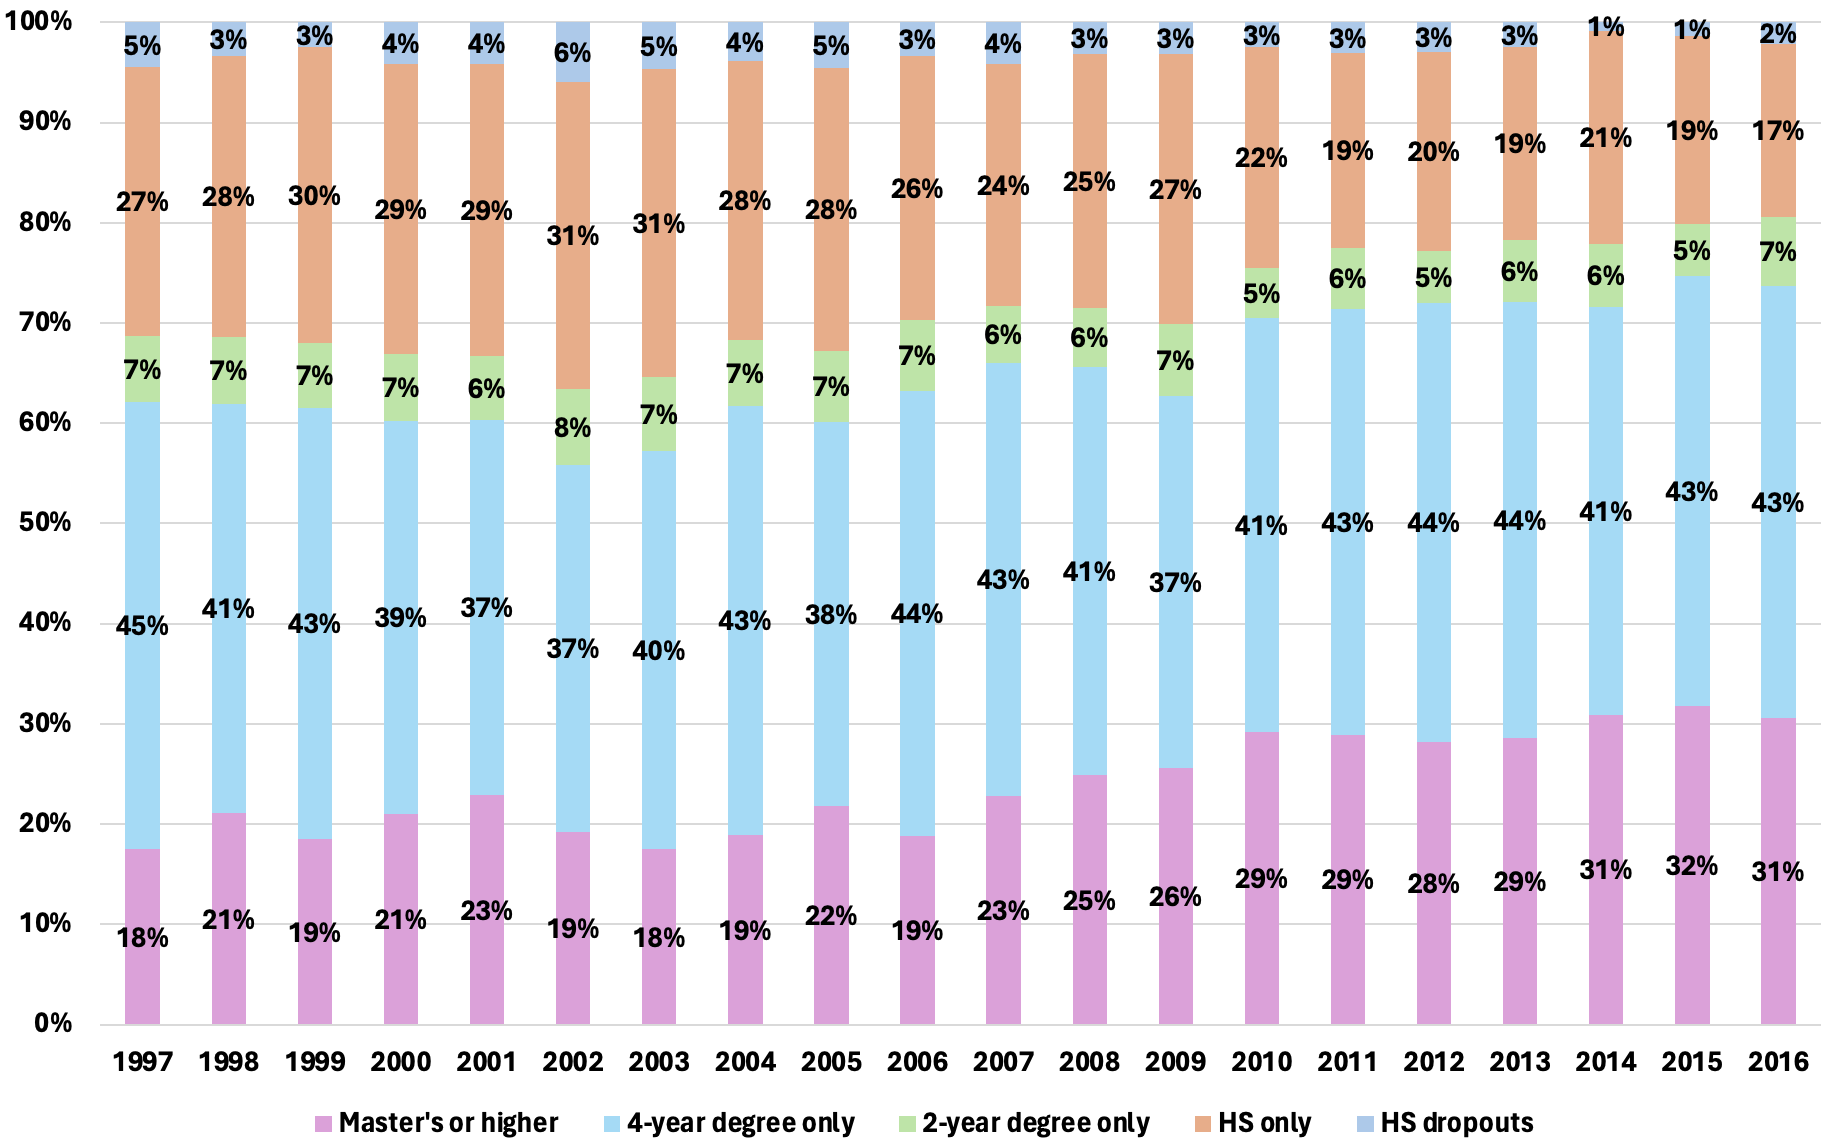
Figure 2. Education attainment by graduating class, Asian students, 1997–2016
2

Figure 3. Education attainment by graduating class, Black students, 1997–2016

3

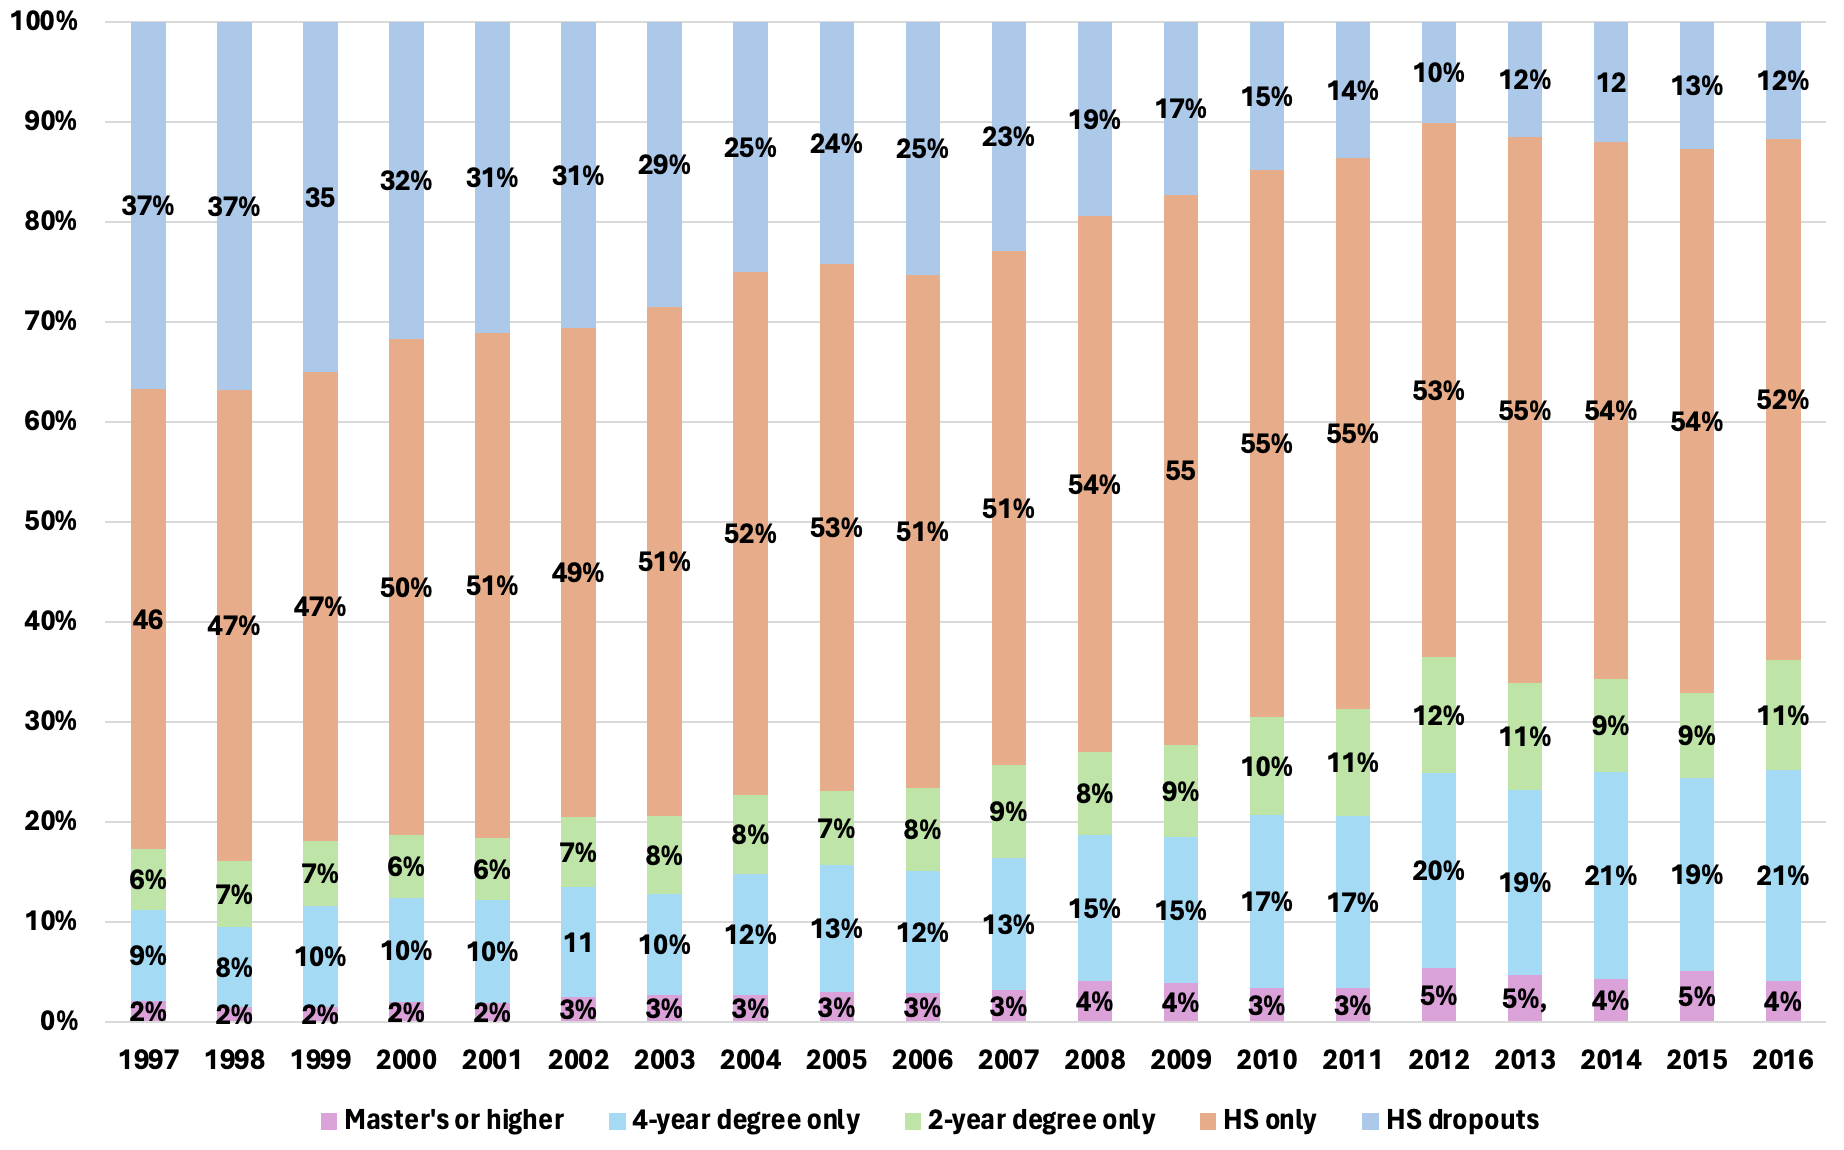
Figure 4. Education attainment by graduating class, Hispanic students, 1997–2016
4

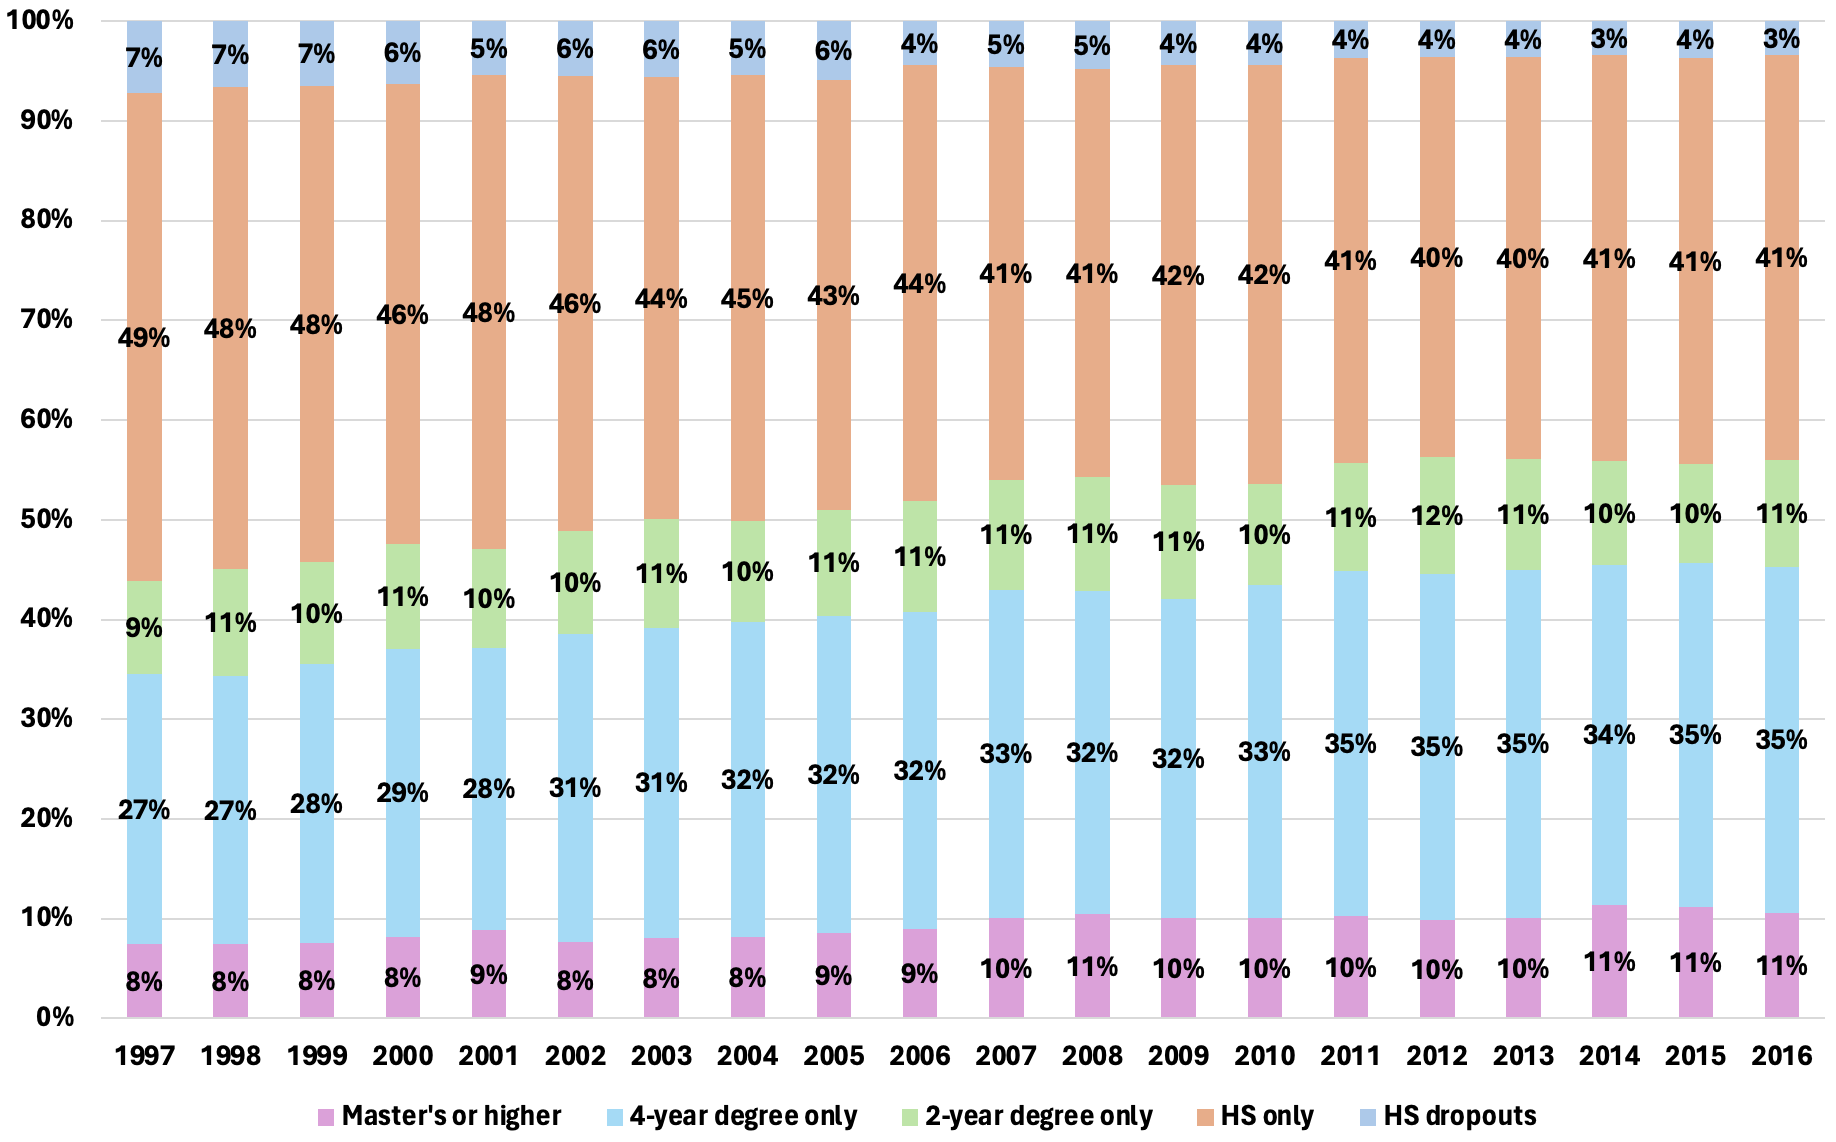
Figure 5. Education attainment by graduating class, White students, 1997–2016
5

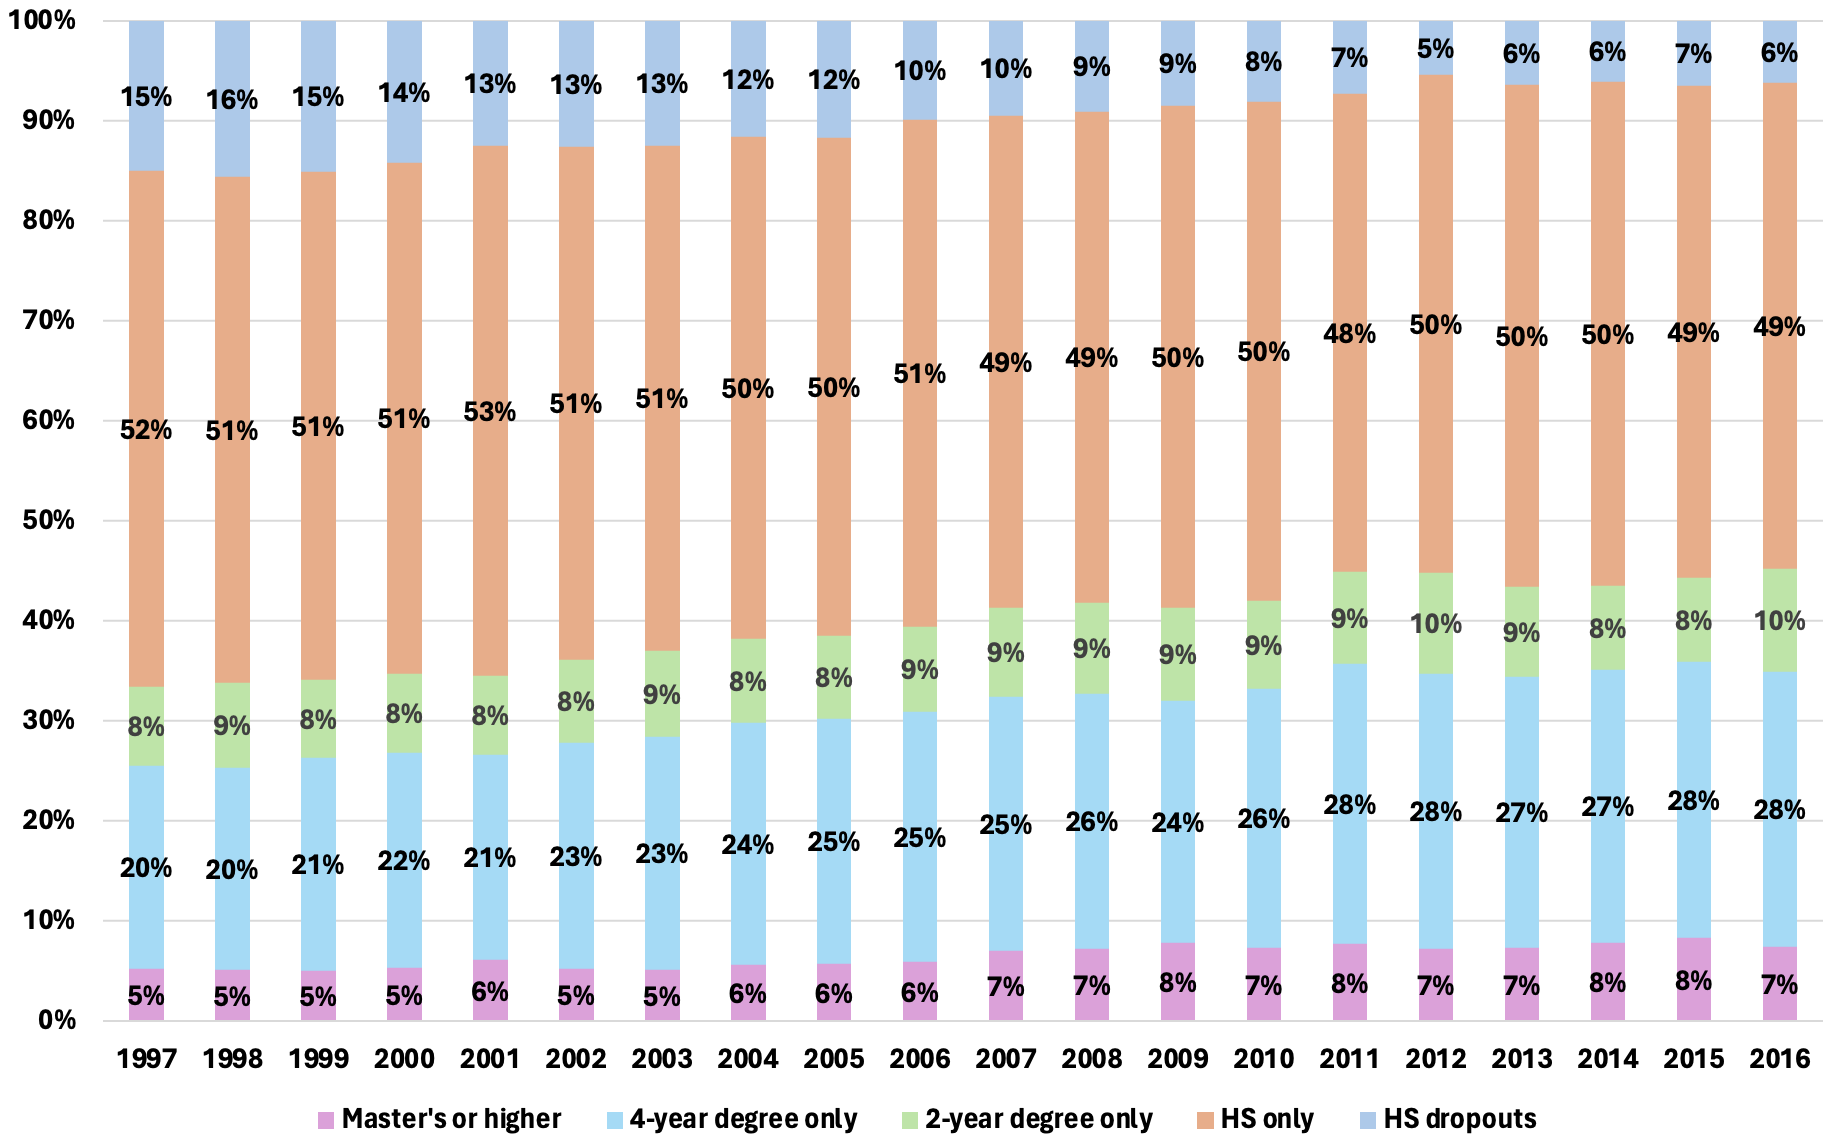
Figure 6. Education attainment by graduating class, male students, 1997–2016
6

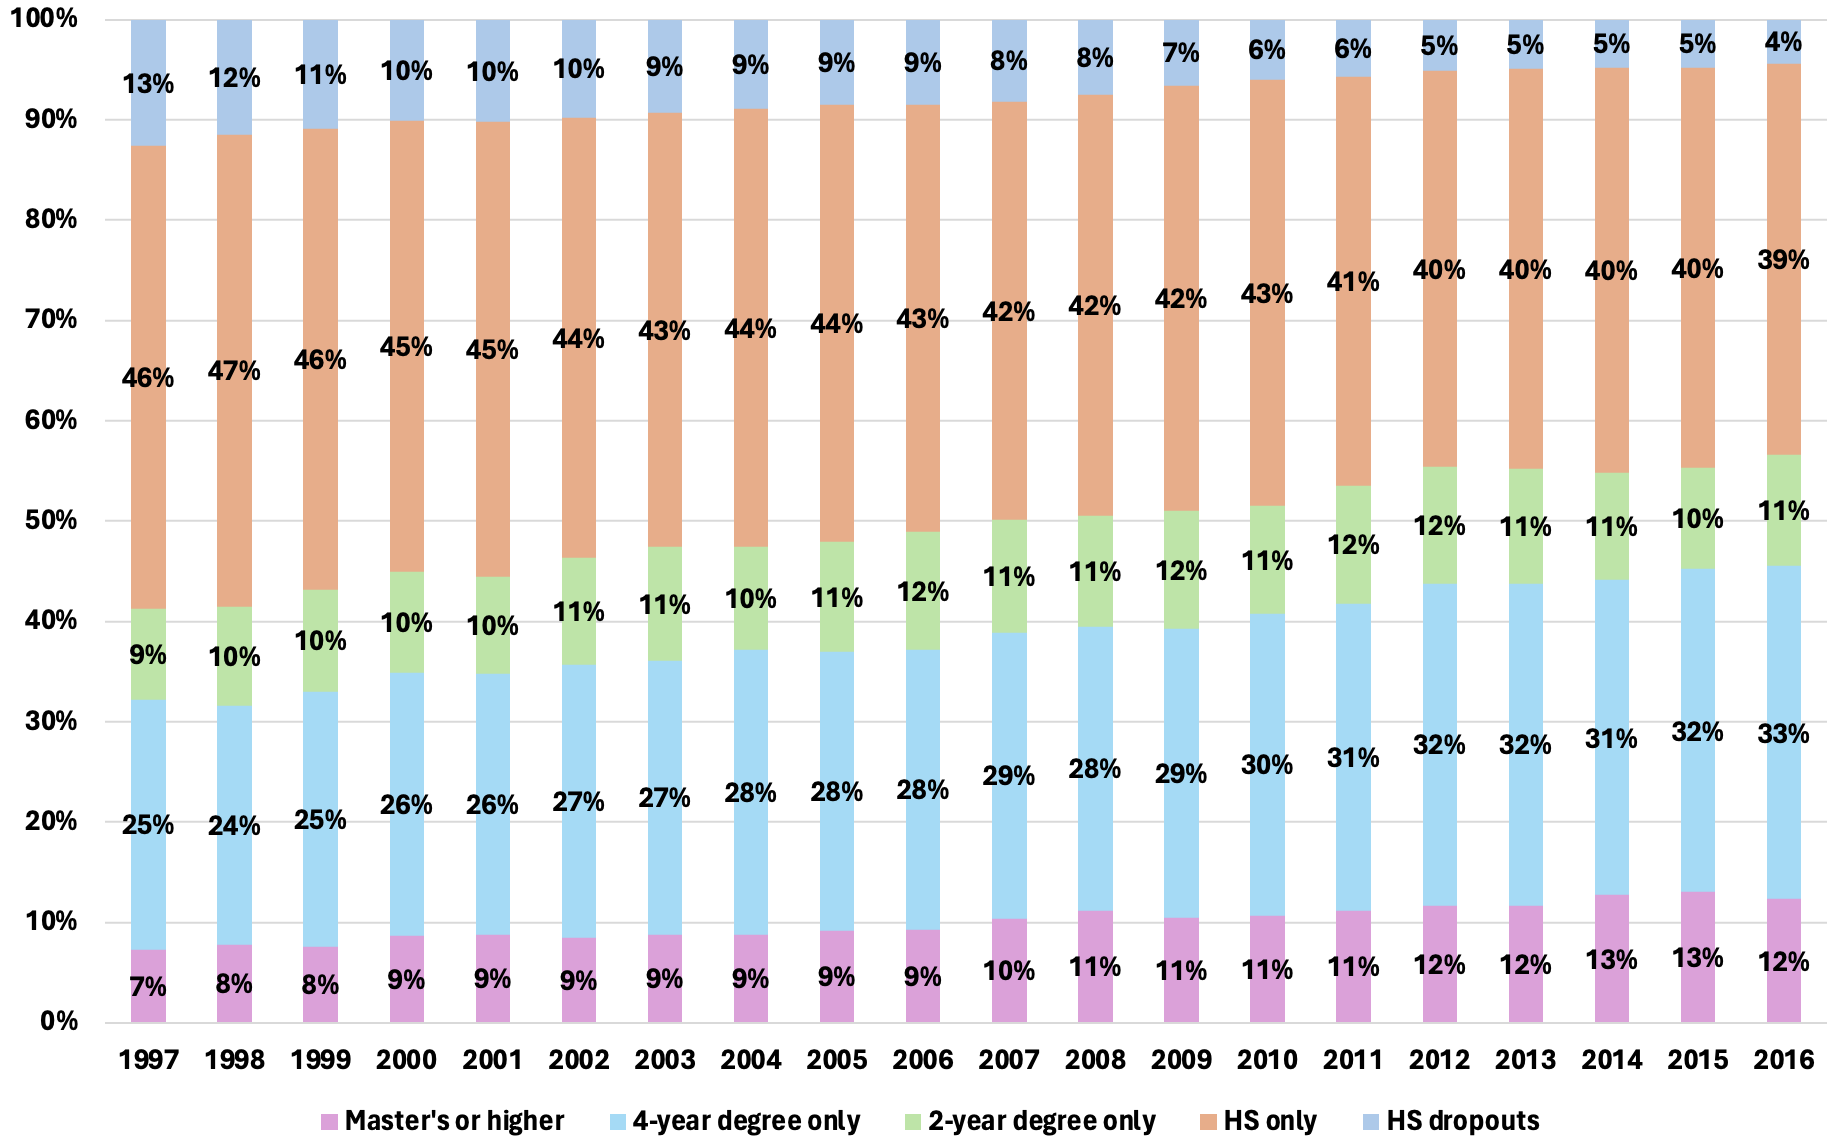
Figure 7. Education attainment by graduating class, female students, 1997–2016
7

That’s a lot of information to absorb, so let me highlight some of the best news depicted in these figures:

  • The percentage of young Americans with no high school diploma dropped by more than half from the class of 1997 to the class of 2016—from 14 percent to 5 percent.
  • For Hispanic students, it dropped by a factor of three, from 37 percent to 12 percent.
  • For young men, it dropped from 15 percent to 6 percent.
  • The percentage of young Americans with a two-year degree or higher shot up from 37 percent (Class of 1997) to 51 percent (Class of 2016). A majority of young Americans now have a college degree of some sort.
  • The percentage of young Black Americans with at least a two-year degree shot up from 27 to 42 percent; for young Hispanic Americans it more than doubled, from 17 percent to 36 percent.
  • The percentage of young women with at least a two-year degree rose from 41 percent to a remarkable 57 percent.

There’s a debate in academe about how much these attainment gains amount to real progress versus “degree inflation.” I’ve certainly been skeptical of some increases in the high school graduation rate, given all the games we’ve seen at the state and local levels, such as the adoption of dubious credit recovery programs, widespread grade inflation, and the elimination of end-of-course and exit exams like MCAS. It’s arguably never been easier to graduate from high school in America than it is today.

But that doesn’t mean all of these improvements in the graduation rate are fake. Doug Harris at Tulane University dug into this a few years ago and concluded that most of the progress was real. It helps that student achievement and attainment were moving in the same direction.

Education reform shouldn’t get all the credit for this remarkable progress in achievement and attainment. As I wrote back in 2019—and Brooks wrote last week—schools enjoyed strong tailwinds back then thanks to a booming economy, sharply declining child poverty rates, and big increases in spending. All of that mattered, too.

It’s also worth noting that college-going has declined significantly in the last few years—partly because of the pandemic and partly because of rising doubts about the value of college. We will surely see that translate into flatlining or even decreasing college attainment rates soon.

But here’s the bottom line: Our young people made huge gains from the mid-1990s to the mid-2010s, when education reform was at its zenith. We need to celebrate that success more often. Most importantly, we need to get back to making that kind of progress again.

Author’s note: Special thanks to Fordham Institute research intern Jill Hoppe for her help with the data collection and analysis for this post.


view
Students in a classroom

The “deprivatization” threat: How private schools could soon look like public schools

Dale Chu
10.16.2025
Flypaper

The new federal tax-credit scholarship is being hailed as a breakthrough for school choice: more options, more opportunity, more innovation. But history offers a warning. Even though these tax-credit funds never technically enter federal coffers, once Washington confers a benefit, its influence tends to follow. Over time, reporting requirements and red tape accumulate, reshaping how private schools operate and subtly nudging them to look and act more like the public institutions they were meant to stand apart from. Look no further than higher education, where decades of federal diktats—particularly around Title IX and gender identity—have tied colleges in bureaucratic knots, creating a system the Trump administration felt it had no choice but to try and blow up. Could a small Catholic or classical school face the same constraints in the coming decades, compromising the independence that makes these schools unique?

Charter schools offer a clear, closer-to-home example. I’ve visited hundreds of classrooms across the country and would be hard pressed to guess which were in charter schools and which were in district-operated schools without knowing beforehand. Curricula, professional development, pedagogy, and even classroom routines often converge, not because educators want to copy each other, but because incentives and ideology nudge them toward the same practices. This is why, for instance, charters and magnets are often confused and explainers are written to spell out distinctions that have become increasingly academic rather than real.

This phenomenon has a wonky name in organizational theory: institutional isomorphism. It describes how institutions—even those founded to be distinct—gradually start to resemble one another under common external pressures. Political pundit Jonah Goldberg recently illustrated the concept using familiar examples:

Fast food chains that once had a very specific niche now routinely expand their offerings to capture market share out of their lane. These days you can get espresso with your breakfast wrap from Dunkin’ and get doughnuts from Starbucks. The History Channel, A&E, and MTV once had very specific programming, now they all peddle reality shows and generic entertainment.

The system steers them toward the same offerings, regardless of their original brand identity. Whether that sameness stems from regulatory pressure, professional groupthink, or the public’s appetite for predictable experiences, the effect is the same: distinctiveness gives way to conformity.

The same could happen with Uncle Sam’s tax-credit scholarship. Gallons of digital ink have already been spilled on what the feds need to do vis-à-vis the forthcoming regulations from the Department of the Treasury, along with sanguine predictions about blue and red governors alike not being able to resist the allure of “free” federal money. But it’s worth remembering that the calculus is never fixed: Future administrations could alter the tax credit in ways with potentially profound effects.

Indeed, if Trump’s federal school choice regulations are good for the goose, AOC’s will be even better for the gander. The next time Democrats are at the switch, they could try and add requirements to scholarship granting organizations (SGOs) or, what’s more likely, they could allow states to add their own requirements. From non-discrimination rules and teacher certification mandates to detailed curricular standards and compliance audits, each additional layer of regulation exerts subtle pressure for schools to adopt the same administrative and instructional practices. Even measures reformers often prescribe, like standardized testing or financial transparency, could gradually guide schools toward uniformity, diluting the very distinctiveness that private choice was meant to protect.

These aren’t abstract concerns. Consider the downstream effects of technocratic strictures requiring all participating schools to accept special education students—and for issue-oriented watchdogs to follow with reports cataloguing their failings. Individualized Education Programs are often complex and bureaucratic, specifying services and accommodations that may not always align with student outcomes. Or imagine guidance—such as those derived from restorative justice—that could limit a school’s ability to enforce discipline according to its own standards. Over time, the stakes for receiving federal benefits could push school leaders to adjust their practices less out of pedagogical preference and more out of necessity, rewiring the incentives that define how these schools operate.

Even before the regulations are finalized, the effects could be far-reaching. Federal involvement, even when well-intentioned, has a way of standardizing institutions—making them more alike than different. Nor is it likely to go away. As Milton Friedman famously quipped, “Nothing is so permanent as a temporary government program.”

Proponents may be touting the new federal windfall as a fast lane for private school choice, especially in blue states, but early indications suggest Democratic governors are already hitting the brakes. In an era of negative polarization, there’s little to incentivize either party to move an inch toward the other. And knowing that Trump will eventually exit stage right, the real question is whether participating schools can navigate the inevitable swings of federal policy that come with our fractious politics—and how much of their distinctive character will be pulled, piece by piece, toward the same routines, rules, and structures that define the broader system.

view
Parent and child walking to school

A better way to measure school quality

Daniel Buck
10.16.2025
Flypaper

Mark Twain famously said that there are three kinds of falsehoods: “lies, damned lies, and statistics.” We need to add a fourth to that list: state-issued report cards on schools. Drafted with good intentions, these accountability measures have been redrafted into glorified district propaganda and are in need of not just reformation, but a complete restructuring.

In my hometown of Milwaukee, for instance, Jackson Elementary received three out of five stars from the state for the 2023–2024 school year, earning the designation “Meets Expectations”—all well and good. But at this three-star school, only 5.7 percent of their students can read and only 4.3 percent can perform math at grade level. In fact, 22 Milwaukee elementary schools have a “Meets Expectations” rating, even though fewer than a quarter of their students are proficient in reading and math.

Similar discrepancies exist in so-called “high-achieving” schools, too. Craig Montessori School received a rating of “Exceeds Expectations,” but its reading and math proficiency rates are 20 and 12.9 percent, respectively. Only seven out of the 19 schools that “exceed expectations” in Milwaukee have a proficiency rate over 40 percent. That means a high-achieving school, according to the state, is a school where the majority of students are behind grade-level.

Let’s be blunt: Such report cards are tantamount to lies. Most parents don’t parse through the state analytics and value-added growth models to discern the quality of their child’s school. They hear the principal tout their school’s four-star rating or see a banner over the classroom door reading “Exceeds Expectations” and trust they’re getting an honest account of what’s happening inside. It’s not just a technical issue of scoring rubrics but a breach of public trust that stymies our ability to address real issues in our schools.

While school report cards were a hot topic in 2015, when the Every Student Succeeds Act required states to craft them, they have since become an ancillary issue—overshadowed by Covid closures, culture debates over critical race theory and gender theory, and the popularity of education savings accounts. That is until Mike Petrilli resurfaced the debate in his newsletter, which spilled into a spirited debate on X.

Mike is right to raise the issue. While No Child Left Behind is every one’s favorite piñata to thwack, there’s a small but not insignificant body of evidence suggesting that, over the decade and a half after NCLB, states with stronger accountability measures saw greater achievement growth. Standards, accountability, and testing do indeed work. Moreover, even as school choice becomes the modus operandi for school funding in many states, any market requires sufficient information to function. School choosers (parents) need to know something about what it is that they are choosing.

The crux of the debate centers on whether states should prioritize growth or achievement. Achievement alone is a poor measure of school quality, since a student’s background so heavily impacts their academic achievement. But regardless of a student’s background or the cause of their lagging scores, it’s duplicitous to label the schools from Milwaukee as “exceeding expectations” when they do no such thing.

Many states have opted to mix the two into a single score, which muddles the information. Craft a convoluted sliding scale and throw in other factors—such as graduation and attendance rates, which are easy to game—as Wisconsin does, and you get a school with a near-zero achievement rate that can boast a “Meets Expectations” moniker.

What if instead of toggling around the edges of the scoring systems, we restructured it all together?

There are now numerous private organizations such as Great Schools and Niche that provide assessments of schools akin to the report card system. When I was looking for teaching jobs, I relied on these websites to provide me a sense of the school, knowing that report cards in my state had become a “trophy for everyone” kind of affair. Niche and Great Schools provide a far harsher and more realistic assessment than the state ever could or would. The incentives for painting a rosy picture, for policymakers and administrators alike, will always pull towards leniency, whereas private organizations need to provide an accurate picture for users to return and trust them.

The state still plays a role. They have access to scores of data which would be helpful for the public to have. State agencies could forgo the overall ranking—leave that to the private companies, which will do it more honestly—to instead make state report cards a simple dashboard of data about achievement, growth, absenteeism, and graduation rates. Growth scores are harder to manage in this system, as it requires student-level data that cannot be posted, but schools could make public the percentage of students that showed less than, at least, or well over grade-level growth per year.

This change would also help the carrot and stick accountability aspects of standards-based reform. Instead of mandating state intervention if a school drops to an “F” or “Fails to Meet Expectations”—a ranking which few schools ever receive, however deserving—policymakers should base the trigger for these interventions solely on data, which are harder to fudge.

It is certainly still possible to jigger growth and achievement cutoff scores, making it easier for a student to reach “proficient,” but that exists in the current system anyways. Posting raw data, instead of working them into a final grade, reduces the opportunities for massaging the final information into an overly optimistic picture.

If state legislators don’t improve the report cards, an increased reliance on alternative raters may be the natural result either way.

To improve schools, policymakers, researchers, parents, and the community more broadly need honest information. What’s working? Who’s succeeding? What’s failing? To answer these questions, we need clear communication and honest data. State report cards themselves fail these tests, and it’s time for intervention.

view
EL service waivers SR image

A first look at data on students waiving English Learner services

Jeff Murray
10.14.2025
Ohio Gadfly Daily

While potential cuts to federal funding for English learner (EL) services in schools are currently making noise, some timely new research takes a preliminary look at EL students whose parents choose to forgo the services they are entitled to under the Every Student Succeeds Act. How widespread is the practice? And who are the families opting out?

A research team led by Karen Thompson of Oregon State University looked at data from three states: Oregon, Texas, and Michigan. These include cohorts of students who entered ninth grade for the first time between 2011 and 2016; the total sample comprised over 116,000 EL students followed through 2020. They focus on grades 9–12 for this initial analysis because high schools saw the highest prevalence of students waiving services and because the limited prior research on the topic also focused on high school, allowing the team a reasonable comparison for their findings.

The majority of EL students in Oregon and Texas were Hispanic and reported speaking Spanish at home. In Michigan, about 40 percent of EL students were Hispanic (with about the same percentage reporting speaking Spanish at home) and just over 43 percent were White, with Arabic, English, and Albanian languages reported. There were slightly more males than females in all states, and more than 80 percent of EL families in every state were reported as economically disadvantaged.

The percentage of students whose families waived EL services varied widely across states: 2.1 percent in Michigan, 4.7 percent in Texas, and 14.3 percent in Oregon. Those rates remained relatively stable across high school years in Michigan and Texas; however, the rates rose sharply in Oregon, from 9.3 percent of freshmen to 26.3 percent of seniors. In all three states, families of students in special education, families of students considered long-term English learners (those who had received EL services for 7 or more years), and families of higher-income students were the ones most likely to waive services.

This is as far as the preliminary analysis goes for now (future studies will examine student outcomes), but the researchers do advance two broad possibilities to explain the opt-out patterns. First is variation in what services are provided for EL students. They offer the example of Oregon, where services at the time consisted of a single daily language course that did not result in credit toward a diploma. As graduation grew closer, it stands to reason that optional, non-credit-bearing courses would be jettisoned if students were in danger of not meeting their diploma requirements. By comparison, a majority of Texas EL courses provided graduation credit, and EL services in Michigan were largely provided via pullout interventions separate from course schedules. Of note, EL courses began bearing graduation credits in Oregon in 2021 in the wake of Covid disruptions, so subsequent analysis could bear out their supposition.

Second is variation in parental calculation of need or utility of services. They point to the subset of students who received both EL and special education services in all three states and suggest that waiving EL services would likely open up time for more special education courses or other interventions, which may have been attractive to families—especially, again, as high school graduation approached. They suggest further research on long-term ELs who also were identified with a disability in each state to investigate this possible mechanism.

There are more questions than answers here, obviously, but the avenues for further research seem clear and intriguing. Most relevant to the current political discussion: How do EL students fare academically with and without those services?

SOURCE: Karen D. Thompson, et al., “Waiving English Learner Services: Prevalence and Student Characteristics,” Educational Researcher (September 2025).

view
Students in a library

How to make sure science of reading reforms reach teachers

Elainah Elkins
10.16.2025
Flypaper

The science of reading (SOR) has been one of education’s hottest topics in recent years, with 40 states and the District of Columbia enacting SOR legislation. Yet, as reformers know, and as Fordham’s ongoing Wonkathon highlights, laws alone don’t guarantee meaningful change in classrooms. A recent RAND study by researchers Anna Shapiro and Laura Bellows examines how specific policies have impacted elementary teachers’ instructional practices.

SOR legislation spans a range of topics that vary from state to state. For this study, the researchers focused on three policy areas: curriculum and instructional materials, preservice training, and professional learning. Drawing on a nationally representative K–5 teacher survey from spring 2024 (N=1,880), Shapiro and Bellows explored questions about the number of K–2 teachers who use curricula aligned to SOR’s foundational reading standards, strategies teachers use to help students read unfamiliar words, and the pre- and in-service training that teachers receive on foundational reading skills.

Researchers used EdReports’ English language arts (ELA) reviews to create a list of SOR-aligned materials. The survey asked teachers to indicate which of these they used and how often they used them. In response, a majority of K–2 teachers reported using at least one ELA material (such as a textbook, online material, or curriculum) that meets expectations for each of the five SOR-backed foundational reading skills (phonemic awareness, phonics, fluency, vocabulary, and comprehension). However, teachers also reported regularly using materials that do not meet standards, and fewer than one-third relied exclusively on high-quality options. Perhaps most notably, teachers’ use of aligned items did not differ based on whether their state had a SOR law with an approved list of resources.

Although reading laws did not have a significant impact on curriculum and materials, teachers in states with policies related to SOR professional learning were more likely to report using methods aligned with foundational reading skills. For example, of K–2 teachers who received training, 69 percent indicated that helping a student decode a word would be their primary strategy, while only 4 percent said they would suggest using context clues first. Overall, teachers whose training emphasized phonics were more likely to feel prepared to teach SOR-aligned foundational reading skills. In fact, three-quarters of teachers reported that their professional learning helped prepare them to teach these skills.

Another encouraging finding was that many teachers are indeed participating in SOR-related professional learning. The study found that nearly three-quarters of K–2 teachers and two-thirds of teachers in grades 3–5 received professional learning on aligned practices. Among all elementary teachers, more than 90 percent took preservice courses on teaching the five foundational reading skills. Interestingly, however, only 47 percent identified preservice training as their primary knowledge source. Instead, they reported relying primarily on in-service professional learning and classroom experience for knowledge on teaching SOR skills.

These findings offer important insight into what is happening at the classroom level, as well as the components of SOR legislation that are most likely to drive changes in teacher behavior. Perhaps most interestingly, the findings reveal that teacher training is likely a stronger mechanism for influencing teaching methods than curriculum. While professional development is often a costly investment for states and districts, the dollars spent there may very well be worth it—at least when it comes to effective reading instruction.

Still, the findings leave readers with unanswered questions. For instance, the study concluded that teachers in states with SOR legislation are not consistently more likely to use SOR-aligned practices. This could be because of the sequences of laws and policies (e.g., several specific SOR policies implemented simultaneously might be more impactful), the resources allocated to implementation, or the overall political messaging and push behind the reforms. More research is therefore needed on how to help these laws live up to their potential.

SOURCE: Anna Shapiro and Laura Bellows, “Translating Reading Science into Practice—Foundational Reading Instruction in Public Elementary Schools: Findings from the Spring 2024 American Instructional Resources Survey,” RAND Corporation (April 2025).

view
Aneesh Sohoni

TFA, Gen-Z, and AI | Episode 989 of The Education Gadfly Show

10.8.2025
Podcast
 

This week, Aneesh Sohoni, CEO of Teach for America, joins The Education Gadfly Show to discuss TFA’s impact in the classroom and beyond, why teaching is a compelling opportunity for Gen Z college graduates, what corps members are saying about AI in the classroom. 

Then, on a special Research Minute, Adam Tyner shares findings from Who’s on Board? School Boards and Political Representation in an Age of Conflict, Fordham’s brand new report by David Houston and Michael Hartney surveying school board members across the country.

Recommended content: 

  • Could an AI-driven “job apocalypse” push the best and brightest into teaching? —Michael J. Petrilli, Thomas B. Fordham Institute
  • Who’s on Board? School boards and political representation in an age of conflict —David M. Houston and Michael T. Hartney for the Thomas B. Fordham Institute (October 2025)

Upcoming webinar on October 14 at 3:00 PM ET: Are school boards out of touch with their constituents?

Webinar Graphic

Feedback Welcome: Have ideas for improving our show? Send them to [email protected]

Fordham Logo

© 2026 The Thomas B. Fordham Institute
Privacy Policy
Usage Agreement

National

P.O. Box 110
Burke, VA 22009

202.223.5452

[email protected]

Ohio

P.O. Box 82291
Columbus, OH 43202

614.223.1580

[email protected]

Sponsorship

130 West Second Street, Suite 410
Dayton, Ohio 45402

937.227.3368

[email protected]