Mobile Navigation

  • National
    • Policy
      • High Expectations
      • Quality Choices
      • Personalized Pathways
    • Research
    • Commentary
      • Gadfly Newsletter
      • Flypaper Blog
    • Events
    • Scholars Program
  • Ohio
    • Policy
      • Priorities
      • Media & Testimony
    • Research
    • Commentary
      • Ohio Education Gadfly Biweekly
      • Ohio Gadfly Daily
  • Charter Authorizing
    • Application
    • Sponsored Schools
    • Resources
  • About
    • Mission
    • Board
    • Staff
    • Career
Home
Home
Advancing Educational Excellence

Main Navigation

  • National
  • Ohio
  • Charter Authorizing
  • About

National Menu

  • Topics
    • Accountability & Testing
    • Advanced Education
    • Career & Technical Education
    • Charter Schools
    • Curriculum & Instruction
    • ESSA
    • Evidence-Based Learning
    • Facilities
    • Governance
    • Personalized Learning
    • Private School Choice
    • School Finance
    • Standards
    • Teachers & School Leaders
    • Think Again
  • Research
  • Commentary
    • Gadfly Newsletter
    • Flypaper Blog
    • Gadfly Podcast
  • Events
  • Scholars Program

The Education Gadfly Weekly

Sign Up to Receive Fordham Updates

We'll send you quality research, commentary, analysis, and news on the education issues you care about.
Thank you for signing up!
Please check your email to confirm the subscription.

The Education Gadfly Weekly: A promising way to supplement test-based measures of school quality

Volume 25, Number 7
2.20.2025
2.20.2025

The Education Gadfly Weekly: A promising way to supplement test-based measures of school quality

Volume 25, Number 7
view
Students
High Expectations

Make room, test scores: Introducing “indicators of high school and middle school readiness”

Our latest study pilots a new measure of a school’s quality: its contribution to students’ grade point averages at their next school. It sends a clear message to educators that one of their core missions is to help their graduates succeed in their next step—not just in reading and math, but in all subjects—and not just on tests, but on the stuff that tests struggle to capture.

Amber M. Northern, Ph.D., David Griffith, Ph.D. 2.20.2025
NationalFlypaper

Make room, test scores: Introducing “indicators of high school and middle school readiness”

Amber M. Northern, Ph.D. | David Griffith, Ph.D.
2.20.2025
Flypaper

Mind the honesty gap

Dale Chu
2.20.2025
Flypaper

A bold state move to improve reading

Emily Freitag
2.20.2025
Flypaper

Artificial intelligence in English-language instruction: Looking at a pilot project from Nigeria

Jeff Murray
2.18.2025
Ohio Gadfly Daily

The state of pandemic learning loss recovery

Jeff Murray
2.20.2025
Flypaper

#957: DOGE, IES, and the future of education research

2.19.2025
Podcast

Cheers and Jeers: February 20, 2025

The Education Gadfly
2.20.2025
Flypaper

What we’re reading this week: February 20, 2025

The Education Gadfly
2.20.2025
Flypaper
view
Subway platform

Mind the honesty gap

Dale Chu 2.20.2025
Flypaper
view
Welcome to Mississippi

A bold state move to improve reading

Emily Freitag 2.20.2025
Flypaper
view
AI pilot project in Nigeria SR image

Artificial intelligence in English-language instruction: Looking at a pilot project from Nigeria

Jeff Murray 2.18.2025
Ohio Gadfly Daily
view
School building

The state of pandemic learning loss recovery

Jeff Murray 2.20.2025
Flypaper
view
flag with books

#957: DOGE, IES, and the future of education research

Michael J. Petrilli, David Griffith, Ph.D., Amber M. Northern, Ph.D. 2.19.2025
Podcast
view
Fordham Gadfly image

Cheers and Jeers: February 20, 2025

The Education Gadfly 2.20.2025
Flypaper
view
Fordham Gadfly image

What we’re reading this week: February 20, 2025

The Education Gadfly 2.20.2025
Flypaper
view
Students

Make room, test scores: Introducing “indicators of high school and middle school readiness”

Amber M. Northern, Ph.D. | David Griffith, Ph.D.
2.20.2025
Flypaper

Everyone knows standardized tests paint an incomplete picture of schools’ impacts on students. Yet coming up with thoughtful alternatives to tests is easier said than done.

After all, any truly informative indicator of school quality must satisfy at least five criteria.

First, it must be valid. In other words, it must capture something that policymakers, parents, or “we the people” care about.

Second, it must be reliable. That is, it must be reasonably accurate and consistent from one year to the next or when averaged over multiple years.

Third, it must be timely. For example, it makes little sense to report elementary schools’ effects on college completion, since that information would be useless to parents and policymakers by the time it was available.

Fourth, it must be fair. For example, if the point is to gauge school performance, an indicator shouldn’t systematically disadvantage schools with lots of initially low-performing students (though of course, it’s also important to report students’ absolute performance).

Finally, it must be trustworthy. For example, it may be unwise to hold high schools accountable for their own graduation rates, as ESSA requires, since doing so gives schools an incentive to lower their standards.

Finding an indicator that checks all of these boxes is inherently challenging. And in practice, bureaucratic inertia, risk aversion, and the difficulty of collecting and effectively communicating new data to stakeholders can make it hard for policymakers to think outside the box.

Still, there is at least one underutilized and potentially powerful data point that nearly every school system in the country already collects—a student’s grade point average (GPA). Might it be used to evaluate school quality?

Perhaps the most obvious objection is that holding schools accountable for their own students’ GPAs incentivizes grade inflation. But what if we instead rewarded schools for improving students’ grades at the next institution they attend? More specifically, what if an elementary school’s accountability rating were partly based on its students’ GPAs in sixth grade? Similarly, what if a middle school’s accountability rating were partly based on the grades that its graduates earned in ninth grade?

A measure that is based on students’ subsequent GPAs has at least two compelling features.

First, because it captures students’ performance across all subjects, it provides parents and policymakers with valuable information about underappreciated dimensions of schools’ performance.

Second, by holding schools accountable for students’ success at their next school, it disincentivizes teaching to the test, socially promoting students, and other behaviors that yield short-lived or illusory gains.

Of course, like standardized test scores, the grades students earn reflect their lives outside of school, in addition to whatever grading standards educators choose to establish. But what if we held schools accountable for their effects on students’ subsequent grades, much as traditional test-based value-added measures hold schools accountable for their effects on achievement?

In the past decade, rigorous research has shed new light on the effects that individual schools have on non-test-based outcomes,[1] of which “subsequent GPA” is perhaps the most connected to the day-to-day work of educators and has perhaps the most robust record of predicting students’ success.[2] Yet there has been no discussion of how schools could be evaluated for the additional value they might add to students’ grade point averages once factors they can’t control have been taken into account.

So, to better understand the potential of “GPA value-added” as an indicator of school quality, we asked two of the country’s most prolific education scholars, the University of Maryland’s Jing Liu (ably seconded by his research assistant, Max Anthenelli) and American University’s Seth Gershenson, to conduct parallel analyses of nearly a decade of student-level data from Maryland and North Carolina, both of which collect detailed information on students’ individual course grades.

Because of the limitations of that data, the North Carolina analysis does not examine elementary schools’ GPA-value-added (whereas the Maryland analysis includes both elementary and middle schools). But, overall, the results from the two states were encouraging and reasonably consistent, suggesting that the proposed indicator would likely exhibit similarly desirable properties in other jurisdictions.

So how does it work? (Warning: It’s complicated.)

To isolate a middle school’s contribution to students’ ninth grade GPAs, the proposed measure controls for a broad range of variables including but not limited to individual students’ eighth grade GPAs, eighth grade reading and math scores, and socio-demographic backgrounds, as well as the average eighth grade GPA of each individual middle school.[3] It then limits subsequent comparisons to students attending the same high school.

In practice, the inclusion of those school-average variables and the same–high school restriction effectively accounts for the unique approaches that schools take to grading, thus ensuring that middle schools that send their students to high schools with tougher grading standards aren’t unfairly handicapped. But, of course, even within a high school, not all courses are created equal. So, to avoid penalizing middle schools for putting more students on accelerated tracks, the proposed indicator only assesses a school’s effect on students who enroll in Algebra I in ninth grade, meaning it excludes the roughly 40 percent of students who enroll in more or less advanced courses.[4]

Intuitively, the resulting model relies on comparisons between “observably similar” students who attended different middle schools but the same high school (and were thus subject to the same grading standards). It also averages across lots of teachers and even more student-teacher relationships, thus ensuring that a particular school’s score won’t be unfairly high or low because Mr. Smith doesn’t like little Johnny’s attitude.

Principals and teachers who are familiar with test-based growth measures might best understand the new indicator as “GPA-based growth,” or the academic progress that a middle school’s students make as measured by their high school GPAs (or that an elementary school’s students make as measured by their middle school GPAs).

For parents and other guardians, an indicator of students’ “high school readiness” (or “middle school readiness”) likely makes more sense.

Now let’s look at how well the proposed indicator satisfies the five criteria outlined above.

Is it valid?

By definition, non-trivial effects on students’ subsequent GPAs are important. And in fact, the results suggest that both elementary and middle schools have sizable effects on the grades that students earn at their next schools.

Is it reliable?

Overall, the results suggest GPA-based growth is about as reliable as test-based growth. For example, the “intertemporal correlation coefficient,” which is a measure of year-to-year stability, is 0.86 for test-based value-added in North Carolina middle schools and 0.74 for GPA-based value-added.

Is it timely?

As noted, we propose that elementary schools be rated based on their effects on students’ sixth grade GPAs and that middle schools be rated based on students’ ninth grade GPAs,[5] meaning that information on middle and high school readiness would only be a year “out of date” by the time it reached parents and policymakers.

Is it fair?

As noted, both the elementary measure and the two middle school measures are uncorrelated with observable demographic characteristics. For example, there is no statistically significant relationship between a Maryland middle school’s GPA-based growth and the percentage of students who are economically disadvantaged.

Is it trustworthy?

Although it’s impossible to be sure, our sense is that it would be difficult to game this new measure. After all, the typical high school student gets letter grades in 6–8 subjects, each of which is taught by a different teacher. Moreover, even if every teacher in a high school lowered his or her grading standards, the effect on feeder middle schools’ GPA-based growth would be minimal because the measure would still be relying on comparisons between students from different feeder middle schools.

So, before piloting or otherwise experimenting with the measure, we recommend that states explain to educators the impossibility of artificially boosting schools’ GPA-based growth.

—

In case it’s not clear, we are not advocating for any version of the proposed measure to replace test-based growth. However, we do believe that it has potential as a supplement.

So let’s experiment with this new measure (and try to figure out how to communicate it effectively!). Because, at the end of the day, it sends a clear message to schools that one of their core missions is to help their graduates succeed in their next step—not just in reading and math, but in all subjects—and not just on tests, given the array of non-academic attributes that grades measure.

In short, it gives educators whose contributions are sometimes shortchanged by existing measures an officially sanctioned reason to do something that everyone should want them to do: teach to the best of their ability.


[1] Jackson, C. Kirabo. “What Do Test Scores Miss? The Importance of Teacher Effects on Non–Test Score Outcomes.” Journal of Political Economy 126, no. 5 (2018): 2072–107. Jackson, C. Kirabo, et al. “School Effects on Socioemotional Development, School-Based Arrests, and Educational Attainment.” American Economic Review: Insights 2, no. 4 (2020): 491–508.

[2] Bowen, William G., Matthew M. Chingos, and Michael McPherson. Crossing the Finish Line: Completing College at America’s Public Universities. Princeton, NJ: Princeton University Press, 2009. Roderick, Melissa, et al. From High School to the Future: A First Look at Chicago Public School Graduates’ College Enrollment, College Preparation, and Graduation from Four-Year Colleges. Chicago, IL: University of Chicago Consortium on Chicago School Research, 2006. https://consortium.uchicago.edu/sites/default/files/2018-10/Postsecondary.pdf. Bowers, A. J., R. Sprott, and S. A. Taff. "Do We Know Who Will Drop Out? A Review of the Predictors of Dropping Out of High School: Precision, Sensitivity, and Specificity." The High School Journal 96, no. 2 (2013): 77–100. Brookhart, Susan M., et al. "A Century of Grading Research: Meaning and Value in the Most Common Educational Measure." Review of Educational Research 86, no. 4 (2016): 803–48.


[3] Note that a school’s GPA is the average student’s GPA across all subjects including untested subjects. Results are similar when we consider different versions of GPA, such as using only core subjects or weighted GPA by number of credits.

[4] Because ESSA mandates that accountability systems include data for all students as well as specific subgroups, the measures that are the basis for this study may not be ESSA compliant; however, it is our belief that a suitably motivated state could construct analogous indicators for students who take other math courses in ninth grade, with the goal of constructing a more ESSA-compliant index.

[5] Note that ninth grade is often considered a “make or break” year for students, which is why some states and districts use the number of classes students fail in ninth grade as an early warning system.

view
Subway platform

Mind the honesty gap

Dale Chu
2.20.2025
Flypaper

A new report from the Collaborative for Student Success aims to refocus attention on the “honesty gap” in the wake of the latest (and disastrous) NAEP results. This longstanding issue is no longer just a policy concern—it’s a glaring failure of accountability. As states continue lowering proficiency thresholds, the disconnect between what students are learning and how their progress is reported grows wider. This isn’t merely a technical flaw; it’s a breach of public trust. The challenge ahead is clear: How can we reconcile the need for transparency and rigor with the public’s skepticism toward the very systems meant to ensure both?

Consider the current magnitude of these disparities: In New York, over half of fourth graders were deemed proficient in math on the state test in 2024—compared to less than 40 percent on NAEP. In Michigan, the gap is even starker: 65 percent of eighth graders were proficient in reading according to the state exam, while just 24 percent cleared the same bar on the nation’s report card. And in Iowa, nearly three-fourths of eighth graders were considered proficient in math, while only a quarter met NAEP’s benchmark. The list goes on. Compounding the problem is rampant grade inflation, which only got worse during the pandemic and has since widened both performance and attendance gaps. Taken together, the inaccuracy in reporting grades and test scores is a devastating one-two punch.

These inconsistencies aren’t new. More than fifteen years ago, my colleagues Checker Finn and Mike Petrilli warned of these very dangers in their introduction to The Proficiency Illusion, which lamented even then the vast discrepancies in how states defined proficiency:

America is awash in achievement “data,” yet the truth about our educational performance is far from transparent and trustworthy. It may be smoke and mirrors. Gains (and slippages) may be illusory. Comparisons may be misleading. Apparent problems may be nonexistent or, at least, misstated. The testing infrastructure on which so many school reform efforts rest, and in which so much confidence has been vested, is unreliable—at best.

The Common Core and its associated exams significantly narrowed these differences, but now they’re opening up again. As these gaps widen, so too does the disconnect between perception and reality—stymieing progress and making it harder to ensure students are truly prepared.

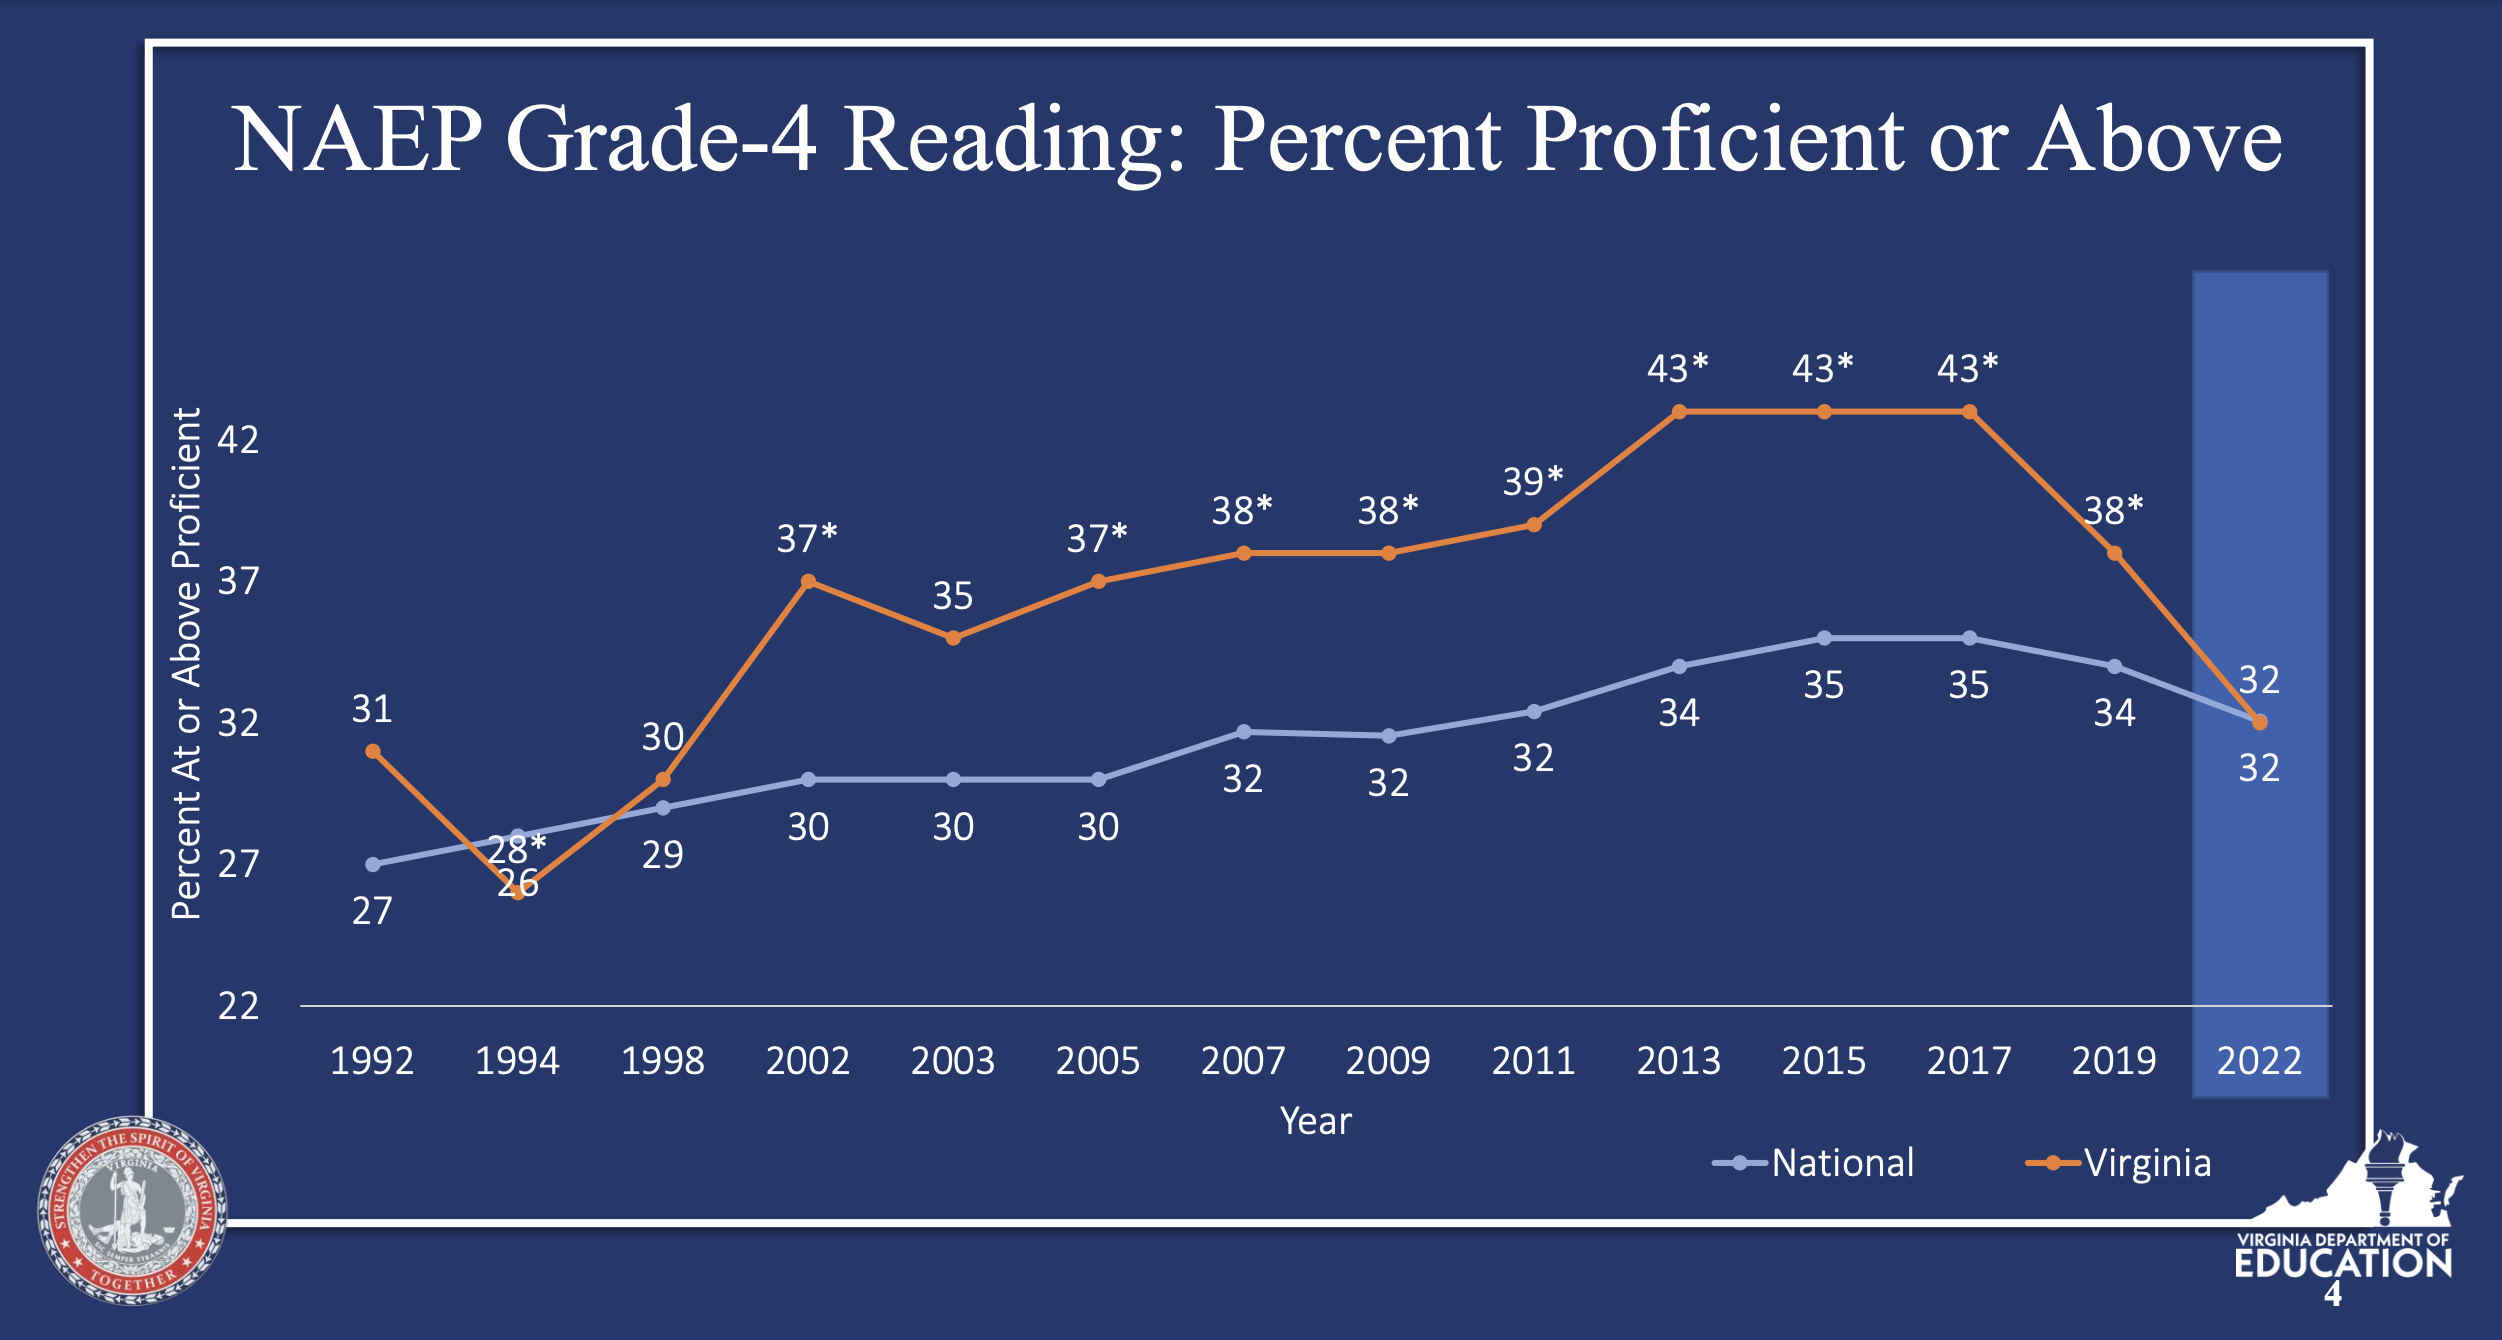
Nowhere have the consequences of this misalignment been more pronounced than in the Old Dominion, which has seen some of the nation’s biggest drops in reading and math scores (see graphic). Across the four assessed areas of NAEP, Virginia’s honesty gap ranged from an alarming 31 to a stratospheric 43 percentage points!

1

Source: “Our Commitment to Virginia’s Children: 2022 National Assessment of Educational Progress (NAEP) Virginia Results and Analysis,” Virginia Department of Education, accessed February 19, 2025.

Thankfully, no state in the union has taken bolder steps over the last three years to remedy these shortcomings. Under the determined leadership of Governor Glenn Youngkin and Secretary of Education Aimee Guidera, among many others, the commonwealth has been decisive in streamlining and reforming its accountability system while investing in tutoring, literacy, and student attendance as part of a comprehensive approach to beating back learning loss.

This week, I’ll be speaking with Guidera as part of a panel discussion I’m moderating on what it will take to get more states to reverse the trend of lowering proficiency standards. Halting this downward slide won’t be easy. At the federal level, Uncle Sam has erected a permission structure that defines deviancy down and incentivizes states and districts to meet students where they are, rather than pushing them to where they need to be. In states, a bipartisan backlash toward standardized testing has made matters worse, with many testing the limits of what’s required under ESSA.

The work being done in Virginia stands in sharp contrast to states that have opted to obscure their struggles rather than confront them. Hearing Guidera’s account of the state’s commitment to truth in reporting is a breath of fresh air. The next step is to raise the state’s cut scores, which will initiate a process that profoundly narrows the gap when the next round of NAEP scores is released. Yet, even with a concerted effort to restore transparency and rigor, the path forward remains uncertain. The clock is running out on Youngkin, who is constitutionally barred from serving consecutive terms in office. That term limit only increases the urgency of his efforts to raise expectations—and the question of whether his reforms will endure once he leaves office looms large.

Virginia’s experience also underscores a larger truth: State-level action alone often isn’t enough; durable change will require a coordinated national effort. Federal leadership, particularly from Secretary-designate Linda McMahon, could prove pivotal in ensuring this issue gets the attention it deserves. In fact, it might be the only way in the current environment. While it’s unclear whether she will prioritize it amid other pressing challenges, the need to increase transparency and rigor would seem to address President Trump’s vague assertion that America is “dead last” in education. And we already know that McMahon’s top lieutenants, Penny Schwinn and Kirsten Baesler, are smart and serious about ensuring assessments provide an accurate picture of student achievement.

To be sure, the honesty gap predates the current crisis of confidence in our institutions, but the erosion of trust has undeniably complicated efforts to close it. Beyond Virginia, few states have signaled a willingness to take on this fight. However, the reluctance to deliver bad news must end. If superintendents, school boards, and policymakers won’t tell the truth, who will? Parents, families, and advocates must demand better. Anything less risks undermining educational progress and will make solving the underlying problem of declining student achievement, particularly among marginalized students, far more difficult.

view
Welcome to Mississippi

A bold state move to improve reading

Emily Freitag
2.20.2025
Flypaper

When I started teaching in Louisiana in 2004, I was told that the state was expanding annual assessments of students to all grades 3–8 because Louisiana ranked forty-ninth in the country for reading proficiency. I started to hear a gutting phrase that I’ve since learned is common across the southeast, “the only state behind us is Mississippi. Thank goodness for Mississippi.”

On the recently released NAEP assessment, guess what place Louisiana ranked in fourth-grade reading? (14th.)

Guess what place Mississippi ranked in fourth-grade reading? (14th—tied.)

Out of fifty states, Mississippi ranked third in the nation for economically-disadvantaged students on fourth-grade reading proficiency. Black students in Mississippi have gained more in reading than Black students in any other state in the nation in the last ten years.

Much has been written about the “Mississippi miracle.” Many other states have learned from Mississippi’s 2013 Literacy Based Promotion Act and mimicked Mississippi’s policies and teacher trainings.

However, there is one move that Mississippi leaders made that I have not seen any other state implement. Given Mississippi's outsized gains, I think it is a move worth lifting. Mississippi leaders wanted to improve teacher coaching. Rather than sending money to schools or districts so they could hire coaches, the state hired eighty-five full-time teacher coaches and sent them to schools. They managed the coaches at the state level.

Here is the job description for those coaches. Coaches spent most of their days in their assigned schools coaching and conferencing with teachers, supporting school teams to use high-quality curricular materials, designing professional learning for teachers and leaders, reviewing data, and making recommendations for instructional practices. They spent some of their time in professional learning with the other coaches to support a deep understanding of the science of reading, adult learning theory, and the state policies.

What makes this strategy different—and bold—is that the state leaders implemented a strategy that did not go through districts, schools, or group training but drove embedded support directly into classrooms.

Then Secretary of Education for Mississippi Dr. Carey Wright explained: “I wanted to control for quality and to ensure these coaches knew the science of reading and adult learning theory. I wanted to guarantee all teachers that those who would be working side by side with them in their classrooms were of the highest quality and would be able to build their capacity to teach students how to read.”

I think this approach mattered for three reasons:

  1. It supported role clarity. Coaches’ job descriptions were established centrally; there was no differentiation of focus. The state created a mechanism to ensure that the reading coaches did not get pulled into “other duties, as assigned.”
  2. It allowed for a clear standard for hiring and performance management. Having a small, central team conduct all hiring ensured that the same standard was used to evaluate applicants and manage performance over time.
  3. It made it possible for the state to provide training and support. Knowing exactly what the coaches were going to do made it possible for the state to train the coaches and provide real-time professional learning.

There were two conditions that Mississippi leaders, in a right-to-work state, could count on when they designed this strategy that leaders in other states may not be able to. Mississippi leaders knew that:

  1. Coaches would be able to conduct informal observations and provide feedback to all teachers without a required invitation in.
  2. Coaches would be able to direct the use of planning time.

Many collective bargaining agreements don’t make those conditions assumable.

In hiring coaches directly, Mississippi mitigated the risk of a problem we don’t talk about enough in education: lack of role clarity. In most states, districts and schools determine the structure and focus of roles. This allows leaders to be flexible and adapt to style and hyper-local context, but it also results in wide variation in clarity and focus. The variation can lead to blurriness about where time should be spent and make it harder for leaders to provide support, accountability, and clear pipelines for preparation for new roles.

Mississippi leaders found a way to address role clarity without changing governance. Even in a state that is all about local control, they made sure the people close to teachers were clear on what they were expected to do and able to spend the time on those activities. 

As state leaders consider how to respond to declining reading results on NAEP, I think moves like this that support clear role clarity for those providing support to teachers are worth considering.

Editor’s note: This was first published in an email newsletter from Emily Freitag in her role as CEO of Instruction Partners. You can subscribe here.

view
AI pilot project in Nigeria SR image

Artificial intelligence in English-language instruction: Looking at a pilot project from Nigeria

Jeff Murray
2.18.2025
Ohio Gadfly Daily

While many fret over the proliferation of artificial intelligence (AI), the jury is still out regarding its benefits and drawbacks for K–12 education, and researchers are trying to catch up to the rapidly-expanding technology. The latest of two recent articles on the topic from the World Bank examines one education-related AI project in Africa.

In June and July 2024, 800 first-year students in senior secondary school in Nigeria (ages 16-17) were randomly assigned to attend after-school English classes in computer labs twice a week. Each session began with the teacher introducing the new weekly topic, followed by students interacting with the well-known Copilot generative AI tool from Microsoft, powered by ChatGPT. Teachers guided and mentored students throughout each session, which dealt with both grammar and writing tasks in English. Teachers also led brief reflection exercises at the end of each session. Importantly, a control group of students from the same schools who were not selected for the AI-powered sessions were also followed, although the articles discussing the intervention are light on details. (A proper report is promised soon, but until then, a video gives further detail on what the project looked like in practice.) After the six-week session, all students took a pen-and-paper test to assess their performance in three areas: English language skills, AI knowledge, and digital skills.

Students who participated in the AI-assisted classes performed better on their final tests to the tune of a statistically-significant 0.3 standard deviations. This is equivalent to nearly two years of typical learning in just six weeks. Compared to a database of other RCT education interventions conducted in the developing world, analysts say the AI intervention outperformed 80 percent of them. These include some widespread strategies like structured pedagogy and teaching at the right level. However, we don’t yet have a breakdown of how students did on the three individual parts of the test so it will be important to see the difference between English skills and the technological topics. Benefits accrued to all participating students, not just the highest achievers. And female students—whose success is an ongoing concern in African education—gained more compared to males. Attendance mattered greatly to the impacts, with every additional day of attendance resulting in statistically-significant improvements in learning outcomes. This is important, as attendance was inconsistent for many students due to factors beyond their control (family, weather, etc.). Making such classes fully virtual would reduce this concern, but home/community internet access would likely need to be addressed.

An earlier article published in September briefly describes seven takeaways from the same AI pilot project. On the upside, both students and teachers were highly engaged and reported wishing they had had even more time with the technology. (The introductory sessions were necessarily spent on housekeeping and training on the basics.) Teachers also reported a greater ability to immerse students in the English language using AI rather than other online (or written) resources. On the downside, teachers reported instances of hallucination (AI tools generating false responses and presenting them as facts) and student misuse of the technology, as well as the aforementioned attendance problems.

There’s a whole lot more we need to know about this experiment and others like it before any conclusions can be made beyond “this seems promising.” What kind of instruction did control group students get? How much human intervention is required to minimize AI problems and maximize student benefits? What kind of costs are required to reach the highest number of students? Are there other options besides Copilot that could work better? Until then, we remain at the “experts think” phase of technological innovation, sprinkled with a soupçon of “cautious optimism.”

SOURCE: Martín E. De Simone et al., “From chalkboards to chatbots in Nigeria: 7 lessons to pioneer generative AI for education,” World Bank blogs (September 2024).

SOURCE: Martín E. De Simone et al., “From chalkboards to chatbots in Nigeria: Transforming learning in Nigeria, one prompt at a time,” World Bank blogs (January 2025).

view
School building

The state of pandemic learning loss recovery

Jeff Murray
2.20.2025
Flypaper

The third iteration of the Education Recovery Scorecard, compiled by Harvard’s Center for Education Policy Research, was released hot on the heels of 2024 NAEP test scores and is an invaluable supplement to that dismal data. The Scorecard is specifically looking for evidence of recovery from pandemic learning loss at the district level and—unfortunately—does not find much.

To get a picture of how schools are or are not bouncing back, the Center uses score results from NAEP math and reading exams, plus state assessments administered to roughly 35 million fourth- and eighth-grade students across forty-three states in 2019, 2022, and 2024. The analysts then connect these data to findings from their previous report on federal pandemic relief funding and national data on chronic student absenteeism (gathered by AEI’s Nat Malkus) to see how each has impacted those recovery goals.

The 74’s Kevin Mahnken sums up the scorecard’s findings most starkly: “More than five years after the first appearance of Covid-19 on American shores, 94 percent of elementary and middle schoolers live in districts that still have not returned to pre-pandemic levels in math and reading.” Overall, students have fallen further behind than where they were in 2022 and the average student today is still six months behind in both core subject compared with children in the same grades in 2019.

These negative findings are more pronounced in districts serving higher proportions of lower-income and racial/ethnic minority students. In math, for example, the disparity in scores between students in affluent and low-income districts has grown by 11 percent since the start of the pandemic, and the disparity in scores between students in predominantly non-minority versus minority districts has grown by 15 percent. Even within districts, the average racial/ethnic disparities in math scores have grown by 7 to 12 percent since 2019. That is, even the small pockets of positive growth observed are in higher-income and majority-white districts. The same gaps have grown in reading, as well, but not by quite as much.

As to funding, each dollar of federal relief was shown to improve student achievement by about as much as a general revenue increase—approximately 0.008 of a standard deviation per $1,000 spent. And while that is precious little bang for the buck, the analysts are sure that outcomes would have been far worse without it. It is also clear that what districts bought with the money mattered even more than the amount. In California, where the most-detailed expenditure data were available, student achievement grew more in districts that spent their funds on academic interventions, such as tutoring or summer school, versus districts that spent on more general items like staffing or facilities.

Chronic absenteeism, predictably, exerted a drag on student achievement, although the correlation was less direct. While AEI’s data show the chronic absenteeism rate has declined from its peak in 2022, it remains 8 percentage points higher than immediately before the pandemic. The rise in absenteeism was widespread, occurring in both high- and low-income districts. However, the increases were larger in low-income, high-poverty districts and in districts which had high absenteeism rates before the pandemic.

Fortunately, it’s not all gloom and doom. The data show that there are over 100 school districts that have fully recovered from pandemic learning loss. The analysts took an in-depth look at several of them, including Ector County, Texas (where leaders used $7 million to reward outstanding teachers for becoming “master teachers” and showing improvements in student learning), and Natchitoches Parish School District in Louisiana (where leaders replaced ineffective curricula with a science of reading-based program and retooled their instruction weekly based on student testing data). None of this means that these districts are necessarily doing everything right, of course, but getting back to square one is a prerequisite for any further improvement. Those that have done so should be examined and lauded.

The scorecard report concludes by highlighting four priority items that could help more districts, schools, and students recover from Covid learning loss. These are (1) continuing to fund—by any means necessary—proven, high-quality academic catch up efforts that now-exhausted federal funding kickstarted; (2) making a full-court press to reduce chronic absenteeism, specifically by enlisting local leaders, employers, and community members in the effort; (3) consistently and clearly informing parents about their child’s progress (or lack thereof) toward on-grade-level achievement and offering easy access to any available remediation programming; and (4) expanding reforms that are working, like the science of reading and high-quality curricula, to other states who have yet to join the party.

Millions of American students have graduated or otherwise left school since the coronavirus pandemic closed their school buildings five years ago. That damage is no longer the province of K–12 education to remediate. But millions more are still here, and their sisters and brothers are coming up behind. We owe them nothing less than to learn from past mistakes, end the harm, and commit every resource to actively repairing their educational paths and launching them to further and better academic achievement.

SOURCE: Daniel C. Dewey et al., “Education Recovery Scorecard: Pivoting from Pandemic Recovery to Long-Term Reform,” Center for Education Policy Research (February 2025).

view
flag with books

#957: DOGE, IES, and the future of education research

2.19.2025
Podcast
 

On this week’s Education Gadfly Show podcast, Mike and David discuss what’s really going on with DOGE, including its cuts to IES research grants and the implications for education policy. Then, on the Research Minute, Amber highlights a study on whether the Core Knowledge curriculum helped strengthen kindergarteners’ vocabulary and knowledge.

Recommended content:

  • Chester E. Finn, Jr., “Easy, DOGE. IES matters.,” Thomas B. Fordham Institute (February 11, 2025).
  • Robert Pondiscio, “Culture war vs. competence: Why conservatives should support Penny Schwinn,” Thomas B. Fordham Institute (February 6, 2025).
  • Chester E. Finn, Jr., “Trump should stay out of what students learn in school,” Thomas B. Fordham Institute (January 30, 2025).
  • Sonia Q. Cabell, James S. Kim, Thomas G. White, Charles J. Gale, Ashley A. Edwards, HyeJin Hwang, Yaacov Petscher, and Rhonda M. Raines, Impact of a Content-Rich Literacy Curriculum on Kindergarteners’ Vocabulary, Listening Comprehension, and Content Knowledge, Journal of Educational Psychology (2024)

Feedback Welcome: Have ideas for improving our podcast? Send them to Stephanie Distler at [email protected].

view
Fordham Gadfly image

Cheers and Jeers: February 20, 2025

The Education Gadfly
2.20.2025
Flypaper

Cheers

  • Virginia’s new accountability model provides parents with clearer, more timely academic data to bridge the gap between report cards and actual student performance. —Bibb Hubbard and Cindi Williams, The 74
  • Utah’s Governor Cox signed a collective bargaining ban that applies to all public sector employees, including teachers. —AP News
  • As reading habits decline and students increasingly consume fragmented digital content, schools must continue to prioritize the experience of reading entire books, which can cultivate empathy, discipline, and nuanced understanding.  —Tim Donahue, The New York Times
  • National Math Stars ensures that talent is nurtured early—especially among underserved communities—by offering financial assistance for advanced math programs and STEM activities. —The 74

Jeers

  • The Maryland Education Association’s demands are bankrupting the state, argues a former Democratic state senator. —FOX Baltimore
  • The Department of Education canceled 89 contracts worth $881 million for education research projects, which researchers argue will lead to the loss of valuable data and hinder future assessments of student progress.  —Jill Barshay, Hechinger Report
view
Fordham Gadfly image

What we’re reading this week: February 20, 2025

The Education Gadfly
2.20.2025
Flypaper
  • “The bad new bipartisan consensus behind falling test scores.” —Matthew Yglesias, Slow Boring
  • A Massachusetts high school’s partnership with a trade union provides students with hands-on experience and pathways to union apprenticeships, addressing the skilled labor shortage while promoting inclusivity in the construction industry. —Hechinger Report
  • Despite its benefits, over-reliance on AI can lead to cognitive decline by diminishing critical thinking skills and fostering dependency, particularly among younger users.  —Erik Hoel, The Intrinsic Perspective
  • Voters across three states carried on a 50-year trend by rejecting private school choice at the ballot box last year, with concerns about public school funding transcending partisanship, despite stronger urban and minority support for vouchers. —Parker Baxter, Michael Hartney, and Vladimir Kogan, Education Next
Fordham Logo

© 2026 The Thomas B. Fordham Institute
Privacy Policy
Usage Agreement

National

P.O. Box 110
Burke, VA 22009

202.223.5452

[email protected]

Ohio

P.O. Box 82291
Columbus, OH 43202

614.223.1580

[email protected]

Sponsorship

130 West Second Street, Suite 410
Dayton, Ohio 45402

937.227.3368

[email protected]