Mobile Navigation

  • National
    • Policy
      • High Expectations
      • Quality Choices
      • Personalized Pathways
    • Research
    • Commentary
      • Gadfly Newsletter
      • Flypaper Blog
    • Events
    • Scholars Program
  • Ohio
    • Policy
      • Priorities
      • Media & Testimony
    • Research
    • Commentary
      • Ohio Education Gadfly Biweekly
      • Ohio Gadfly Daily
  • Charter Authorizing
    • Application
    • Sponsored Schools
    • Resources
  • About
    • Mission
    • Board
    • Staff
    • Career
Home
Home
Advancing Educational Excellence

Main Navigation

  • National
  • Ohio
  • Charter Authorizing
  • About

National Menu

  • Topics
    • Accountability & Testing
    • Advanced Education
    • Career & Technical Education
    • Charter Schools
    • Curriculum & Instruction
    • ESSA
    • Evidence-Based Learning
    • Facilities
    • Governance
    • Personalized Learning
    • Private School Choice
    • School Finance
    • Standards
    • Teachers & School Leaders
    • Think Again
  • Research
  • Commentary
    • Gadfly Newsletter
    • Flypaper Blog
    • Gadfly Podcast
  • Events
  • Scholars Program

The Education Gadfly Weekly

Sign Up to Receive Fordham Updates

We'll send you quality research, commentary, analysis, and news on the education issues you care about.
Thank you for signing up!
Please check your email to confirm the subscription.

The Education Gadfly Weekly: America’s recent education declines in international context

Volume 23, Number 36
9.7.2023
9.7.2023

The Education Gadfly Weekly: America’s recent education declines in international context

Volume 23, Number 36
view
High Expectations

America’s recent education declines in international context

America’s recent achievement declines are far from unique. Consider, for example, Chile, whose academic progress, as measured by international assessments, also stalled out in the early to mid-2010s, just like ours did. And which is also facing a teenage mental health crisis, much like we are, as well as rising violence and disorder in and around their campuses. Are these worldwide phenomena?

Michael J. Petrilli 9.7.2023
NationalFlypaper

America’s recent education declines in international context

Michael J. Petrilli
9.7.2023
Flypaper

Grade inflation is not a victimless crime

Frederick M. Hess
9.7.2023
Flypaper

Chronic absenteeism has become a crisis, part 1: Possible causes

Tim Daly
9.7.2023
Flypaper

Are college completion grants a no-incentive incentive?

Jeff Murray
9.5.2023
Ohio Gadfly Daily

Cheers and Jeers: September 7, 2023

The Education Gadfly
9.7.2023
Flypaper

What we're reading this week: September 7, 2023

The Education Gadfly
9.7.2023
Flypaper
view

Grade inflation is not a victimless crime

Frederick M. Hess 9.7.2023
Flypaper
view
desk

Chronic absenteeism has become a crisis, part 1: Possible causes

Tim Daly 9.7.2023
Flypaper
view
Completion grants for college SR image

Are college completion grants a no-incentive incentive?

Jeff Murray 9.5.2023
Ohio Gadfly Daily

view

Cheers and Jeers: September 7, 2023

The Education Gadfly 9.7.2023
Flypaper
view

What we're reading this week: September 7, 2023

The Education Gadfly 9.7.2023
Flypaper
view

America’s recent education declines in international context

Michael J. Petrilli
9.7.2023
Flypaper

Last month, I had the good fortune to travel to Santiago, Chile, to speak at a fantastic education conference organized by a leading think tank (LYD) and university (UDD). I was the latest in a long line of education policy wonks to make the trek to this annual event, including Eric Hanushek, Harry Patrinos, Steven Rivkin, and Paul Peterson.

In line with the old cliché about travel, while there I learned as much about America’s education system as I did about Chile’s. The most important lesson was that our recent achievement declines—much discussed at August’s Republican debate, and which, as gauged by test score trends, started almost a decade before Covid struck—are far from unique.

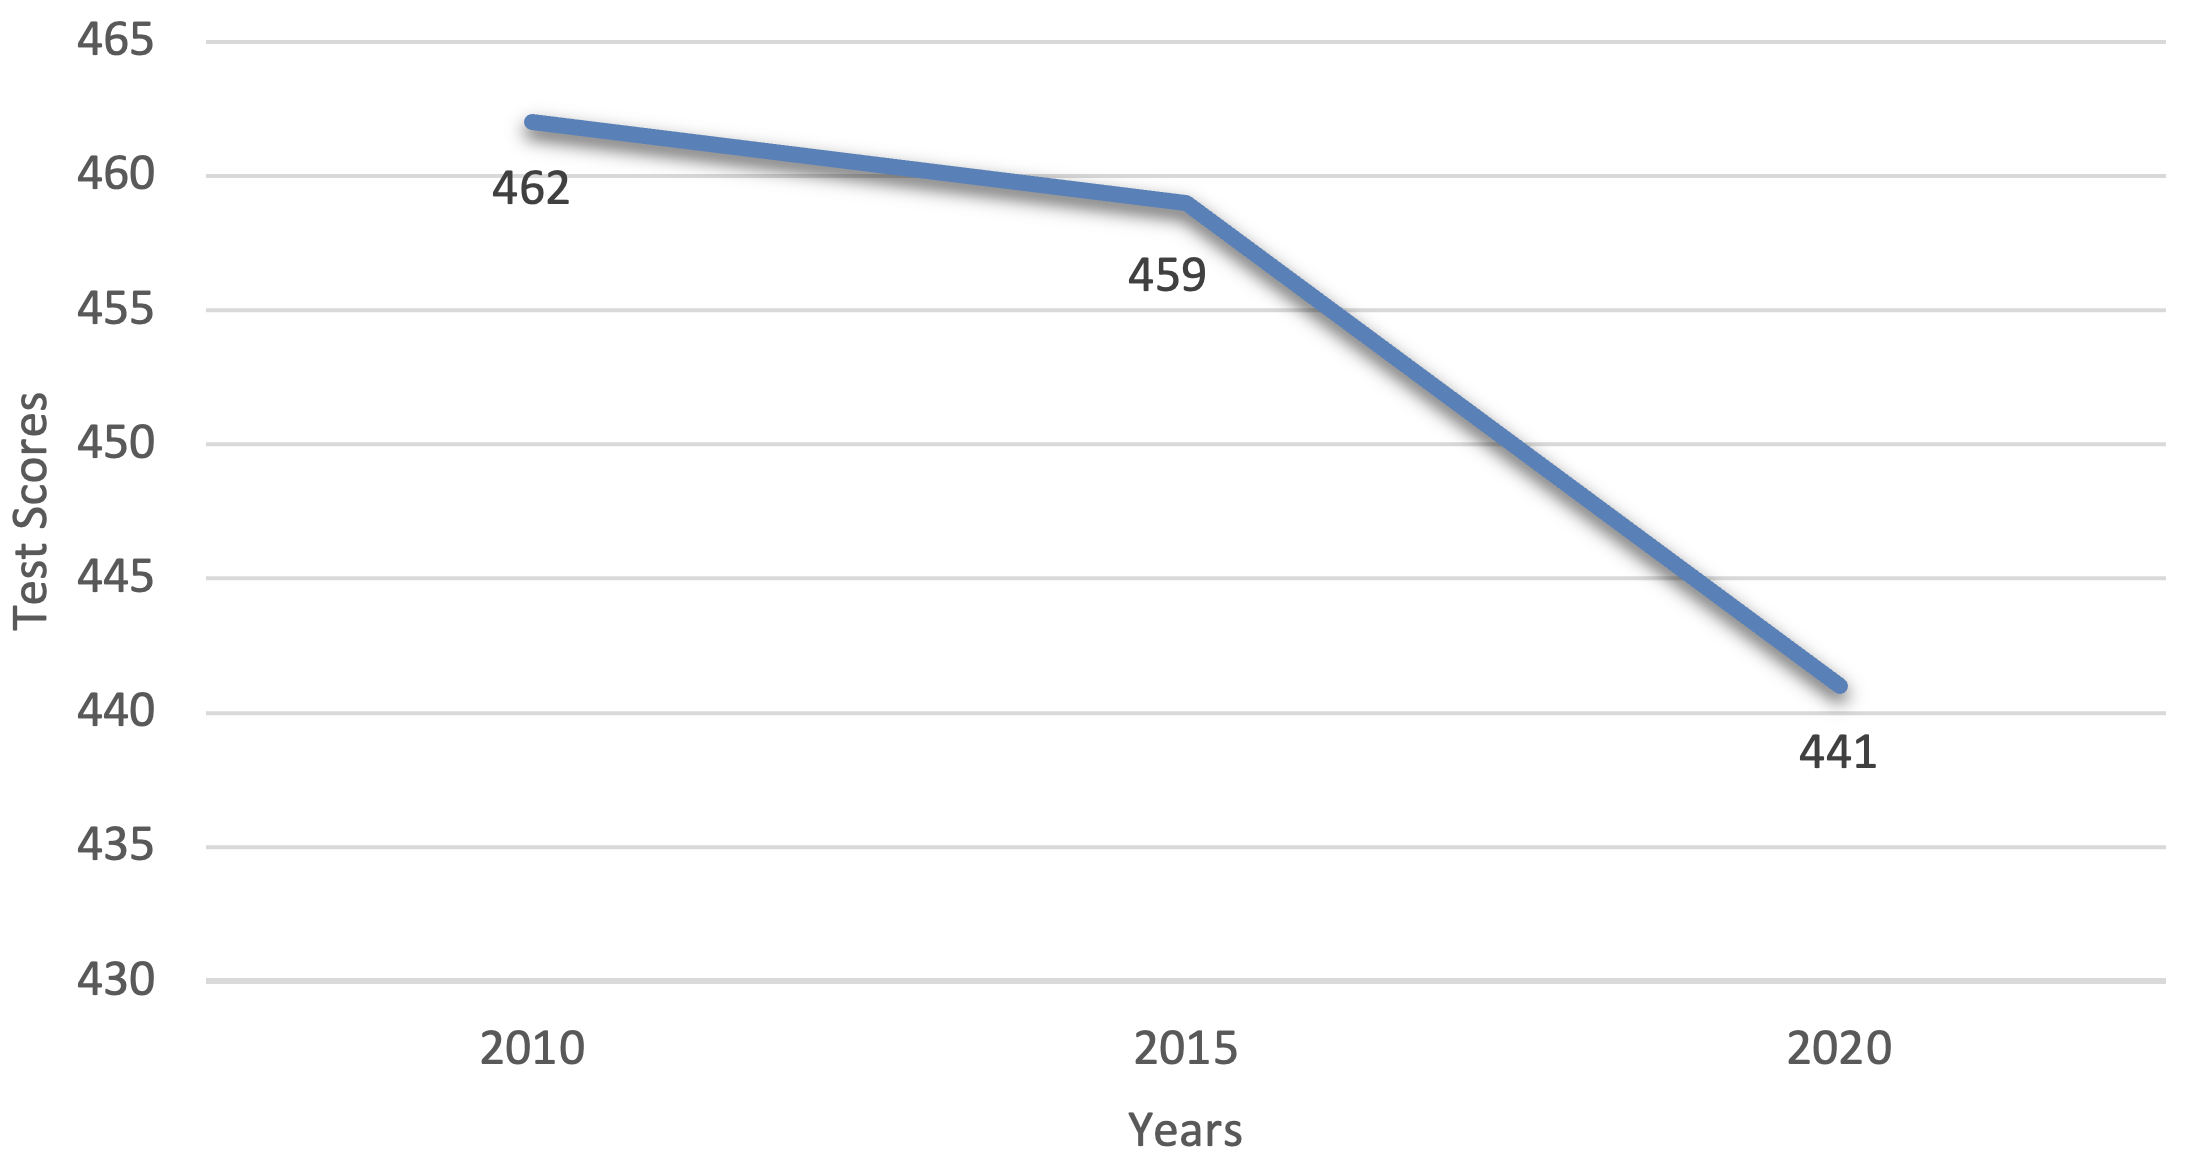
Chile’s academic progress, as measured by international assessments, also stalled out in the early to mid-2010s, just like ours did. Note, for example, their downward trends in fourth grade math on the Trends in Mathematics and Science Study (TIMSS). 

Figure 1: Chile’s fourth grade math average scores on TIMSS, 2011–19
f1

Chilean schools also face a teenage mental health crisis, much like we do, as well as rising violence and disorder in and around their campuses.

The mental health trends did not surprise me, given the important work that Jonathan Haidt and Jean Twenge, among others, have done to track the rise of teenage anxiety and depression around the globe and their potential connection to the widespread adoption of smartphones and social media starting around 2012.

But achievement, too? That made me curious. Were other also countries seeing a similar slowdown or decline in test scores in the pre-pandemic years?

Getting a straight answer to that question is hard, as there’s no “global achievement trend” to point to. That’s because, even with the growth and durability of international assessments such as TIMSS, PISA, and PIRLS, there’s not a large and stable group of countries that have taken the same tests over a long period of time. Four scholars (Noam Angrist, Harry Patrinos, Simeon Djankov, and Pinelopi Goldberg) tried to overcome this challenge in an important article published by Education Next last year by linking international exams to those given regionally. Their result was plenty sobering: There’s little evidence of learning gains worldwide from 2000 to 2015.

Another approach is to select a group of nations and examine their own trend lines. But which countries would serve as the most appropriate comparison? Seems to me that the G7, representing the world’s large, advanced democracies, is as good as any. That means Canada, France, Germany, Italy, Japan and the United Kingdom, as well as the U.S. We’ll substitute Ontario for Canada and England for the U.K., as these jurisdictions have participated in international exams for much longer. Sadly, France’s and Germany’s participation has been spotty.

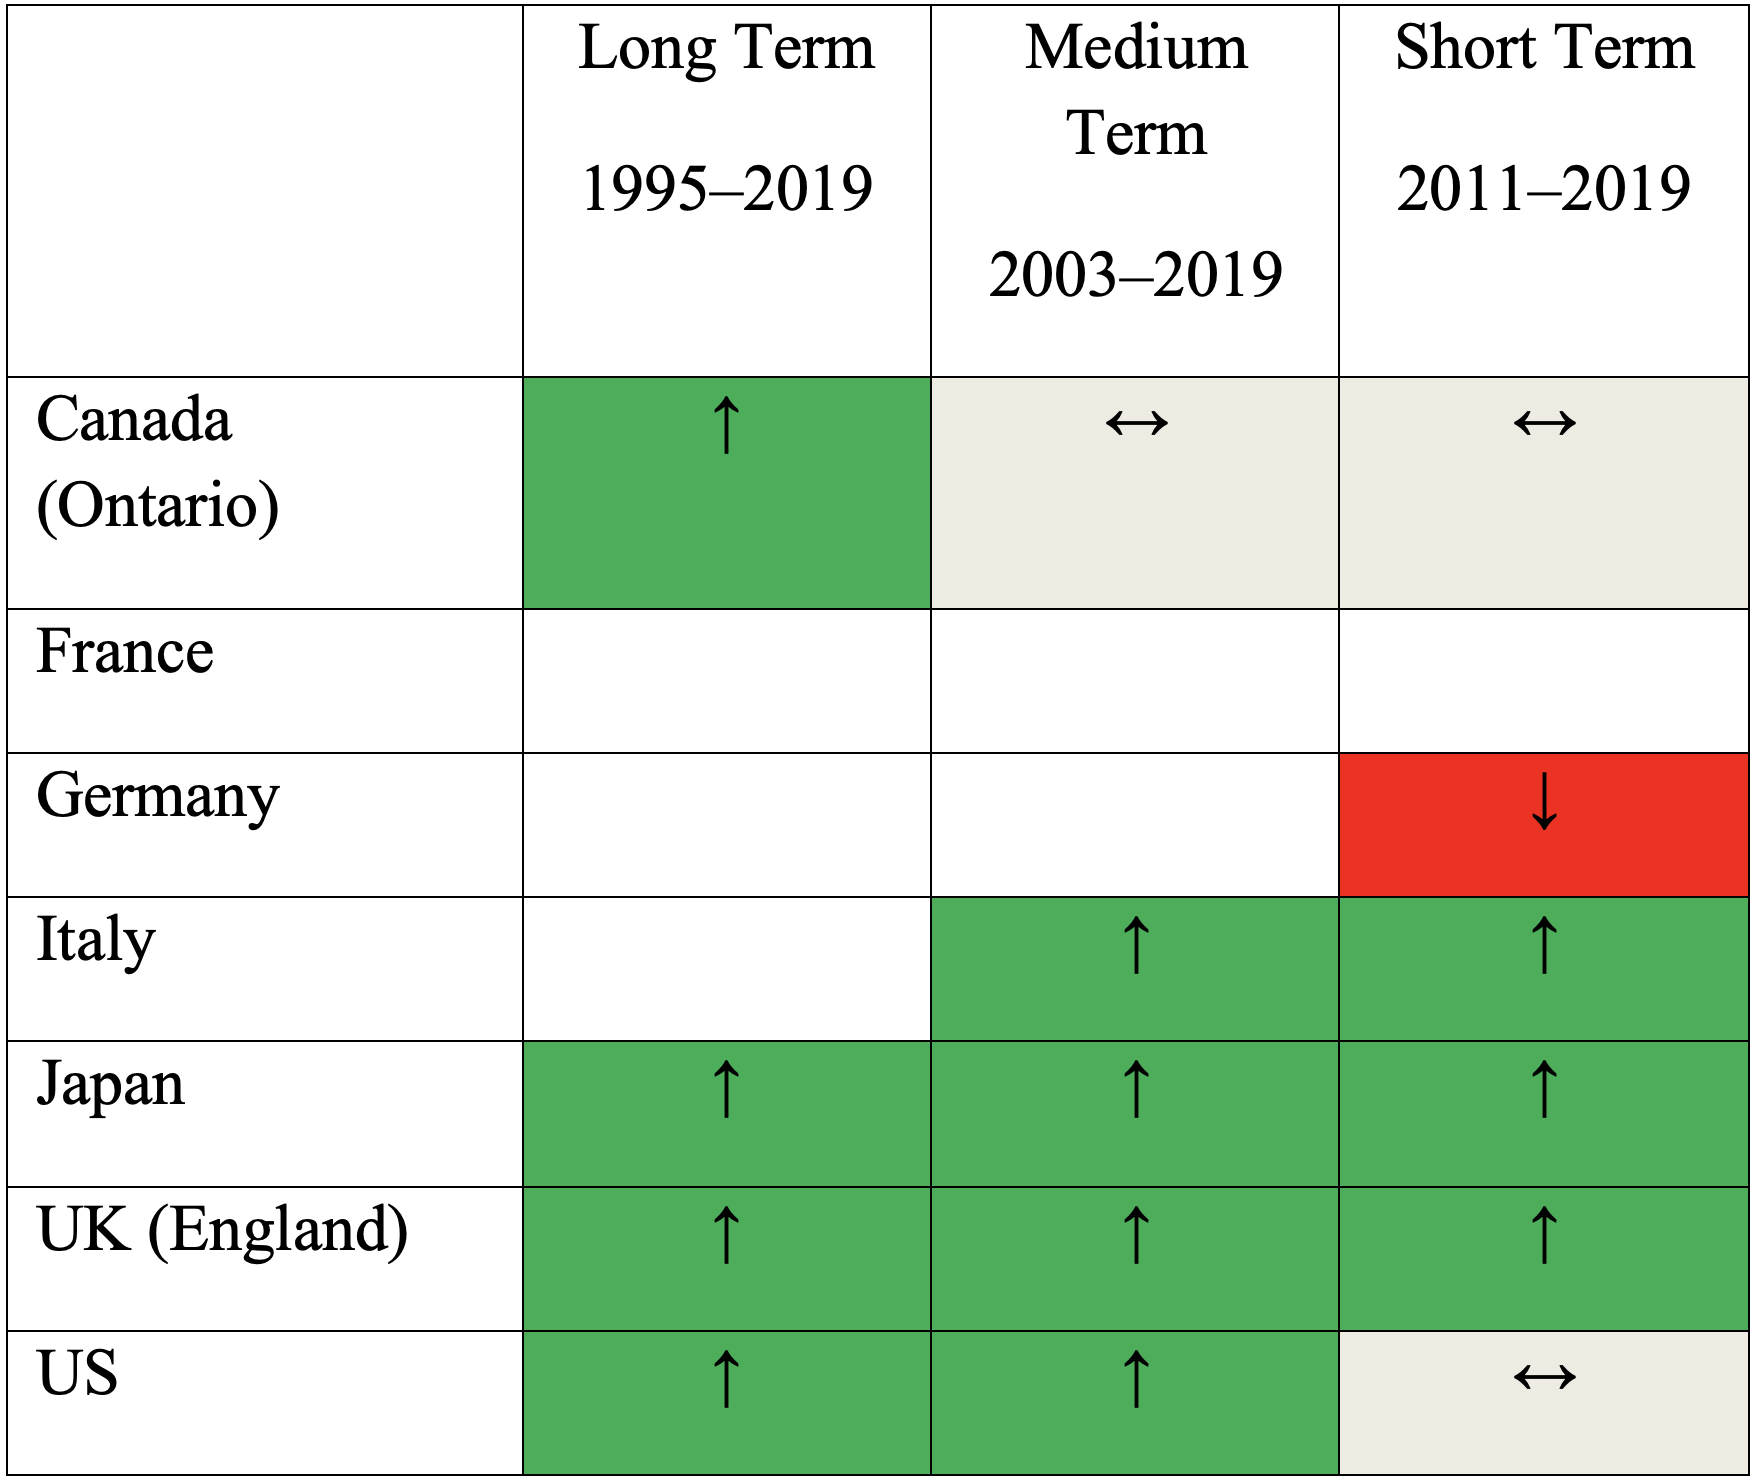
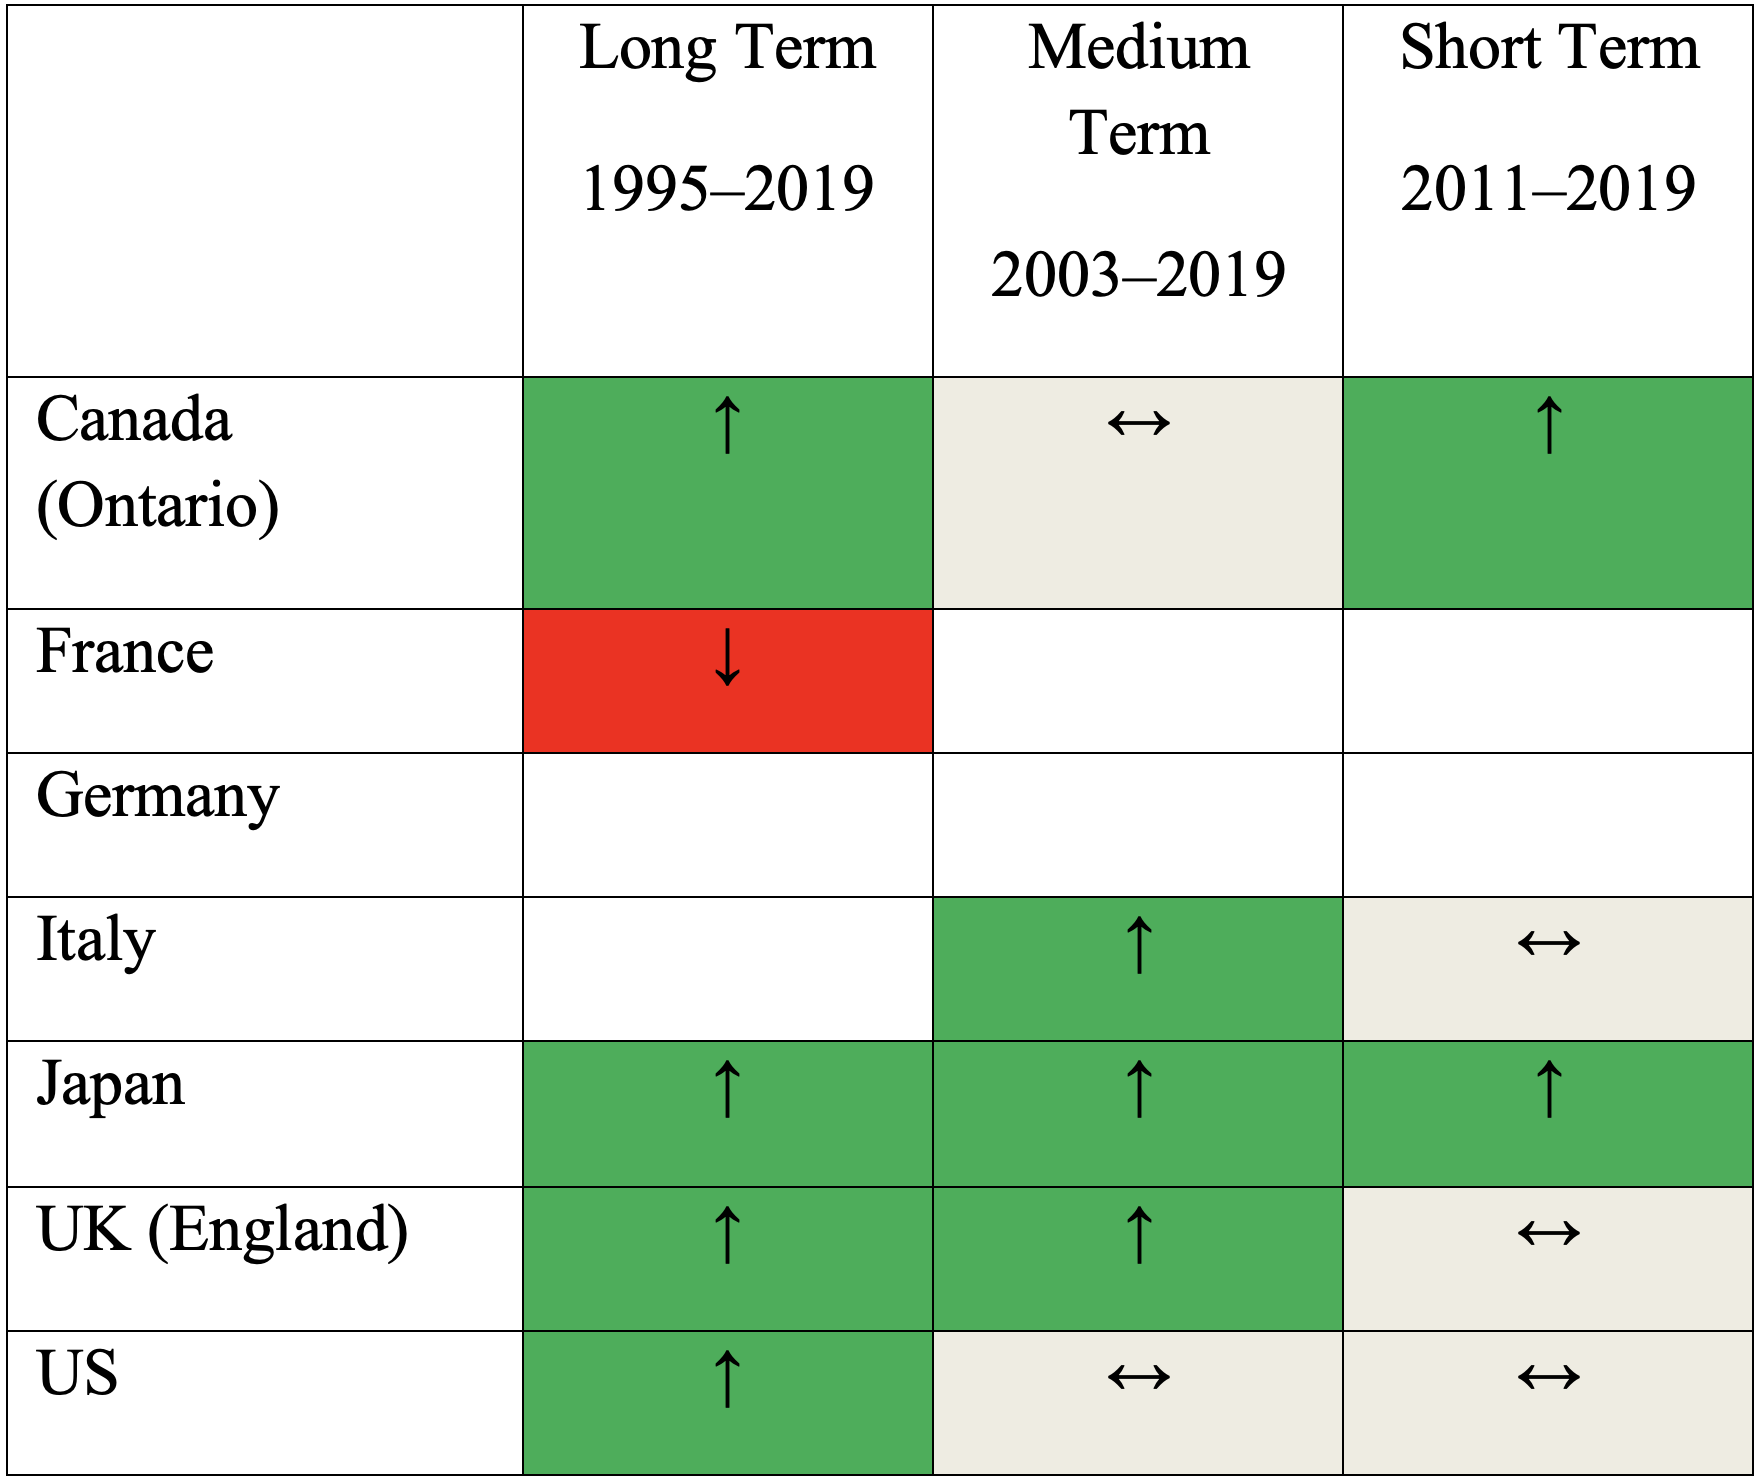
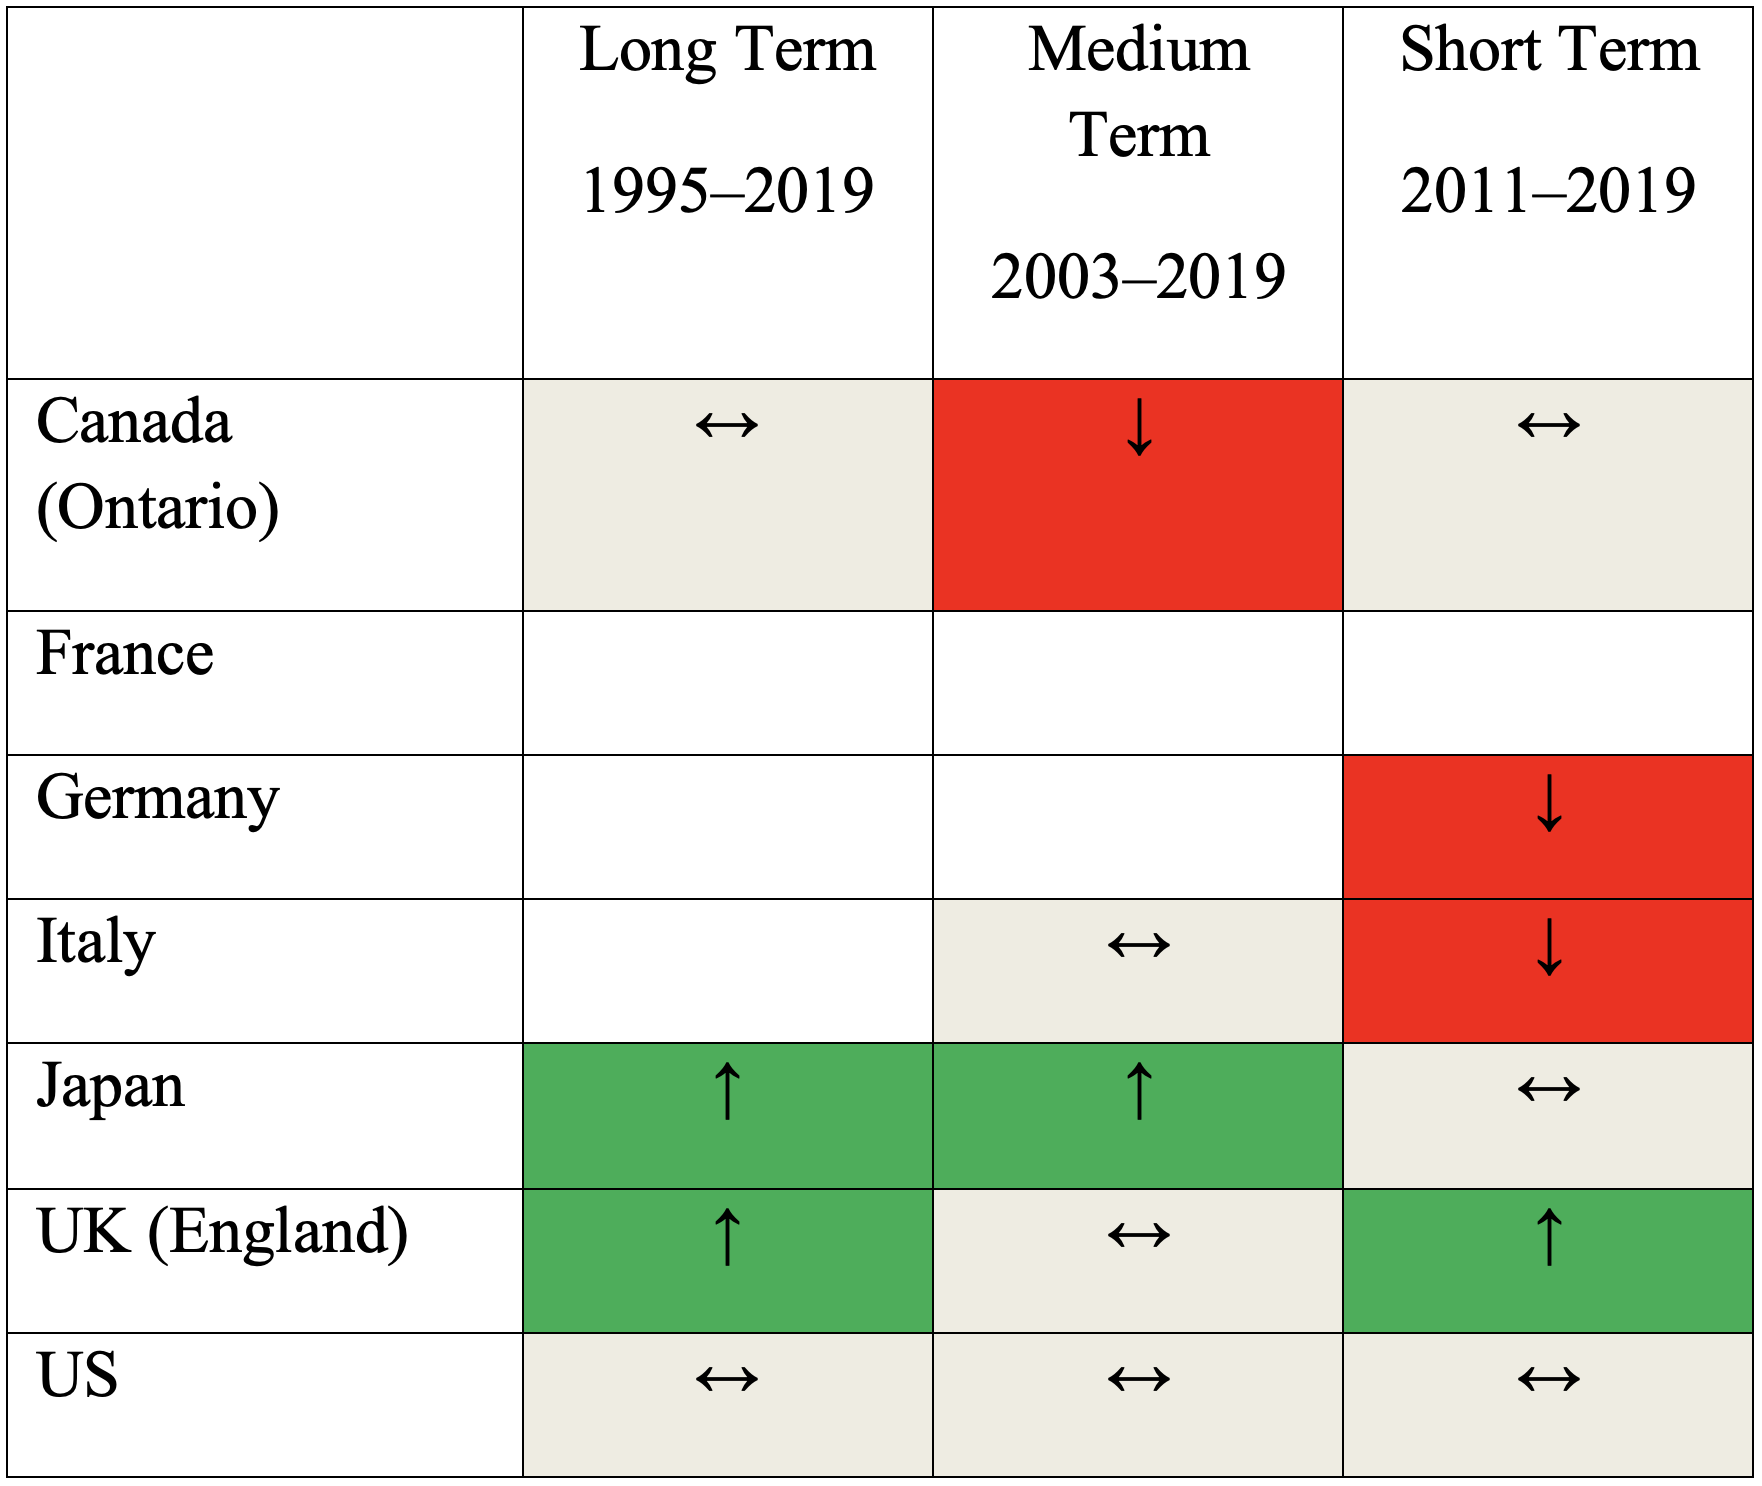
Let’s take a look at the long-, medium-, and short-term trends on TIMSS—which people I trust view as more reliable than PISA—for the G7 nations.

Table 1: TIMSS fourth grade math trends for the G7 nations
t1

Table 2: TIMSS eighth grade math trends for the G7 nations
t2

Table 3: TIMSS fourth grade science trends for the G7 nations
t3

Table 4: TIMSS eighth grade science trends for the G7 nations
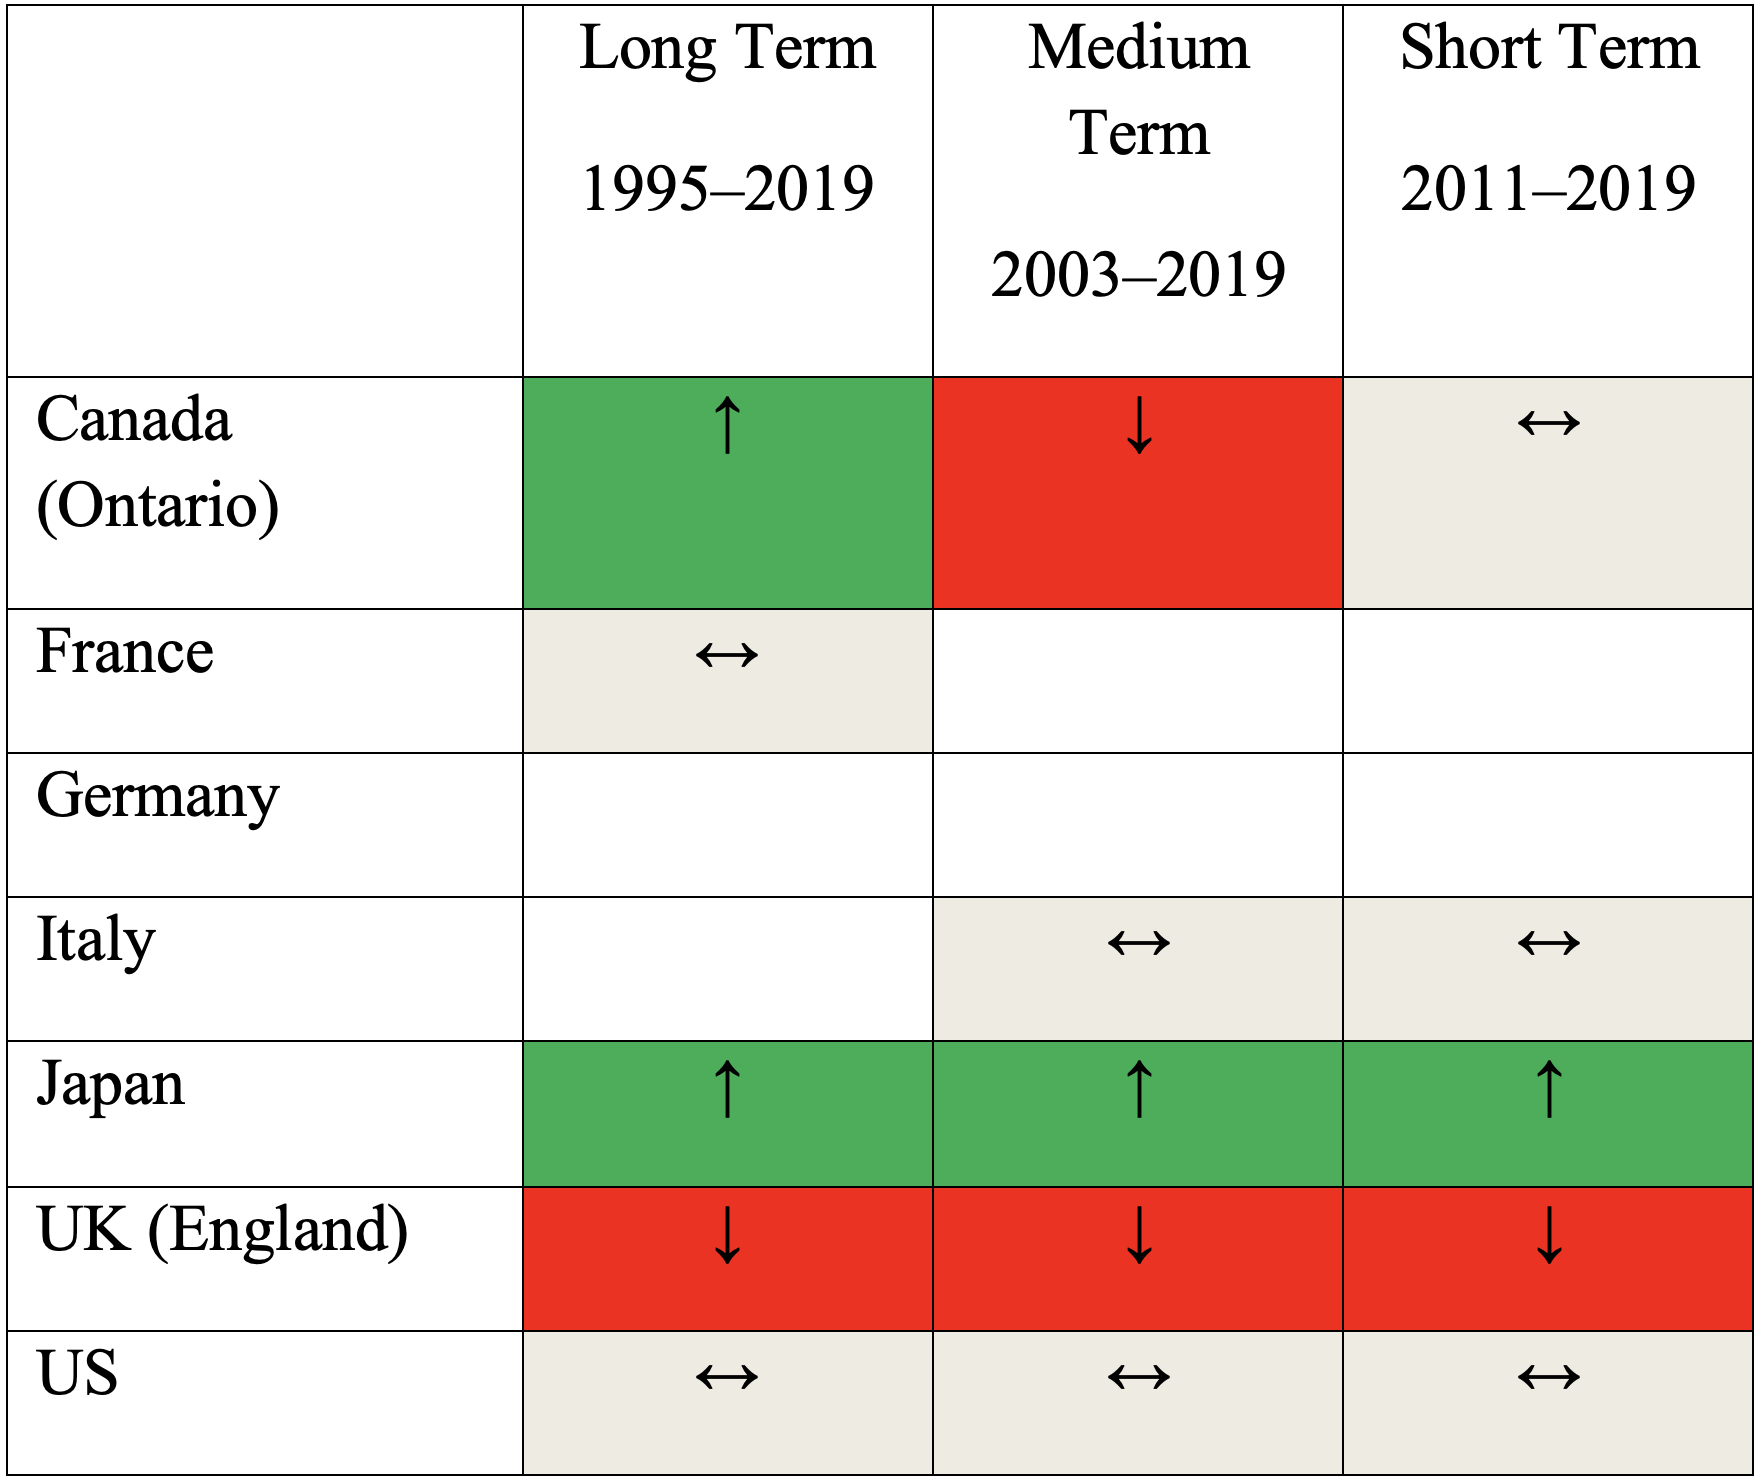
t4

To be honest, I’m not seeing many, if any, patterns here. Perhaps, if you squint, you can spot a more negative story, in general, for the most recent period, with trends more likely to turn flat or down. (America’s have turned flat, though we see actual declines in some NAEP data.)

It’s also possible to find other countries whose trajectories look similar to ours. Most notably Canada (represented here by Ontario), whose better days, like America’s, tended to be back in the late 1990s or early to mid-2000s. We don’t have much data for Germany, but it has struggled of late, too.

But Italy, England, and especially Japan have demonstrated a striking ability, in most grades and subjects, to continue to make progress, all the way through 2019. (We’ll get post-pandemic scores—for 2022—soon.)

So the most straightforward take is that it’s a mixed bag.

What to make of these “null” findings? In my view, they provide important context for our understanding of America’s achievement trends. There’s been a vigorous debate, on social media at least, about why our achievement gains stalled out in the early to mid-2010s. (As another recent analysis of TIMSS demonstrated, that stalling out was driven by declines for our lowest-achieving students. A widening gap between America’s low and high achievers in the 2010s is a consistent finding across international exams and NAEP.) Sandy Kress, one of the architects of No Child Left Behind, argues that it’s because we stopped enforcing that law and gave up on holding schools accountable. It’s not a crazy notion, for the timing lines up quite well and we really did stop threatening schools with takeovers and shut downs around that time.

Building off the research of Kirabo Jackson, among others, I’ve pointed to a different culprit. Namely, the Great Recession, which threw millions of children into poverty, and in America, at least, led to significant cuts in education spending, especially in the very schools where we saw the greatest achievement declines.

But the Great Recession was a worldwide phenomenon, so why didn’t it have a similarly destructive impact on other systems around the globe? How did England and Japan, in particular, weather the storm so well? Was it their more robust social safety nets or school funding systems? Or is the Great Recession a red herring?

And what about those darn smartphones? I’ve wondered lately whether they could be curtailing student learning in addition to harming kids’ mental health. It’s not hard to imagine that increased screen time, in combination with dopamine-releasing social media apps, could negatively impact attention, sleep, and so much else that’s critical to success in school. But again, smartphones are ubiquitous across the G7, too, and there’s no sign that students in, say, Japan are being handicapped by them.

In a way, it’s a relief to know that America’s achievement woes aren’t in lock-step with broader trends from around the world. It means that our (pre-pandemic) declines were the result of something that we were doing (or not). And that means we alone can fix it. 

view

Grade inflation is not a victimless crime

Frederick M. Hess
9.7.2023
Flypaper

Editor’s note: This was first published by Forbes.

America’s high schools have just endured a decade of dramatic grade inflation, according to a new study from ACT. This coincided with a decade of declining academic achievement, raising hard questions for those concerned about instructional rigor, inflated graduation rates, and the integrity of selective college admissions.

Between 2010 and 2022, there was evidence of steady grade inflation among high schoolers. During that period, even as the National Assessment of Educational Progress (the “Nation’s Report Card”) recorded steady declines in reading, math, and U.S. history achievement, student GPAs climbed steadily higher. The average adjusted GPA increased from 3.17 to 3.39 in English; from 3.02 to 3.32 in math; from 3.28 to 3.46 in social studies; and from 3.12 to 3.36 in science. In 2022, more than 89 percent of high schoolers received an A or a B in math, English, social studies, and science.

At a time when schools are struggling to combat pandemic learning loss and graduation rates have climbed to historic highs, there are unfortunate consequences when educators essentially give every student an A or a B. Easy A’s signal to students they don’t need to work hard to succeed, give parents a false sense of how their kids are doing, and allow students to graduate without essential knowledge or skills. They also undermine learning, as researchers at Brown University and the Thomas B. Fordham Institute have found that students appear to learn more from teachers who are tough graders.

This is hardly the first time we’ve seen evidence of grade inflation. These results reinforce a decades-long trend. For instance, the 2019 National Assessment of Educational Progress High School Transcript Study, issued by the National Center of Education Statistics, found that America’s students were getting better grades and (putatively) taking more rigorous classes than students a decade before, but actually learned less.

In 2009, Mark Schneider, currently the director of the federal Institute of Education Sciences, found that the share of students completing algebra II grew one-third between 1978 and 200 and that average math GPAs rose markedly between 1990 and 2005 and, yet, student test performance in algebra I, geometry, and algebra II actually fell between 1978 and 2008. In short, impressive-sounding classes and rising grades masked a decline in student learning.

What’s driving this trend?

For one thing, a number of education leaders, advocates, and experts appear to be increasingly uncomfortable with traditional notions of rigor or grading. Indeed, the burgeoning push for “grading equity” (with districts eliminating the “zero”, eliminating penalties for late work, and allowing repeated re-tests) is premised on the belief that grades are often arbitrary or unfair. Author and speaker Cornelius Minor teaches, for instance, that one “cannot separate grading practices” from “the history of classism, sexism, racism, and ableism in the United States.”

Meanwhile, parents and students have become increasingly assertive over time, and many school leaders and educators have decided that it’s easier to appease them than to fight them. Just last month, Intelligent.com reported that 44 percent of educators say that students today often ask for better grades than they’ve earned. Four out of five educators say they’ve given into these demands, a reaction that’s easier to understand when one sees that 38 percent say they’ve been harassed by students (and 33 percent by parents) over grades.

What can we do about all this? There are at least four places to start.

First, it’s crucial to appreciate that grade inflation isn’t a victimless crime. It sends a false signal to students and families, making it tougher for educators to encourage students, acknowledge hard work, or give honest feedback. It can mean that selective college admissions become more about connections and game-playing than about earned opportunity.

Second, for teachers squeezed between helicopter parents and ideologues, it can be difficult to hold the line on high expectations. Education leaders who take their mission seriously need to recalibrate expectations, stand up for rigor, and support classroom teachers more, making clear that they regard runaway grade inflation as a problem.

Third, there’s a crucial role for states, which should ensure that graduates are mastering essential knowledge and skills. Issuing students meaningless diplomas isn’t doing anyone any favors. Accountability testing and graduation exams are good tools for keeping things in check.

Finally, colleges should take care to ensure they’re using credible measures of student preparation, which suggests a U-turn for all the schools that have ditched the SAT or ACT. Keep in mind that Harvard University’s Raj Chetty has reported that, contrary to the claims of anti-testing ideologues, selective colleges which embrace admissions testing are more likely to enroll low-income students than those which rely on grades, interviews, essays, and other similar inputs.

Grade inflation can feel like an abstract problem but it has real, troubling consequences for students, parents, and educators. We need to do better.

view
desk

Chronic absenteeism has become a crisis, part 1: Possible causes

Tim Daly
9.7.2023
Flypaper

Editor’s note: This was first published on the author’s Substack, The Education Daly.

One of the saddest legacies of the pandemic has been kids missing school. I’m not talking about what happened during the first Covid wave, beginning in March 2020, when schools nationwide were closed entirely and remained closed, in some cases, through the next school year.

I’m talking about right now.

Chronic absenteeism remains at an all-time high. A student is considered chronically absent when they miss 10 percent of school days in a given year. Based on a typical 180-day calendar, we’re talking eighteen days.

That’s a lot of absences. Perhaps you are old enough to remember America’s favorite Dean of Students, Edward R. Rooney, speaking to Ferris Bueller’s mother in the classic 1986 film, where he informs her that Ferris has been absent nine times in a semester. That equates to 18 per year. Chronic absenteeism requires missing school at a Ferris-level frequency.

According to a recent in-depth piece from the AP’s Bianca Vazquez Toness, 25 percent of American students were chronically absent in 2021–22, up from 15 percent prior to the pandemic, which is an additional 6.5 million kids. Let that sink in.

Absenteeism increased in all fifty states—urban, rural, large, small, everywhere. (Data for 2022–23 are just beginning to be reported by states, but the early indication is that numbers “remained persistently high.”)

My first question is: Why?

Participation in many other public activities is back to normal. Passengers are boarding airplanes in like it’s 2019. Music fans are flocking to concerts. Restaurants are packed.

Schools have fallen into that sad category with downtown office buildings, public transportation, and movie theaters—places that never recovered their foot traffic. While it’s widely accepted that these other sectors face existential threats that will force them to reinvent themselves or perish, no such urgency exists with attendance in school.

And that’s my second question: When are we going to start taking this crisis seriously?

In a three-part series, please join me in hurtling down the rabbit hole to see if we can find any answers. We’ll start by reviewing the various explanations that have been posited for the rise in chronic absenteeism and evaluating the plausibility of each one.

Next, in Part Two, we will look at how absenteeism affects kids of all backgrounds. If you are like me, you may come to this issue assuming that it’s mostly about low-income students—particularly in dense urban areas that were hard-hit by Covid—and the barriers to getting them back in class. You would be very wrong. As we will see, absenteeism has surged everywhere, including in some of the nation’s most affluent enclaves.

Finally, in Part Three, we will consider the best strategies for addressing the crisis, drawing on lessons from efforts to lure employees back to in-person work and best practices that have been used in the past to support students with issues of school avoidance.

—

This list is non-exhaustive. For each one, I’ll summarize the argument that’s been made and briefly assess its validity.

  • There’s less accountability for missing school. To reduce anxiety and to acknowledge barriers arising from the pandemic, some schools changed grading policies so students don’t automatically receive lower grades or fail to receive credit when missing a certain number of classes. Others determined that if kids submitted only a fraction of the assignments given, they would be graded only on those rather than the ones missed. There are schools that allow kids to get an excused absence for a “mental health day” without needing to see a health professional.

How strong is this explanation? These changes to student accountability have occurred at the school or district level. As the AP story (linked above) points out, chronic absenteeism rose in every state. It’s hard to believe that such ground-level policy changes were so widespread or influential that they were a primary driver in a nationwide surge in absences. Even so, we’re going to see later in this series that some schools believe lack of accountability for students is a fairly significant contributor to absenteeism and they are beginning to adjust their strategies accordingly.

  • Transportation is broken. Bus driver shortages are everywhere, leading to route changes and unreliable service. Pickups are missed. Kids never make it to school. Families are quicker to keep kids home now that they lack confidence that buses will deliver.

How strong is this explanation? There’s no question that busing in some districts is a mess. But most American students get to school by car, walking, or riding their bikes—not on buses. And once again, chronic absenteeism went up everywhere, not just cities where there aren’t enough bus drivers.

  • Social fabric frayed. Some students are motivated to attend school because they thrive on connecting with peers and educators. Covid interrupted those relationships profoundly, leaving kids isolated and anxious. Teacher turnover has been rampant, causing vacancies and reducing trust. A phone call from a teacher saying “I’d love to see you in class more often” might carry less weight. Older students can connect with their friends online without being at school.

How strong is this explanation? These themes come up frequently when families talk about why their kids are not making it to school—including in a recent piece from LAist. There is abundant evidence that the pandemic disrupted social patterns for young people in lasting ways. They find it harder to make friends and less appealing to spend time together in-person. Feels reasonable to conclude that this is a factor. And not one that schools can address easily.

  • In-person school feels outdated. Kids don’t see why they can’t work from home. Many professionals do. E-learning was validated to them as a legitimate modality. Resourceful students can engage with any topic they want on YouTube. When a day is missed, all the work is available online in real time, making it simple for a student to complete it all from home before the day is even done. Parents saw the low quality of instruction during remote learning and are not as worried about their kids missing some of it. Sitting in a desk for six hours a day is for suckers.

How strong is this explanation? Parents of high schoolers bring this up all the time. The inflexibility of school feels more and more out of step with the increasingly fluid nature of life elsewhere. One person told me his daughter comes out ahead when staying home because she can easily complete that day’s work and still have time left for other projects. But absenteeism is up for all grade levels, not just older students. Today’s first graders aren’t staying home because they feel they can knock out their coloring assignments online. However, there may be some overlap between this explanation and the social fabric one above. As we will discuss later in this series, parents are key to the absenteeism issue, and they have become readier to let their kids stay home.

  • Staying home is fun. Kids have devices in their hands that connect to streaming services and social media. The days of staring at network TV game shows and soap operas are long gone. Missing school equals hours of unregulated, appealing entertainment.

How strong is this explanation? Parents get uncomfortable when discussing this one because they sense blame coming their way. But we need to talk about it. An Australian researcher, commenting on new data showing a link between screen time and school avoidance, called it “the elephant in the room.” Being online means not having to deal with feelings or cope with social discomfort. School closures dramatically increased how much time kids spent on screens. It’s been very difficult to pare it back. Importantly, this explanation potentially addresses why we see so much absenteeism among early elementary students—because their increases in screen time have been alarming. Screen time went up everywhere, so did absenteeism. Hard to discount that.

  • Kids can’t go to school “a little bit sick” anymore. Working parents historically pushed the envelope when deciding whether that runny nose was a good enough reason to keep a child home. With heightened awareness of infection transmission, those same parents are getting shamed by school nurses (“Uh, can you come pick up your son, he’s coughing on everybody here in my office.”) A common cold now begets three days out of school.

How strong is this explanation? It deserves more consideration than it typically gets. Above, I mentioned the LAist piece that points to non-Covid illness as one of the three biggest causes of absenteeism in Los Angeles. Superintendent Alberto Carvalho says, “I think we need to overcome the pandemic mentality that any little sniffle should be addressed by keeping the child at home.” This is the exact opposite of what schools were telling families for a couple years. Good luck unwinding that messaging.

  • Kids are still getting Covid. The virus hasn’t gone away. When a child tests positive, they need to quarantine and that’s going to be a whole bunch of school absences, guaranteed. A single Covid case could push a student close to chronic absenteeism territory.

How strong is this explanation? The numbers aren’t there. Let’s consider Montgomery County Public Schools, a large and diverse district outside Washington, D.C. In 2022–23, only 7,659 students had Covid the entire year out of 180,702 enrollees. That same year, MCPS had 43,000 chronically absent students, which is 13,000 more than pre-Covid times. Further, students who test positive are required to remain out of school for five days—total days, not school days—and can return on the sixth if there are no symptoms. A single Covid case wouldn’t get the typical student anywhere near eighteen absences. Covid may be a non-trivial contributor to absenteeism, but it’s likely not the lion’s share of the story.

  • More parents can work remotely. Which means they can stay home with sick children instead of sending them to school.

How strong is this explanation? Might be a little bit of truth here. More professionals are working from home—especially women. It’s also true that moms take on the lion’s share of childcare responsibilities. But while remote employment is more common than it was pre-pandemic, the increase—from 24 percent of workers in 2018 to 34 percent now—isn’t nearly sufficient to account for the surge in school absences. Any effect here is probably marginal and tilted toward affluent families.

Whew. That’s a lot, I know. The bottom line is that explanations are flying all over the place.

—

Next week, in Part Two, we’ll move beyond the chatter to look closely at what’s happening on the ground—not just in urban areas but the suburbs. Surprises will abound.

view
Completion grants for college SR image

Are college completion grants a no-incentive incentive?

Jeff Murray
9.5.2023
Ohio Gadfly Daily

At the same time that the number of degree earners in the U.S. was increasing—from about 1.24 million graduates at four-year institutions in 2001 to about 1.98 million graduates in 2018—students were also taking longer and longer to complete those “four year” degrees, driving up costs and raising the risk of non-completion for even the most able students. The reasons are myriad, but in the mid-2010s, universities across the country began adding a new support, called “completion grants,” to help speed up such students and get as many near-completers across the degree finish line as possible. A new study looks at the impacts of this intervention.

Completion grants are aimed at a specific subset of students who are near degree completion but experiencing a financial burden likely to either slow down their progress or force them to dropout altogether. Georgia State University’s Panther Retention Grants, started in 2011, are the genesis of the model. It has since spread to institutions across the country, with programs funded by private donors, state government, and philanthropic organizations.

The researchers conducted a randomized-controlled trial of the efficacy of completion grant programs at a group of eleven public institutions that are open- and broad-access. The schools are located in ten different states and average 25,000 undergraduates each. In 2019, the average four- and six-year graduation rates among them in 2018 were just 30 percent and 56 percent, respectively. And the average cost of attendance for in-state students was just over $25,000 a year, with half of all students using federal loans to pay for college.

The schools’ grant programs were independently operated but shared broad similarities. Students did not apply for the grants. Rather the money was awarded based on administrative records indicating that students were near completion (having earned at least 75 percent of the credits required for their degree) and had unmet financial need, as defined by a balance due to the institution or a shortfall of funding for living expenses. Other eligibility requirements included FAFSA completion, an Expected Family Contribution of $10,000 or less (that is, within 200 percent of Pell Grant eligibility), compliance with satisfactory academic progress requirements as defined by the institution, in-state residency, and a current course load of at least six credits.

Using these criteria, the institutions identified 14,226 eligible students in summer 2018. They conducted a random lottery with separate draws for Pell recipient and non-recipient students. Across universities, 2,231 students (16 percent of those identified as eligible) were selected to receive grants. The remainder formed a control group receiving no additional funds. The average grantee received approximately $1,200, with the highest award totaling $3,000. Funds were awarded for up to one academic year, with some institutions awarding the full grant in the fall and others splitting it up between fall and spring semesters. Grants were automatically distributed without any action required of students, and were received no later than two weeks following the start of term. Communications to students stressed that no repayment of funds would ever be required. More on that below.

The researchers measured degree progression for all 14,226 eligible students—recipients and non-recipients alike—for three years following distribution of the funds. On the retention side, 95 percent of all students identified as eligible for a grant graduated or remained enrolled within three years, with or without receiving a grant. As for completion—the intended goal of the program—two-thirds of all those who did not drop out went on to complete degrees. However, the vast majority of completers (89 percent) took two further academic years to do so. Not exactly a fast track. There was no statistically-significant difference between grant recipients and non-recipients in terms of completing a four-year degree or the time needed to earn such a degree. At best, grant recipients saw a 1 percentage point higher rate of retention in the first year than their non-recipient peers, a barely-significant boost that also quickly dissipated in the following years. Additionally, there were no differential impacts observed for low-income students or racial or ethnic minority students as compared to their higher-income and white peers.

The data are clear that completion grants as operationalized in these universities do not provide the intended benefits but offer no clarity on why that is case. The researchers point to student survey responses, which indicate a lack of understanding among grant recipients as to why they received the funds (and ignorance among a small number of respondents that they received any additional money at all), despite the detailed communication provided. The implication: If students don’t know that they are being incentivized to finish (and to do so expeditiously), they experience no additional motivation to do either. The researchers also suggest that the no-requirements, “free money” award process actually plays into the lack of understanding among recipients. They recommend a more active completion grant model, involving more and better communication, as well as engaging more directly with eligible students, such as via deans or counselors. It could also be that there is more than just financial concern standing between these near-completers and the degree finish line—changing majors, excess electives, family commitments, etc.—and that no amount of money would be enough to overcome them.

SOURCE: Sara Goldrick-Rab et al., “Affording Degree Completion: An Experimental Study of Completion Grants at Accessible Public Universities,” Board of Governors of the Federal Reserve System (July 2023).

view

Cheers and Jeers: September 7, 2023

The Education Gadfly
9.7.2023
Flypaper

Cheers

  • A Detroit school is taking a multi-levered approach, including mentorship programs, home visits, data tracking, and more, to tackle chronic absenteeism. —Chalkbeat
  • A family finds community, hope, and academic success after enrolling their autistic child in a Catholic school. —Wall Street Journal
  • A conservative and liberal columnist for the Washington Post come together to focus on common ground around policies to support families. —Marc Thiessen and Alyssa Rosenberg
  • “Teachers college to ‘dissolve’ Lucy Calkins’s Reading and Writing Project.” —Education Week

Jeers

  • A lack of political leadership and the dissolution of accountability has left students backsliding even after returning to in-class instruction. —Michael Petrilli
  • A strike in Youngstown, Ohio, continues for the tenth day as the union and school board struggle to negotiate and agreement. —WFMJ
view

What we're reading this week: September 7, 2023

The Education Gadfly
9.7.2023
Flypaper
  • Science of reading policies and curricula have spread across the country, but the science of proper implementation is less clear. —Matthew Yglesias
  • As universal school choice legislation spreads, one company is experimenting with virtual reality classes. —The New Yorker
  • “The Christian home-schooler who made ‘parental rights’ a GOP rallying cry.” —Washington Post
  • Generative AI disproportionately boosts the productivity of low-skilled workers and so could prove a great equalizer. —Noah Smith
  • “High school English needed a makeover before ChatGPT” —The Atlantic
Fordham Logo

© 2026 The Thomas B. Fordham Institute
Privacy Policy
Usage Agreement

National

P.O. Box 110
Burke, VA 22009

202.223.5452

[email protected]

Ohio

P.O. Box 82291
Columbus, OH 43202

614.223.1580

[email protected]

Sponsorship

130 West Second Street, Suite 410
Dayton, Ohio 45402

937.227.3368

[email protected]