A high school diploma is a critical marker in the transition to adulthood that affects labor participation, social mobility, and opportunities for success. The good news is that high school graduation rates reached an all-time high of 82 percent in spring 2014. The overall graduation rate for charter public schools, however, fell short of that number by ten points. We know that charter schools have unique characteristics that occasionally don’t hold up well under cursory examination, and when we take a closer look, we find that there is actually a lot of good news about charter school high school graduation rates.
In 2010, America’s Promise launched the GradNation campaign in an effort to raise the percentage of high school students who graduate with a regular high school diploma in four years to more than 90 percent. As part of their campaign, the group publishes an annual report, Building a Grad Nation: Progress and Challenge in Ending the High School Dropout Epidemic, focusing both on schools that have reached that 90 percent threshold and those that graduate 67 percent or fewer of their students on time (once referred to as “dropout factories”). We analyzed the same data to examine these two thresholds for charter public schools.
Adjusted cohort graduation rates (ACGR’s) for all of the approximately twenty-two thousand public schools that graduated students in spring 2014 are publicly available. Graduation rates are reported for the entire cohort at each school, as well as for low-income students and by racial/ethnic group. To calculate the ACGR, a school must track a cohort of ninth graders for four years. Students who enroll in the school after ninth grade are added to the cohort and those who leave are subtracted, provided that the school can attest to the students enrolling in other schools. The ACGR is the number of students who graduated divided by the number who started in the ninth-grade cohort four years earlier. Combining these data with the National Center for Education Statistics’s (NCES) Common Core of Data (CCD) provides context for the rates, such as school locale or school type.
There are some unique characteristics of charter schools that may make using ACGR and CCD slightly problematic. First, to be considered an alternative school in the CCD, the school must have indicated this on their survey form by selecting “4” on the “school type” question. A scan of the data suggests that alternative charter schools often do not request this designation. For example, at Boston’s Phoenix Charter Academy, over half of the students have already dropped out of high school and are returning for a second try. Yet it is listed as a “regular” school in the CCD. In fact, every charter school highlighted in our report on schools that target over-age, under-credited students is listed as a “regular” school. Fortunately, the definition and survey question are being revised for the 2016–17 data collection in order to improve clarity.
Another unique aspect of charter schools is that they face the very real threat of being closed due to low performance. A scan of the data set reveals approximately fifty charter schools that have since closed. Finally, the need to track students in the cohort who leave the school may be more difficult for a charter since that new school is much more likely to be under a different LEA in the case of charters (as compared to a move within an LEA for students in district-run schools). None of this is meant as an excuse—but while most of the charter schools in the data set are probably apples, we also know that a bunch of them are oranges.
Looking at ACGR by locale and subgroup is critical for charters because they serve disproportionate numbers of low-income urban students of color. It is also the case that in some states, charters are limited to only those districts that are already low-performing. So it is important to compare rates within districts.
To look more closely at the success or failure of charter schools at graduating their students on time with a regular diploma, we first limited the list to schools with at least one hundred enrolled students—that’s total enrollment, not the number in the starting ninth-grade cohort. We also filtered out alternative schools using the “4” discussed above. Because these data are public, student privacy must be protected and rates for small groups of students are given as a range rather than a point. In these cases, we used the midpoint of the range. However, we excluded any rates for starting cohorts of fifteen or fewer ninth graders because the ranges were too large. After applying these filters, there were data for 14,880 non-charter public schools and 1,221 charter public schools. Forty-five of the non-charter schools and eighty-seven of the charter schools are full-time virtual schools and were excluded from this analysis.
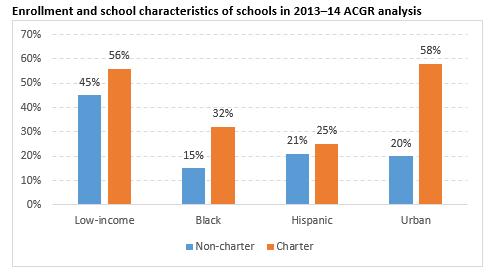
Using CCD data, we found that there are significant demographic and locale differences between the two groups of schools. The charter schools in the data set served higher proportions of low-income black and Hispanic students, and a higher percentage of the schools are urban.

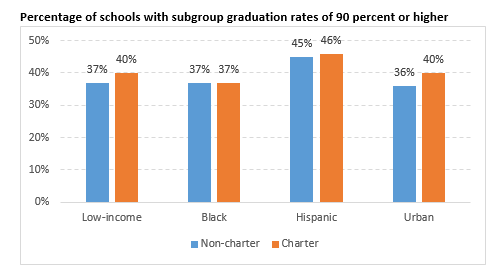
The graduation rate goal of 90 percent or higher is a tough target for urban schools, which often serve higher proportions of disadvantaged students. According to the data, however, greater percentages of charter schools have met this goal for low-income and Hispanic graduation rates and for overall graduation rates in urban schools. For black graduation rates, the same percentage of charter and district-run schools were at 90 percent or higher.

These comparisons are for all of the approximately 1,200 charter schools that met the criteria of one hundred or more students, non-alternative status, and at least fifteen students in the starting ninth-grade subgroup cohort. In other words, 40 percent of charter schools with at least fifteen low-income students in the ninth-grade cohort graduated 90 percent or more of their low-income students.
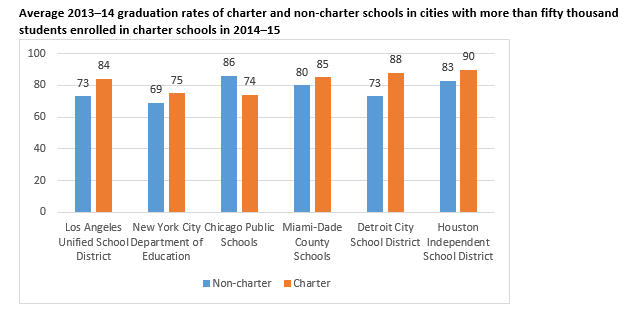
We know, however, that charter schools are not evenly distributed across the US. They tend to be concentrated in urban areas, and in some districts, they now serve substantial portions of the public school enrollment. In our report on America’s largest charter cities, we identified seven school districts in which fifty thousand or more students are enrolled in charter schools. For these cities, charter schools are no longer a novel idea—they have critical mass. Using the same methodology, we looked at the graduation rates for charters and district-run schools in these districts. With the exception of Chicago, the charter schools in these high enrollment cities had higher graduation rates than non-charter public schools.[1] Houston’s average charter graduation rate is at the 90 percent threshold, and Detroit—a city that can use any and all good news—is nearly there.

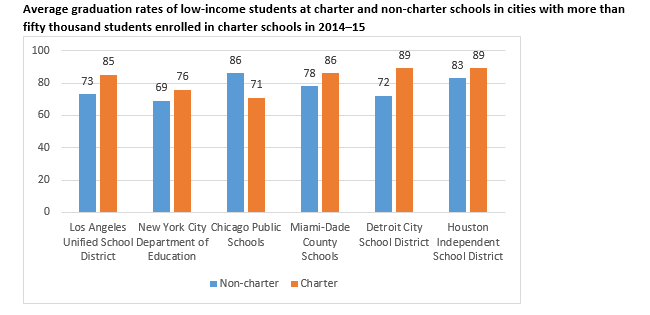
The story is essentially the same when looking exclusively at low-income students, for whom a high school diploma can be especially meaningful. Again, with the exception of Chicago, the charter schools are graduating low-income students at higher rates than non-charter schools.

The low-income graduation rate in Los Angeles non-charter schools was for a starting cohort of 26,500 low-income ninth graders; in New York City, it was for a starting cohort of 53,000. If these two districts had graduation rates in their non-charter schools that were as high as those in the charter schools, approximately 3,200 more low-income students in Los Angeles and 3,700 more low-income students in New York City would have graduated on time with a regular high school diploma.
We also found that there are nearly three hundred charter schools not making the grade—meaning that they graduate 67 percent or fewer of their starting cohorts. Granted, some of these have closed. What’s more, many are incorrectly coded as “regular” schools when they actually serve alternative student populations, and some may have difficulty tracking students who leave. We certainly need to make sure that we figure out what is going on in these schools and help them to improve (if possible) or close (if not). But when you dig into the data using a perspective that is relevant for charter schools, you can find lots of good news about the work being done to make sure that as many students as possible make it to graduation.
[1] It should be noted that in Chicago, the number of charters are limited. Several large networks of schools fall under a single charter and are counted as just one school in the CCD. The Nobel Street Charter Schools enrolled over 25 percent of the students in the starting ninth-grade cohort of all Chicago charter schools and reported an overall ACGR of 90 percent (and a low-income ACGR of 91 percent), but the network only counted as one school out of twenty-three.
Susan Aud Pendergrass is the senior director for research and evaluation at the National Association for Public Charter Schools.


