Report
Career & Technical Education
Ohio’s Career-Technical Education Landscape: An overview of CTE at the high school level
Our latest policy brief provides an overview of the CTE landscape for Ohio high schoolers.
Our latest policy brief provides an overview of the CTE landscape for Ohio high schoolers.

In fall 2022, the Ohio Department of Education released state assessment results from the 2021-22 school year. The data continue to reveal the massive learnings losses that occurred during the pandemic, along with the uneven recovery in its wake. This report offers a close look at Ohio's achievement data from the 2018-19 to 2021-22 school years, and concludes with four recommendations that can help accelerate student learning across the Buckeye State.

Executive summary
This report explores the impacts of Ohio’s EdChoice program on school district enrollments, finances, and educational outcomes. The study includes detailed analyses of the state’s “performance-based” EdChoice program that, as of 2021–22 provides vouchers to approximately 35,000 students as well as its “income-based” EdChoice program which serves approximately 20,000 low-income students.
Recognizing the importance of an educated citizenry, Ohio taxpayers have made generous investments in K–12 education. In FY 2021, statewide spending on public primary and secondary education reached a record high of $21 billion or $13,300 per pupil.
As Governor Mike DeWine asserted, the state of Ohio has “a moral obligation” on behalf of students to step in when schools are falling short of academic performance standards. Under the Every Student Succeeds Act (ESSA), federal lawmakers have given states the ability to chart their own course when it comes to fixing under-performing schools.

Nearly a quarter century after the DeRolph v. Ohio decision, many still assume that the state’s school funding system is unconstitutional.
The 2019–20 Fordham Sponsorship Annual Report provides insight into our sponsorship work during the year and the performance of our sponsored schools.

Though not widely known, Ohio teachers have three retirement options: a traditional pension plan, a 401(k)-style defined contribution plan, and a hybrid plan that combines features of both. A large majority of teachers are in the pension plan—the result of either an affirmative choice or by default, not having selected a specific plan at the beginning of their careers.

After a one-year pause in Ohio's school accountability system, the road back to normalcy is uncertain. Fordham's new policy brief titled Resetting school accountability, from the bottom up offers a clear and concise plan to restart state assessments and school report cards.
Now in its fourth edition and fully updated for 2020, Ohio Education by the Numbers Education is a look at vital statistics about Ohio’s schools and the students they serve. We intend it to be a readily accessible resource that keeps education stats—with cites to original sources—at your fingertips.

Since 2005, the Thomas B. Fordham Institute has published annual analyses of Ohio’s state report cards.
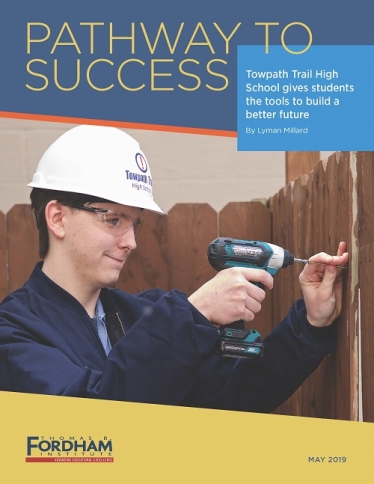
Across the nation, headlines have trumpeted soaring high-school graduation rates. Ohio is no exception. Lofty rates leave the impression that the vast majority of students are ready to take their next steps in life. But the truth is that too many students exit high school not fully prepared for college and career.

According to a recent What Works Clearinghouse review, the most effective dropout-prevention strategy is to directly connect schoolwork to students’ career aspirations.
Creating smart, coherent education policy is painstaking work; there are technical, budgetary, and political challenges at almost every turn. But it is some of the most important work that state leaders can undertake.
"Everyone is entitled to his own opinion, but not to his own facts." -- Senator Daniel Patrick Moynihan. That sentiment has never been more profound and applicable than it is today.

Since 2005, the Thomas B. Fordham Institute has published annual analyses of Ohio’s state report card data, focusing on district and charter schools in Ohio’s Big Eight urban areas: Akron, Canton, Cincinnati, Cleveland, Columbus, Dayton, Toledo, and Youngstown.
Education will always be one of Ohio’s highest priorities. It bonds communities together, provides the foundation for the state’s long-term economic success, and—most importantly—helps students across the state to realize their potential and pursue their dreams.

For more than a decade, Ohio’s annual school report cards have offered the public information on school quality. The current iteration of report cards has notable strengths: School ratings are grounded in hard data, they use an intuitive A-F rating system, and several of the metrics encourage schools to pay attention to the achievement of all students.

The Thomas B. Fordham Foundation’s sponsorship annual report highlights our work with eleven schools that served 4,150 students in five Ohio cities during the 2016-17 school year.
Interdistrict open enrollment allows students to attend public schools outside their district of residence. It is among the largest and most widespread of school-choice efforts in the United States but often flies under the radar in policy discussions. In Ohio, over 70,000 students open enroll into schools outside their district of residence.
By Jennifer O’Neal Schiess, Max Marchitello, and Juliet Squire
This guidebook offers simple and easy-to-use vital statistics about Ohio’s schools and the students they serve. The facts and figures contained within this report offer an overview of who Ohio’s students are; where they go to school; how they perform on national and state exams; and how many pursue post-secondary education.

On September 15, Ohio released report cards for approximately 600 school districts and 3,500 public schools (district and charter). These report cards are based on state exam results from the 2015-16 school year, along with several other gauges of student success.

Shortly after Ohio lawmakers enacted a new voucher program in 2005, the state budget office wrote in its fiscal analysis, “The Educational Choice Scholarships are not only intended to offer another route for student success, but also to impel the administration and teaching staff of a failing school building to improve upon their students’ academic performance.” Today, the

A deep dive into the performance of Ohio’s public schools, statewide and in its eight largest urban areas

The 2015 Fordham Sponsorship Annual Report is our opportunity to share the Fordham Foundation’s work as the sponsor of eleven schools serving approximately 3,200 students in five cities, and our related policy work in Ohio and nationally.
Like other states, Ohio has over the past few years put into place a standards a
Charter schools are quickly becoming a defining feature of Ohio’s public-education landscape, educating over 120,000 children statewide. The “theory of action” behind charters is fairly simple.

The 2014 Fordham Sponsorship Annual Report is our opportunity to share the Fordham Foundation’s work as the sponsor of eleven schools serving 3,200 students, and our related policy work in Ohio and nationally. We are fortunate as an organization that our policy work benefits our sponsorship efforts; and, that our lessons from sponsorship inform our policy and advocacy strategies.