New early literacy data from state report cards are part of the baseline from which we can measure the impact of Science of Reading reforms going forward. Here’s a look at ten Ohio districts whose results fill in important details for the future.
In June 2023, Ohio policymakers established a statewide initiative that requires schools to follow the science of reading, an evidence-based instructional approach that focuses on phonics andknowledge-building. As part of this initiative, public schools (traditional district and charter) are required to adopt curricula and materials that appear on a state-approved list of high-quality options. Teachers are required to undergo professional development in evidence-based reading instruction, with stipends available for those who complete the training. Next year, the Ohio Department of Higher Education will begin auditing educator preparation programs to ensure teacher candidates are well-trained in the science of reading. And this year, eighty-four reading coaches are providing intensive support to educators in 115 schools and districts, up from thirty-three coaches in fifty-three schools last year.
This is a broad and bold effort. If implemented well, it could vastly improve reading outcomes. But it’s going to take time to see results. Ohio has hundreds of districts and charter schools and thousands of teachers. Many of them haven’t been using instructional methods aligned with the science of reading. What’s happening right now in Ohio schools is akin to turning around an aircraft carrier—it will take time and patience to change course, and there are no shortcuts. State policymakers need to resist the urge to repeat their troubling history of prematurely giving up on promising reform efforts.
But being patient doesn’t mean we shouldn’t keep a close eye on the data. The early literacy component on Ohio’s state report cards offers a detailed look at how districts and schools are faring in terms of reading progress. Because the current school year will be the first full year of implementation of the new Science of Reading reforms, the previous two academic years (2022–23 and 2023–24) should serve as the baseline for comparison going forward. And while statewide results matter, they can mask considerable growth (or lack thereof) at the district and school level. To get a true picture of Ohio’s early literacy progress, we need to dig into district-specific data.
In this piece, we’ll examine baseline early literacy results in the Ohio Eight, a group of eight urban districts with a long history of poor performance. Also included in the analysis are Lorain and East Cleveland, districts that spent several years under the oversightof now-defunct Academic Distress Commissions. (So did Youngstown, which is one of the Ohio Eight.) Together, these ten districts serve nearly 187,000 students—more than a tenth of the state’s public-school population—and are among those most in need of early literacy improvement.
First, let’s look at how they performed overall on the early literacy component. Chart 1 below displays two data points—districts’ star ratings on the component and the weighted percentage that determined those ratings. This percentage is based on three measures: third-grade reading proficiency rates, third-to-fourth grade promotional rates, and the percentage of off-track readers who move to on-track status in the following year. Districts with a weighted component percent of 58 percent or below earned one star out of five and were identified as needing “significant support” to meet state standards. Districts with a weighted component percent from 58 to less than 68 percent earned two stars and were identified as needing “support.” In the columns for the most recent school year, green shading indicates improvement, yellow indicates results that remained flat, and red indicates a decline.
Chart 1. Overall early literacy results on state report cards
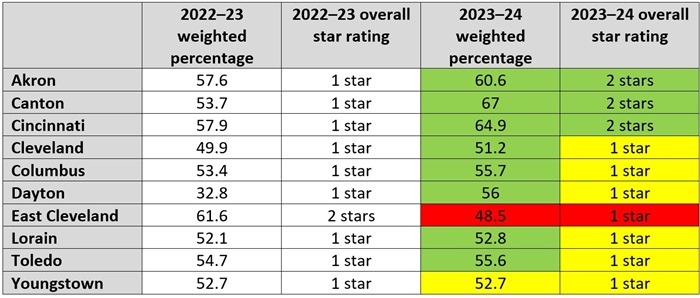
In 2023–24, eight of these ten districts earned higher weighted percentages than the year prior. Dayton, in particular, showed considerable improvement, as it jumped more than 23 percentage points. Unfortunately, the district’s 2022–23 weighted percentage was so low that even this significant improvement wasn’t enough to bump up its overall star rating. But three other districts—Akron, Canton, and Cincinnati—succeeded in improving from one star to two. East Cleveland, on the other hand, performed significantly worse. Not only did the district drop from two stars to one, its weighted percentage dropped 13 points.
Next, let’s take a closer look at one of the early literacy component’s three measures: third grade reading proficiency. Research shows that reading proficiently by the end of third grade is an important benchmark for kids. That’s why Ohio policymakers assigned this particular measure the highest weight (40 percent) in the overall rating calculation for the component. Chart two displays the proficiency percentages of each district, as well as the statewide average and the year-to-year difference. In the final column, green shading indicates an improvement of more than five points, yellow indicates an improvement of less than five points, and red indicates a decline.
Chart 2. Percentage of third graders scoring proficient on the reading segment of state ELA exam
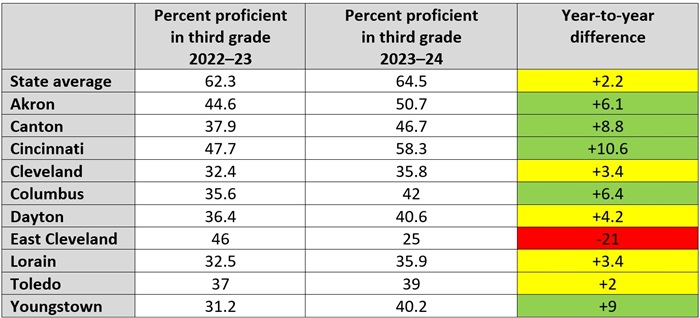
During the most recent school year, only two districts—Akron and Cincinnati—had more than half of their third graders reach proficiency. And in all ten districts, proficiency numbers are below the state average. However, eight of the districts had year-to-year improvement that outpaced the state (though the statewide average only improved by a modest 2 percentage points). Cincinnati performed the best, with a 10.6 percentage point jump that puts its overall proficiency rating just 6 percentage points shy of the state average. The worst performer was East Cleveland, which registered a massive 21 percentage point drop. Only a fourth of third graders in that district reached the state’s proficiency benchmark.
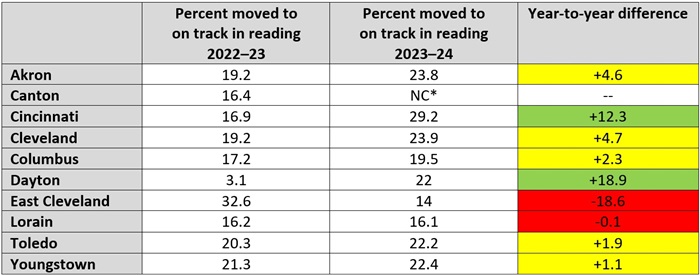
Proficiency isn’t the only component measure that deserves a closer look. It’s also important to identify progress, which the state does via the “improving K–3 literacy” measure. The Department of Education and Workforce (DEW) uses the results of fall diagnostic assessments to determine the percentage of students who move from “not on track” to “on track” in reading from one year to the next. These results indicate how well schools are improving K–3 literacy throughout all the early grades, not just third. By doing so, the measure identifies schools and districts that are making critical progress with struggling readers. Chart 3 displays the overall percentage of students that each district moved to on track in reading during the two most recent school years, as well as the year-to-year difference. In the final column, green shading indicates an improvement of more than five points, yellow indicates an improvement of less than five points, and red indicates a decline.
Chart 3. Results for the improving K–3 literacy measure on state report cards
The good news is that most districts did much better in 2023–24 than the year prior. Dayton is the big winner, as it registered an increase of nearly 19 percentage points. Cincinnati also did well with an increase of 12 percentage points. However, even with these improvements, not a single district succeeded in moving more than a third of its off-track students to on-track. In fact, some are doing an extremely poor job. Lorain’s 0.1 percentage point drop might not seem like a big deal, but the district moved only 16 percent of its off-track readers to on track. In that context, any decrease—no matter how small—is terrible news. Meanwhile, East Cleveland continued its run of sharp declines, registering a drop of more than 18 percentage points. In just one year, East Cleveland went from being the highest performer on this list to being the worst.
***
Ohio is on the cusp on something big with early literacy. If policymakers can be patient and stick with it, Ohio could see significant improvement in reading outcomes. Nowhere is that improvement more necessary than in the Ohio Eight and the districts previously run by Academic Distress Commissions. Judging by the data outlined above, these districts have a long way to go. But thanks to the science of reading and Ohio’s recent reform efforts, that mountain should be a little easier to climb.
One of the most pressing challenges facing American education is closing achievement gaps. Beginning with the Coleman Report released in 1966, analysts have documented large disparities in academic outcomes based on students’ backgrounds. Depending on how the gap is measured—whether by socioeconomic status or race/ethnicity and along which assessments—researchers today estimate that less-advantaged pupils are on average anywhere from threetofive grade levels behind their peers.
While there are pockets of success—particularly among exceptionalpublic charter schools—U.S. schools overall have a disappointing track record in addressing the achievement gap. In a 2020 paper, Stanford University’s Eric Hanushek and colleagues find that, although gaps by students’ socioeconomic status (specifically based on parental education and at-home resources) have slightly narrowed over the past four decades, they are not closing at a fast enough pace. They conclude that, at this rate, “it would take another century and a half to completely close the gap.”
We must do better. Students from disadvantaged backgrounds need the same level of knowledge and skills as their counterparts to succeed after high school. That’s why political leaders in both parties—including presidents George W. Bush and Barack Obama—have called closing achievement gaps the civil rights issue of our time.
Unfortunately, the pandemic widened these gaps and reversed much of the progress that had been made. Ohio and other states have their work cut out to accelerate learning and ensure that all students achieve at high levels. This piece examines where Ohio stands in terms of achievement gaps on state exams and whether any post-pandemic progress is being made. The focus is on the state’s performance index scores, a composite measure of achievement on all state exams that weights higher test scores more heavily. This measure provides a broader picture of achievement on state tests than proficiency rates, which focus more narrowly on clearing the proficiency bar. Results from the National Assessment of Educational Progress (NAEP) provide further perspective on Ohio’s achievement gaps—versus national and over longer timespans—and we’ll look at those when the latest data are released in early 2025.
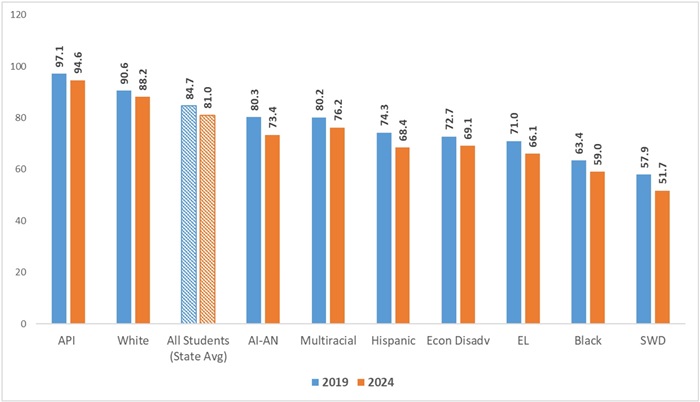
Figure 1 displays performance index scores by the various student groups delineated in federal law. As indicated by the blue columns, pre-pandemic (2018–19) achievement gaps are clearly evident. The scores of Black and Hispanic students, economically disadvantaged students, English learners, and students with disabilities fell well below those of Asian/Pacific Islander and White students, as well as the statewide average (all students). The orange columns represent the most recent scores from 2023–24, and show persistently wide achievement gaps.
Figure 1: Performance index scores by subgroup, 2018–19 to 2023–24
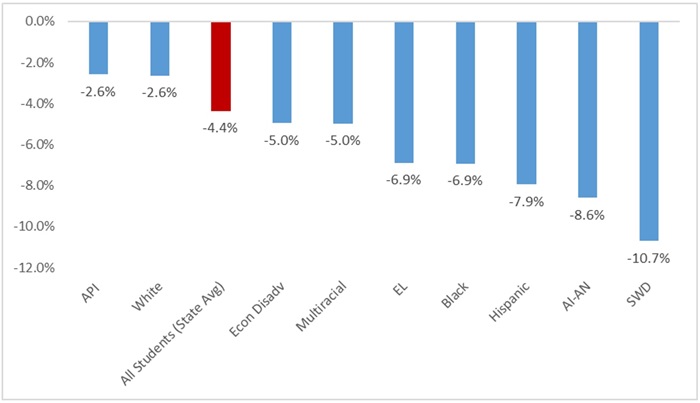
Compared to the 2018–19 pre-pandemic baseline, achievement gaps have grown. As indicated by the figure below, American Indian or Alaskan Native,[1] Black, and Hispanic students, as well as students with disabilities, have suffered larger test-score declines. The performance index scores of Black students, for instance, are 6.9 percent lower in 2023–24 than in 2018–19, whereas the White student loss is 2.6 percent. The larger decline in Black scores has thus widened the Black-White achievement gap relative to the pre-pandemic baseline.
Figure 2: Percent change in performance index scores, 2018–19 (pre-pandemic) to 2023–24
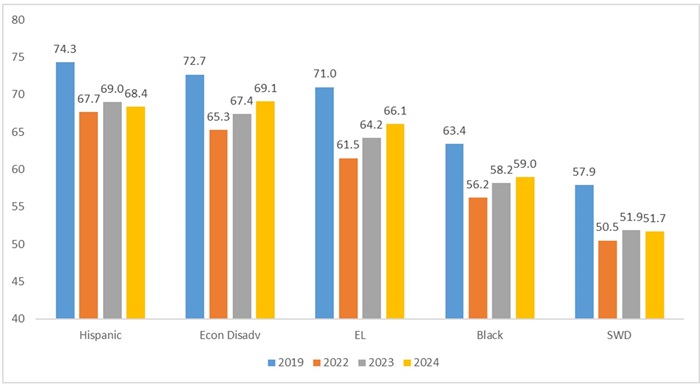
Turning to a focus on post-pandemic trends, we begin to see some hopeful signs. Figure 3 below zeros in on the results of the lower-achieving student groups. Here, we observe steady post-pandemic improvements among economically disadvantaged students,[2] English learners, and Black students relative to their 2021–22 baselines (orange columns). Less improvement, however, is visible among Hispanic students and students with disabilities.
Figure 3: Performance index scores by at-risk subgroup, 2018–19 to 2023–24
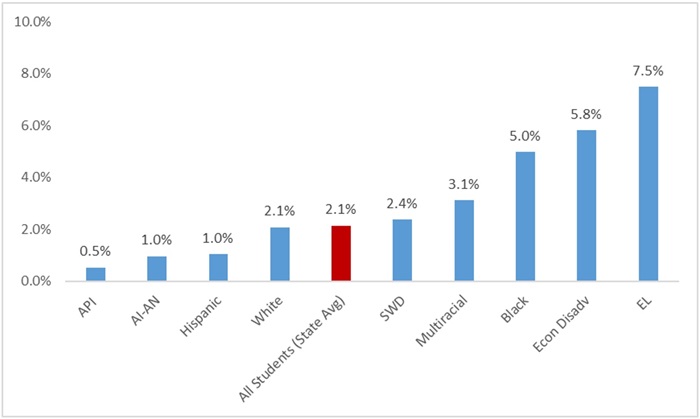
The faster post-pandemic progress of Black, economically disadvantaged, and English learner student groups is more apparent when we look at the improvement in scores from 2021–22 to 2023–24. Scores for English learners rose the fastest during this period—up 7.5 percent—with economically disadvantaged and Black students close behind (+5.8 and 5.0 percent, respectively). These rates of improvement exceed those of their more advantaged peers and the statewide average. Thus, achievement gaps for these groups have somewhat narrowed after the widening that occurred during the pandemic.
Figure 4: Percent change in performance index scores, 2021–22 (post-pandemic) to 2023–24
* * *
The 2023–24 data present a mix of good and bad news. First and foremost, they remind us of the urgent need to significantly raise the achievement of Ohio’s most vulnerable student groups. For Ohio leaders, there remains a clear moral imperative to work towards ensuring that all students can read, write, and do math proficiently.
Yet there are also signs of progress. The faster post-pandemic improvements in the scores of economically disadvantaged and Black students is notable and may reflect the impact of federal Covid relief funding, much of which was directed to high-need, urban districts. (Vlad Kogan’s recent analysis suggests that these dollars slightly boosted math achievement after the massive pandemic setbacks.) It might also reflect the steadily improving—and, as of late, better funded—urban charter schools that serve primarily disadvantaged students. It may even be an early sign that Ohio’s renewed focus on early literacy is already yielding some academic gains (and note that third grade reading proficiency was up in all of the Ohio Eight urban districts).
Of course, more still must be done to keep the needle moving in the right direction. Federal Covid relief aid will soon dry up, and state legislators will need to seek creative ways that enable schools to prioritize academics, preserve effective programs, and retain high-performing teachers. Chronic absenteeism remains far too high—especially in Ohio’s urban communities—and state and local leaders need to push harder for regular school attendance. Finally, state policymakers must continue to hold schools accountable for academic results—and they need to press for changes when schools continually fall short of performance goals.
Exceptionally-high-performing schools have proven that achievement gaps can be overcome. But closing the gap at a system-wide level has proven elusive. It will take a relentless focus on strong academics to ensure that all Ohio students, no matter their background, acquire the skills they need for success in life.
[1] This student group comprises just 0.1 percent of Ohio students in 2023–24.
A perennial question for high schoolers is what they plan to do after they graduate. But for many students, the answer is elusive—not because they don’t care to find it, but because they lack the information and support needed to do so.
Don’t just take my word for it. A 2023 national survey of high school students found that only 13 percent felt fully prepared to choose their path after high school. A whopping 78 percent said they believe it’s important to determine career plans before they graduate, yet roughly half have actually received career exploration assistance of some kind. For example, 40 percent of surveyed students said their high schools provided programs to help them explore potential career paths, while just 33 percent said they were provided with questionnaires or tests to help them uncover their interests.
Ohio should be an exception. Since the 2015–16 school year, state law has required public schools to establish policies that specify how they plan to provide career advising to students in grades six through twelve, as well as how they will “prepare students for their transition from high school to their post-secondary destinations.” State law also mandates that every student in grades nine through twelve have a graduation plan that maps their academic pathway to a diploma.
And yet, far too many Ohio students are in the same boat as their national peers. In an interview with The 74 earlier this year, the director of Ohio’s Department of Education and Workforce (DEW), Steve Dackin, noted that most kids are “at a deficit” when it comes to figuring out their futures: “If you ask a kid, ‘what do you want to do when you get out of high school?’ they’re void of much information about what’s available.” Meanwhile, a recent survey of Ohio parents found that only 39 percent on average are extremely confident that their child will be well equipped to succeed in the workforce.
To their credit, state leaders are taking stepstoward correcting this problem. In his recent state of the state address, Governor DeWine called on the legislature to “make a very simple fix in statute to insert career planning into existing graduation plan requirements.” While there are several ways to accomplish this promising idea (check out Fordham’s suggestion, for example), implementation of any kind will be difficult unless state leaders also expand schools’ capacity.
Although Ohio provides career awareness and exploration funds, public schools can spend those dollars on a wide variety of things. They may not cover career planning and advising services, and might not be enough[1] to address schools’ capacity problems. To help solve the problem, policymakers could set aside funds in the upcoming state budget to establish a career planning and advising grant. The grant would be designed to increase local capacity to provide comprehensive, consistent, and personalized career advising and planning support for students. Funding would be available to all public schools—including traditional districts, charters, STEM schools, and JVSDs—as well as nonprofits and partnerships (more on this below). And like the state did with its CTE construction and equipment grants, the application process should be competitive.
Of course, if there’s anything the pandemic has taught us, it’s that throwing money toward promising ideas doesn’t necessarily guarantee success. To ensure that this program accomplishes its goal, policymakers should establish very clear guardrails around how the money can be spent. Here are a few examples:
Dedicated career exploration staff. If current career advising efforts are lackluster because public schools don’t have the staff to provide services to students, then grant funding could cover the cost of hiring dedicated staff to provide those services. It’s important, however, that money is only made available for full- or part-time positions that focus solely on career planning. Schools should be prohibited from spending these funds on supplementing salaries of existing staff or hiring additional staff who will be responsible for duties other than career advising. Schools are free to offer services via their current staff. But the point of this particular grant is to expand and improve career planning, thus the dollars should be limited to paying for dedicated staff.
Programming provided through industry and community partnerships. The answer to school capacity woes isn’t always hiring more in-house staff. Sometimes, the answer is branching out and enlisting the help of those outside the education sector. Consider the Greater Cleveland Career Consortium, a group of public, private, education, and nonprofit organizations that helps ensure every student in the Cleveland region designs a career plan, and partners with schools to provide career-based learning opportunities. Grant funding should be available for existing partnerships like this, as well as for new ones that might need some financial assistance to get up and running. Individual nonprofits with promising proposals and a partnership agreement with at least one district or school should also be eligible to apply.
Career interest and aptitude tests. A crucial part of helping students explore careers is giving them the opportunity to figure out their interests and talents. Providing funding for schools to pay for assessments likeYouScience could go a long way toward providing students with personalized guidance.
Guardrails like this can help ensure that the grant program is student-focused. For further assurance—and to gauge the impact of the program—the state should review how schools spend their grant. Schools that use these funds to hire dedicated staff, as well as partnerships between schools and nonprofits, should be required to demonstrate how many students they served and the number of hours of advising and support that each student received. They should also be required to provide a detailed summary of the career-connected content and learning opportunities that students were exposed to. Schools that use grant funding to purchase career interest and aptitude tests should be required to demonstrate how many students took those tests, and identify the support and guidance they provided to students based on their results.
Gathering this information—as well as any available data on outcomes, like how many students created career plans, enrolled in CTE courses, or participated in work-based learning as a result of the guidance they received—will help state leaders determine if and how to continue funding this program. If students are benefitting, lawmakers should keep the program going.
The DeWine administration has made improving career pathways a priority. Adding career planning to existing graduation plan requirements is a good next step, but only if state leaders ensure that it doesn’t become a box-checking exercise. The best way to do that is to build infrastructure around career advising and guidance. And a grant program aimed at expanding local capacity would be a great place to start.
[1]Lawmakers raised the per-pupil amount for career awareness and exploration funds in the previous budget from $5 in FY 2023 to $7.50 in FY 2024 and $10 in FY 2025.
Author update (10/11/24): Since this piece was posted, sources have indicated Canton’s kindergarten data were misstated on its report card—a possibility acknowledged in this piece. The district's report card, as well as its elementary school report cards, now have “watermarks” flagging the data reporting error and indicating that the error may have impacted the ratings. One of the policy issues raised in this piece—that schools could implement weaker assessments to avoid accountability—remains a significant concern. However, it does not appear that Canton has done this. The original text of this piece remains unchanged, but the title has been revised (it was originally titled “Canton’s early literacy data raise questions about kindergarten assessment”).
Last week, my colleague Jessica Poiner published a terrific analysis about the early literacy results from the 2023–24 school report cards. The entire piece is worth a read. Yet one striking data point deserves additional attention, as it suggests inconsistencies in the way districts assess and report kindergarten students’ literacy skills. The result of these inconsistencies could be preventing children with reading deficiencies from accessing the supports they need to become strong readers.
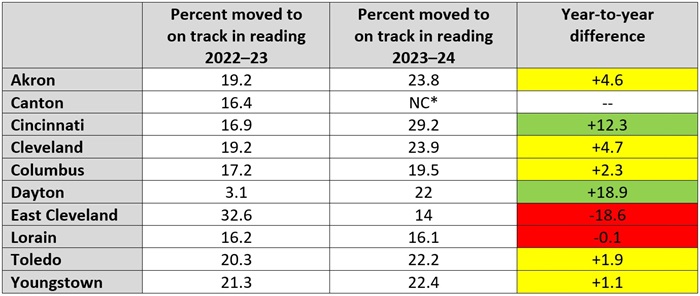
The table below is from Jessica’s analysis and shows some districts’ year-to-year improvement rate among students in grades K–3 who are struggling in reading. All of these high-poverty, urban districts reported data on this measure—except for Canton City Schools. The note at the bottom of the table explains the omission, referring to a provision (loophole, if you will) in state law that exempts districts and schools from this measure when more than 90 percent of kindergarteners are on track based on a fall diagnostic literacy assessment.
Table 1. Results for the improving K–3 literacy measure on state report cards
Given researchfinding significant early childhood language gaps by socioeconomic status and the large number of economically disadvantaged students that Canton serves, it’s shocking to see that the district was exempt. But it’s true: Canton’s early literacy data reveal a whopping 97 percent of kindergartners were on track last fall, thus allowing the district to be exempt from the improvement measure. In contrast, a more realistic 53 and 49 percent of Cleveland and Columbus kindergarten students were identified as on track.
Canton is a notable outlier among the eighty-three districts that were exempt in 2023–24. It is the only urban district to receive an exemption out of fifty-five such districts statewide (including the ten listed above plus several other inner-ring suburban and small-city districts). The district is also one of just twelve exempt districts that posted a third-grade reading proficiency rate of less than 70 percent. In fact, Canton’s 47 percent proficiency rate was the third lowest of the exempt districts and thirty-first lowest among Ohio’s 605 districts.
We don’t know what exactly is behind the district’s unexpectedly high on-track rate. One possibility is a reporting error. While there is no “watermark” in the data file signifying concerns from the Ohio Department of Education and Workforce about Canton’s literacy numbers, this possibility certainly warrants further exploration. If this is the case, the error would have occurred not only at the district level, but also in Canton’s nine elementary schools, which all reported kindergarten on-track rates of 90 percent or above.
Another explanation is that Canton actually had 97 percent of entering kindergartners legitimately on track in literacy. If true, this would be an incredible feat on the part of the city’s parents, caregivers, and preschools that should be cause for celebration. Yet in 2022–23, Canton reported just 21 percent of its kindergarten class was on track in reading, and as noted above, the district’s 2023–24 data are quite the outlier. The near-universal identification of on-track kindergartners also deviates from Canton’s language and literacy results on the statewide Kindergarten Readiness Assessment—but whose results the district chose not to use for the purpose of on and off track identification.[1] On that assessment, just 22 percent of Canton kindergarteners were deemed on track.
A more troubling possibility is that Canton is exploiting the kindergarten diagnostic assessment, perhaps in a misguided effort to avoid accountability for improving students’ reading skills. Recall that districts are permitted to select among more than a dozen state-approved assessments. Canton’s sky-high on-track rate calls into question which one it used—unfortunately, that’s not reported in state datasets—and whether the district has recently discovered a test that is more apt to identify students as being on track (or an assessment with a low “cut score”).
If the assessment-based explanation holds, Canton wouldn’t be the only district that may have identified a diagnostic that provides an overly rosy picture of children’s literacy skills. As the table below illustrates, several other districts with low third grade reading proficiency rates identify large majorities of kindergartners as on track. While not quite reaching the 90 percent exemption threshold, Dayton Public Schools identified 76 percent of its kindergartners as on track even though just 41 percent of its third graders achieved reading proficiency in 2023–24. To be sure, a lot happens between kindergarten and third grade, and these are different student cohorts. But discrepancies of this magnitude raise questions about some districts’ choice in diagnostic assessment. These types of disparities are evident in the prior year’s data too and—as displayed in the table below—when comparing districts’ on-track rates on a self-selected diagnostic versus those based on the statewide Kindergarten Readiness Assessment, both of which were given to the same cohort of students in the fall of 2023.
Table 2: Districts with large discrepancies in kindergarten on-track rates (fall) and third grade reading proficiency rates, 2023–24
This is all more than just a data-quality concern. These results also have implications for how schools serve children struggling to read.
First, as the case of Canton illustrates, districts and schools can duck report-card driven accountability for improving struggling students’ literacy skills based on results from the fall kindergarten assessment. This eases the pressure on schools and could weaken their efforts to improve literacy among children who need extra help. Canton’s free pass on the improvement measure may have also inflated its Early Literacy report card rating, leaving parents and the community with a false sense of progress. The district received two stars on this component last year, a notch above its one-star rating in 2021–22 when improvement was included.
Second, children erroneously deemed “on track” are unlikely to receive extra supports even though they have significant need for intervention. Under Ohio’s Third Grade Reading Guarantee, schools must implement—with parental involvement—a reading improvement and monitoring plan for children in grades K–3 who are off track. Students who are identified as on track (including the hundreds of kindergartners in Canton last year) are not entitled to such supports.[2]
An honest assessment of children’s language and literacy skills is the first step in helping them become proficient readers. The most recent data from Canton and several other districts raise questions about how some schools identify children with reading deficiencies. State policymakers should make sure districts implement assessments that provide accurate information about literacy skills, so that all children receive the support they need to become good readers.
[1] Districts are permitted to select among more than a dozen state-approved kindergarten literacy assessments to identify on- and off-track students in grades K–3. Currently, schools may select from fifteen state-approved diagnostic reading tests, or (for kindergarten) use results from the language and literacy portion of the state-required Kindergarten Readiness Assessment.
[2] Misidentification of off-track readers could also happen based on results from the grades 1–3 fall diagnostic assessments.
The jury remains out regarding the true impact of pre-K enrollment on early elementary outcomes. Some research finds a positive impact, some a negative, and much of it shows the fading out of impacts by third grade or soon thereafter. A new report by researcher Hyunwoo Yang adds to the evidence by looking at Wisconsin 4K, a long-standing pre-K program funded and administered by state and local education agencies and offered in public elementary schools and standalone childcare centers.
Under this program, all four-year-olds in the state are eligible to participate and can attend pre-K free of charge. However, districts may opt out of providing programming in any form, leaving thousands of eligible families without a convenient location. Those families can open-enroll in another district, but spaces are not guaranteed to non-residents and there are costs associated. A number of different scheduling options (including full-day, full-week, part-day, and part-week) provide families with flexible choices to meet various needs and to help providers run their programs in the most cost-effective manner.
According to research-recommended standards for ECE policies in the United States, Wisconsin 4K is considered “moderately high quality.” The state has established standards for teacher qualifications (bachelor’s degree and an elementary or regular education license) and learning benchmarks and set out some guidelines on content, including coverage of ten subjects in required curricula (including science, health, social studies, and art—at an appropriate level for youngsters of course), and the requirement that 30 percent of the curriculum should comprise reading and English language arts. Beyond that, program structure is variable from site to site and is described as mostly “play-based.” 4K sites can be district-run or contracted out to private providers—and can take place in district buildings or standalone sites—although districts are ultimately responsible for all programming regardless of form. As of 2018, 98 percent of districts offered 4K in some form, and approximately 75 percent of four-year-olds were enrolled. The vast majority of students attended part time and fewer than five days per week (not surprising, since only 2 percent of districts even offered a full-day, all-week program). The report cites data from the 2013–2014 school year (the last one under study for new 4K enrollment) showing the average per-child expenditure was $5,618. Newer numbers not included in the study cite a steady decrease in that average since 2017.
Yang looks at statewide administrative and student achievement data from nearly 300 districts that launched and ran 4K programs between the 2001–2002 and 2013–2014 school years. Unfortunately, precise enrollment data are not available, but Yang approximates based on the following year’s kindergarten enrollment, with appropriate cautions issued. Ditto for socioeconomic-status data, which are not mandatory for part-time 4K families to provide and thus is extrapolated based on the following year’s kindergarten demographics. The analysis likely underestimates the actual number of low-income students participating in 4K in each cohort.
Student test score data come from annual administrations of the Wisconsin Knowledge and Concepts Examination (WKCE) to third grade students each fall. WKCE testing covers more subjects, but Yang’s analysis sticks with math and reading only. Students are grouped into the four WKCE achievement categories—advanced, proficient, basic, and below basic. Overall, the data encompass 292 districts with 3,495 year-by-district observations over twelve years. Since districts implemented Wisconsin 4K programing at different times, approximately 59 percent of the observations fell into a post-treatment period (after students had participated in 4K), while 41 percent were captured prior to 4K implementation. Yang reports his impact findings at the district level due to the near universality of 4K programming, allowing him to capture any spillover effects on non-treated students, which are difficult to capture at the student level.
His analysis finds that implementation of 4K boosted district reading scores by 0.091 of a standard deviation (SD) in the model without controls (approximately a 15 percent increase in the number of students who achieved proficient and advanced levels of reading compared to pre-treatment outcomes) and 0.104 SD in the model with controls (controlling for, among other things, year fixed effects). That translates to a 20 percent increase in the number of students who achieved proficient and advanced levels of reading. Positive impacts were strongest among low-income students, at 0.165 and 0.177 SD with and without controls, respectively, equivalent to a 40 percent increase of such students achieving proficiency and advanced levels. There was, however, no statistically significant impact on reading achievement among higher-income students. The positive effect of 4K was also much greater for the reading scores of Hispanic students (0.323 and 0.333 SD with and without controls, respectively, equivalent to a 50 percent increase) than any other racial or ethnic category. There were, however, no statistically-significant effects on math achievement for 4K students, no matter how the data were sliced.
Caveats cited by Yang include the lack of data on what preschool experiences non-4K students are participating in and what other enrichment part-time 4K students take part in when not involved in the program. Additionally, the non-standardization of curriculum and programming (along with other unobserved differences from site to site) makes it impossible to suggest what specific mechanisms are driving the impacts. This research also does not address the possibility of positive impacts fading out beyond third grade. However, the positive points of Wisconsin 4K likely include the near-universal availability, some strong curricular features, and the cost-effectiveness of delivering programming in this manner. More evidence is still required for the jury to come to a verdict on the longer-term impacts of pre-K education.
The Thomas B. Fordham Institute is dedicated to improving education for every Ohio student. To do this effectively, it is critical that we listen to the views of parents across our state. With this information in hand, we can ensure that state policy makers are focused on the problems most important to parents and push toward solutions grounded in parents’ hopes and dreams for their children.
In this spirit, we are excited to share the results of a new survey on the state of education opportunity in Ohio. Produced in partnership with 50CAN and Edge Research, this survey provides not only a unique window into the opportunities available to families in our state right now but allows us to compare those answers to parents across our region and across the country.
Among the many important insights, the survey finds that Ohio’s investments in school choice have made an impact for parents. More than two-thirds of parents statewide believe they have a choice in schools for their children, and this is especially true of low-income parents. Even better: Two-thirds of parents report satisfaction with the schools their children attend. However, despite these positives, too few Ohio students are ready for the workforce or college by the time they graduate high school.
We urge you to dig into the report to see and compare parent responses across a wide range of education issues.