

Standards & Accountability
A closer look at the results of Ohio’s science of reading audits
It’s been nearly three years since policymakers established Ohio’s science of reading initiative.
It’s been nearly three years since policymakers established Ohio’s science of reading initiative.
It’s been nearly three years since policymakers established Ohio’s science of reading initiative. The sweeping statewide effort requires public schools to use state-approved high-quality instructional materials, calls on teachers and administrators to complete professional development, and tasks the Ohio Department of Higher Education (ODHE) with conducting audits on the state’s educator preparation programs to ensure that future teachers are well-trained in the science of reading. It also prohibits three-cueing, an instructional approach that encourages students to guess at words based on pictures or context rather than using phonics-based word recognition skills.
The findings of the first round of ODHE’s audits were released in December, marking the latest step in Ohio’s journey to improve early literacy. In total, the audits examined 614 reading and literacy-related courses across 49 public and private institutions of higher education. For each institution, the audit team—ODHE commissioned The Meadows Center for Preventing Educational Risk to carry out the work—reviewed course materials including syllabi and textbooks, observed instruction, and conducted interviews. Needless to say, it was a massive undertaking.
Institutions were assigned a rating based on two measures: 1) the percentage of audit metrics their programs addressed within the required 12-Hour Reading and Literacy Core,[1] and 2) the degree of compliance with Ohio’s statutory definition of the science of reading, which prohibits three-cueing. Ratings fell into three categories: “In Alignment,” “In Partial Alignment,” or “Not In Alignment.” Institutions that taught or promoted three-cueing were automatically classified as Not In Alignment.
Seventy-nine percent of the 48 institutions that received alignment ratings achieved designations of full or partial alignment. Thirty-three earned a rating of In Alignment while another five were rated as In Partial Alignment. The primary distinction between the two was the number of audit metrics met: Those that were only partially aligned failed to address three or more metrics. Two institutions that earned In Alignment ratings—Kent State University and Lourdes University—were identified as exemplars and lauded for practices including embedding structured literacy practice into coursework and field supervision, pursuing grant-funded professional learning, and partnering with districts.
Ten institutions (21 percent) earned ratings of Not In Alignment due to a documented use of the three-cueing approach in assigned texts, lecture materials, assessments, or classroom observations. It’s important to note that the presence of three-cueing in even one course section was enough to trigger this rating, regardless of how many audit metrics an institution addressed. For example, six of the ten institutions met 100 percent of the audit’s metrics but were identified as misaligned because some course sections weren’t compliant with Ohio’s statutory definition of reading science. The report identifies the number of noncompliant course sections per institution, which ranges from one at Cleveland State, Ohio Dominican University, and Ohio University to a whopping 17 course sections at Ohio State. (Ohio State’s findings probably shouldn’t be surprising, given that the school hosts Reading Recovery, one of the leading organizations promoting three-cueing.)
Next steps depend on an institution’s rating. Those that were categorized as aligned were provided with advisory recommendations to refine their programs. Partially aligned institutions are required to address all audit metrics by revising syllabi, course content, and assessments. Meanwhile, the ten institutions deemed Not In Alignment were given mandatory and advisory recommendations and must remove all texts, course materials, and instructional practices that promote three-cueing. The report notes that, for some, documenting that they’ve replaced noncompliant texts should be enough. Others, however, will need a “comprehensive review” by ODHE. Either way, state law requires institutions to address audit findings within a year. The chancellor of higher education must revoke approval for programs that fail to do so and are out of alignment.
For the most part, Ohioans should feel encouraged by the audits and these findings. Many institutions put a considerable amount of work into ensuring alignment with state standards, and it shows in the data. On average, they addressed 98 percent of audit metrics. The majority ensured three-cueing wasn’t included in their programming. And the audit team praised several institutions for their active engagement in professional development and providing teacher candidates with extensive opportunities to apply evidence-based literacy practices in the field.
This kind of progress is great news for the kids who will one day be taught by these educators. But Ohio’s work is far from over. Helping institutions address audit metrics they missed and expanding faculty expertise in reading science are both identified in the report as key next steps. Addressing the stubborn presence of three-cueing, however, is the top priority. The ten institutions using instructional methods and materials rooted in three-cueing “risk misinforming preservice candidates about effective literacy instruction.” Going forward, it will be crucial for state leaders to hold these institutions accountable for addressing audit findings and meeting state expectations. Failing to do so could derail efforts to boost reading achievement statewide.
[1] Ohio requires elementary teacher preparation programs to dedicate twelve credit hours to reading instruction, including a three-credit course in phonics.

Dual-enrollment programs have long provided students with opportunities to take advanced courses and earn college credit during high school. This can give students a head start on college and possibly defray higher education costs by allowing them to earn a degree in less time.
Understanding the potential benefits, Ohio lawmakers revamped the state’s dual-enrollment program in 2015 and rebranded it College Credit Plus (CCP). The overhaul generally aimed to increase access to college-level coursework and encourage greater student participation. For instance, schools are now required to provide students with program information and counseling, and students as early as seventh grade may participate (previously, it had been limited to grades 9–12). Policymakers also encourage dual enrollment through the report card system, as districts receive points on the post-secondary readiness measure when students earn college credits. State officials routinely champion the program and tout its benefits.
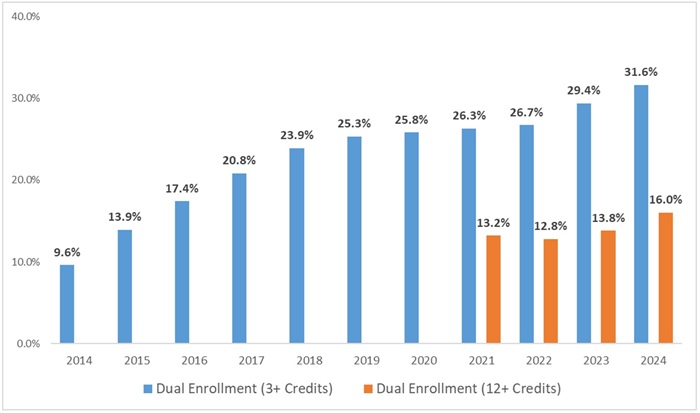
Buoyed by these policy developments, participation and attainment numbers have skyrocketed. Prior to 2015, roughly one in ten students earned at least three college credits through dual enrollment. Now, just over 30 percent of students exit high school with three or more credits, and about half that number—16 percent—earn almost a semester’s worth of college credit (twelve or more).
Figure 1: Percentage of students earning college credits via dual enrollment, graduating classes of 2014 to 2024
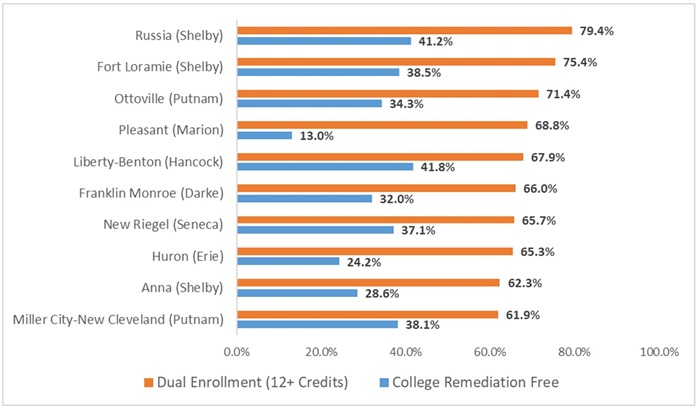
At first blush, the rapid rise of college credits being earned in high school might seem like cause for celebration, as more students are now earning credits that could put them on the fast-track to degrees. But there are also concerning signs in the data. In some districts, substantial numbers of students who are not actually “college ready” are participating in CCP and stockpiling college credits. Consider the figure below, which shows the ten districts with the highest percentage of students earning 12 or more credits, along with the percentage of students earning a remediation-free score on the ACT or SAT. These scores are established by the presidents of Ohio’s colleges and are based on research that relates scores to students’ likelihood of success in freshman-level coursework. We notice large disparities in the two rates. In Russia Local, 79 percent of its graduating class earned 12 or more dual-enrollment credits. Yet just 41 percent of the class met remediation-free standards. In Pleasant Local, 69 percent of students received nearly a semester of credit, even though a scant 13 percent achieved a remediation-free score.
Figure 2: Percentage of students earning 12 or more college credits versus college remediation-free rates, graduating class of 2024
What gives? How can students who haven’t met the remediation-free bar rack up so many college credits?
The answer lies in a policy loophole that allows non-college-ready students to participate in CCP. Under state law, students are eligible for the program if they achieve a remediation-free score on the ACT, SAT, or a handful of other alternative tests. So far, so good. Strict adherence to that entrance standard would ensure that only students who demonstrate clear academic readiness are allowed to take college-level courses. But here’s the twist: Under state administrative rules (authorized by statute), students can bypass exam-based standards and qualify for CCP based on their grade point average (GPA). Specifically, students are eligible if they have either a cumulative high school GPA of 3.0 or higher, or a 2.75–3.00 GPA and an A or B in a loosely defined “relevant high school course.”
In an era of rampant grade inflation, it’s not hard to imagine large numbers of marginally proficient students getting A’s and B’s, and thus qualifying for CCP through these alternative routes. This raises some thorny questions. Are CCP courses—mostly taken in high schools or online—truly college-level? Or are students taking courses that have been watered down for the sake of those who aren’t academically prepared, making them “college” classes in name only? And how will these students fare when they need to pass upper-level courses to complete their degree? Are we setting them up for failure if and when they continue their post-secondary education?
From the inception of CCP, Fordham has (unsuccessfully) urged more stringent eligibility requirements. Strong entrance standards would ensure the program is geared to academically prepared students and provides challenging, college-level content. Remember also that front-end requirements are especially critical in dual-enrollment settings because, unlike AP or IB programs, students are not required to pass a standardized exam at the end of the course to earn credit. Course credit in CCP hinges on the grades of teachers, who may not hold to rigorous standards.
Given that hundreds, possibly thousands, of non-college-ready students are availing themselves to CCP, Ohio policymakers should tighten eligibility requirements. One option is to simply remove the GPA-based alternatives and establish a strict college remediation-free standard based on exams. A more relaxed option might allow students to participate in CCP if they score within one standard error of the college remediation-free scores and have an unweighted high school GPA of 3.0 or above.[1]
Awarding college credit is serious business. It should be earned based on mastery of rigorous college-level material. But when non-college-ready students are racking up credits, it makes you wonder whether Ohio has set the dual-enrollment bar too low.
[1] This is a slightly modified version of Ohio’s earlier CCP eligibility requirements. In all variations of CCP policy, including the current one, students must meet a college’s admissions requirements, though these may not be very stringent for open-access two-year institutions.

On December 3, the Ohio Ethics Commission voted to require charter school governing board members to file full financial disclosure statements beginning in 2026. This move, unsurprisingly, has reignited a familiar debate about accountability in public education. Transparency in the use of public dollars is important, and Ohioans rightly expect strong ethical standards from anyone overseeing public institutions. As my Fordham Institute colleague correctly noted in press coverage of the decision, greater transparency for those overseeing public schools is generally a good thing.
But acknowledging the value of transparency does not mean ignoring a clear policy problem: Charter schools are being held to a higher standard than most traditional public school districts. Under Ohio law, only school board members in districts with more than 12,000 students must file financial disclosure statements. That means only board members in a dozen of Ohio’s more than 600 school districts face such a requirement. Yet charter school board members, many of whom are unpaid volunteers or receive only nominal compensation, will now be required to disclose their personal financial information.
If financial disclosure is an essential safeguard for taxpayers, it should be applied consistently across public education. Instead, this directive singles out charter schools based on governance structure rather than the public responsibilities that board members carry.
And in singling out charter schools, the Ethics Commission fails to apply logic consistent with how the legislature has chosen to treat school districts and educational service centers—namely, financial disclosure requirements only should apply to large educational institutions. Moreover, despite their existence for more than two decades, this marks the first time the Commission has applied the law in this manner to charter schools.
This disparate treatment is likely the result of charter schools often being described as “unaccountable.” While that claim doesn’t withstand even modest scrutiny, this is a good opportunity to remind everyone that charter schools are arguably the most accountable entity in Ohio’s public education system.
Let’s start with the basics. They administer the same state tests as district schools, and their academic results are publicly reported in exactly the same way. Their funding model is also more transparent and accountable: Charter schools receive state dollars only for the students they serve. When a student leaves, the funding leaves with them. Unlike districts, charters don’t have state funding guarantees or local property tax levies to buffer enrollment declines.[1]
Beyond the basics, charter schools face consequences that traditional school districts rarely do. Ohio law requires chronically-low-performing charter schools to close. Over the years, dozens of charter schools have been shut down for failing to meet academic or financial standards. District schools that post persistently weak results, by contrast, are almost never closed and often continue operating indefinitely.
Charter schools are also overseen by independent sponsors—state-approved entities responsible for monitoring academic performance, financial health, and legal compliance. Sponsors, like districts, have the power to intervene or close schools that are not meeting expectations. But unlike districts, sponsors themselves are evaluated by the state based on the outcomes of the schools they oversee and can lose their authority if they fail to hold schools to high standards. This gives them a clear incentive to act that does not exist in the district system.
None of this is an argument against transparency or accountability. In fact, it would be hard to find any entity in Ohio that has done more to strengthen charter school accountability than Fordham. While reasonable disclosure requirements can strengthen public trust, accountability policies should be grounded in fairness and consistency. Singling out charter school board members for broader disclosure—while exempting most district school boards—reinforces the mistaken perception that charter schools operate outside the public system or beyond oversight.
Charter schools are public schools. They educate Ohio children, use public funds, and are subject to stringent academic and financial accountability. Policymakers and regulators should stop looking for new ways to hold charter schools to standards that go above and beyond those applied to school districts. If Ohio believes stronger ethics disclosure rules are warranted, then the conversation should be about applying them evenhandedly across all public school governing bodies.
True accountability is not about imposing different rules on different types of public schools. It is about setting clear, consistent expectations—and holding everyone to them.
[1] Ten charter schools will receive a total of $3.2M in guarantee funding this year based as they fell below FY 21 per-pupil funding levels. This funding is not tied to or a shield from enrollment losses.

Researchers looking at the impacts of teachers union membership on schools have had an easier time focusing on finance-related outcomes—including former students’ earning power as adults—rather than academic achievement. While not the first research to do so, a new working paper exploits a natural experiment to try and overcome the non-random nature of union membership in order to examine student outcomes more directly.
In 2011, Wisconsin enacted Act 10, which effectively made union membership optional. The legislation also specifically curtailed public-sector unions’ collective bargaining rights and required them to hold annual elections to remain legally certified. Prior to Act 10, over 98 percent of Badger State teachers were union members. After its passage, that eventually dropped below 50 percent and roughly half of the state’s 400 union locals were not re-certified by public school teachers.
Morgan Foy, a researcher from the University of Illinois Urbana-Champaign, uses individual-level data on all public school teachers from the Wisconsin Department of Public Instruction (DPI) from 2006–2022. These include demographic characteristics, schools where they worked, and grades and subjects taught. He also was given access to de-personalized data on all public school students in the state over the same time period. These include demographics, attendance and disciplinary records, and standardized test scores for grades 3–8 and 10. Foy normalized exam scores to keep them consistent in the wake of test changes in various subjects and years of the study. DPI data began linking teachers and their students in 2017, thus Foy is able to create a classroom-level teacher value added measure from that point. Union re-certification election results came from the Wisconsin Employment Relations Commission and teacher survey data regarding union membership came from NCES.
Importantly, the methodology hinges on two timely but unrelated developments. The first is that, while Act 10 eventually affected all of public education, implementation dates varied across districts because changes only kicked in when an active collective bargaining agreement ended and a new one began. The second is that, starting in January 2016, state law required all union dues to be itemized as part of reporting by political action committees. This allowed for precise data on who was and wasn’t a union member, a level of detail that was previously unavailable.
As a preliminary finding, Foy reports that higher-performing teachers, as measured by value added, are less likely to remain union members relative to their lower-performing peers after union decertification, keeping in mind that individual teachers could still opt to be union members even if their local organizations were decertified. Relatedly, he finds no difference in who opts in and who opts out of union membership by value-added score when they have this choice. “This is consistent,” he concludes, “with the idea that lower-performing teachers value the representation benefits that unions provide relatively more than higher-performing teachers.”
Exploiting the staggered decertification process experienced by local teachers’ unions over time, Foy finds positive impacts on student outcomes in districts with less union membership compared to districts with more membership. Specifically, by three years after decertification, student test scores in math, English language arts, science, and social studies increased by over 5 percent of a standard deviation, and student attendance increased by roughly 1 percent (in average days attended) five years after decertification. Additionally, Foy determines that these benefits are not due to changes in the composition of the teaching force following a loss of union representation, as he found no evidence of differences in teacher turnover rates with or without decertification. Rather, his value-added analysis indicates that teachers who were employed both pre- and post-decertification increased their productivity in decertified districts compared to districts whose union membership remained stable.
Foy concludes from his unique analysis that ending “union protections” for teachers results in direct academic and nonacademic benefits for students. Unfortunately, the mechanisms at work are unclear. (It’s definitely not increased teacher pay or more classroom inputs, as the data available indicate neither of these occurred in districts where unions were decertified.) Instead, Foy surmises that “union efforts to insulate workers may adversely affect the quality” of teaching from the start. And only by ending the union representation system will many teachers reach their full productivity and quality.
SOURCE: Morgan Foy, “Selection and Performance in Teachers’ Unions,” NBER Working Paper (October 2025).

The vast majority of teachers in K–12 public schools are female, including over 85 percent of those in the elementary grades. Amid ongoing concerns that boys are struggling in school, one proposed solution is to recruit more male teachers. But does gender matching of students and teachers really benefit kids? A new working paper aims to find out, focusing on elementary grade levels.
Theorizing that some previous research on the topic had been limited in scope—and thus unable to reach any concrete conclusions—a team of researchers led by Eric Hengyu Hu of the State University of New York at Albany worked to construct the strongest possible methodology. This included a nationally-representative sample of students, multi-year tracking, an examination of both academic and non-academic outcomes, and controls for a number of potential confounding variables. Data came from NCES’ Early Childhood Longitudinal Study, Kindergarten Class of 2010-11 (ECLS-K: 2011). Researchers observed this nationally-representative cohort of students—4,080 boys and 3,890 girls—through the end of fifth grade. For academic outcomes, data included individually administered, untimed, “psychometrically well-validated” measures of reading, mathematics, and science achievement. Non-academic outcomes were two-fold: behavioral ratings, as provided by teachers via the Social Skills Rating System (SSRS); and executive function ratings, assessed by NCES field staff as part of ECLS-K protocol. It is, unfortunately, not noted anywhere in the report how many male or female teachers were observed.
For the full sample, the researchers observed no statistically significant effect of student-teacher gender matching on students’ academic achievement, social-behavioral, or executive functioning. Girls taught by female teachers did receive higher ratings on interpersonal skills and approaches to learning, two subcategories of SSRS, but all other outcomes showed null effects. Boys taught by male teachers showed null effects across the board. Breaking down the findings by race and ethnicity revealed a significant boost in the area of cognitive flexibility (one aspect of executive functioning) for Black girls taught by female teachers and Asian boys taught by male teachers. However, significant negative effects were also found for Black girls (lower science achievement) and Asian boys (reduced interpersonal skills).
Study co-author Paul Morgan said in an interview that he was surprised by the findings. “I’ve raised two boys and my assumption would be that having male teachers is beneficial because boys tend to be more rambunctious, more active, a little less easy to direct in academic tasks.” Indeed, one well-known analysis focusing on eighth grade students showed that having a female teacher benefitted girls and disadvantaged boys in science, social studies, and English, and created a gender gap that was 8 percent of a standard deviation. However, the author concluded that some of this effect might have occurred in previous years, depending on the gender matching (or lack thereof) in early grades.
Morgan, Hu, and their fellow researchers conclude similarly in their report that, “rather than providing definitive evidence of ‘no effect,’” their findings highlight the need for even larger samples, more outcomes to measure, and even more controls for confounding variables such as changes in parental involvement over time, peer composition, or classroom assignment processes over time. The need for additional study is especially true since the mechanisms at work are likely indirect—such as role modeling and reduction of teacher perception bias. “We’re not saying gender matching doesn’t work,” Morgan added. “We’re saying we’re not observing it in K through fifth grade.” But they haven’t stopped looking.
SOURCE: Eric Hengyu Hu, et al., “Fixed Effect Estimates of Teacher-Student Gender Matching During Elementary School,” working paper, accessed via ResearchGate (November 2025).

By Aaron Churchill and Michael J. Petrilli
America is wasting much of its human capital. That’s because many high-achieving, low-income students—we call them HALO students—fall off the education track and never reach the gates of our top colleges and universities. Regrettably, these capable young people won’t reap the benefits of a four-year degree, which remains a solid engine for upward mobility and career success. Their families, communities, and states won’t benefit from maximizing their capabilities. This represents a tragic loss of potential, while also leaving our best colleges and—later—our most promising occupations bereft of socioeconomic diversity and looking less like the nation writ large.
We at the Thomas B. Fordham Institute have long been troubled by this leaky pipeline from K–12 to higher education. Through various empirical studies, we have drawn attention to the disappointing outcomes of high achievers from less advantaged backgrounds. We have also worked to develop and widely share policies and practices that would help more high achievers reach their full potential.
The present study builds on those efforts to strengthen advanced education in U.S. schools, both generally and the Buckeye State particularly. We commissioned Ohio State University professor and Fordham research fellow Stéphane Lavertu to focus on the educational experiences and outcomes of HALO students in Ohio. His analysis addresses three main questions:
To examine these questions, Dr. Lavertu used anonymous student-level records to study the trajectories of HALO students from elementary school into college (in and out of state).[2]
Key findings
This report presents irrefutable evidence that Ohio’s HALO students are underserved by most school systems, and that too many fail to reach college after high school. Compared to similarly scoring students from more affluent backgrounds, Ohio’s HALO students are:
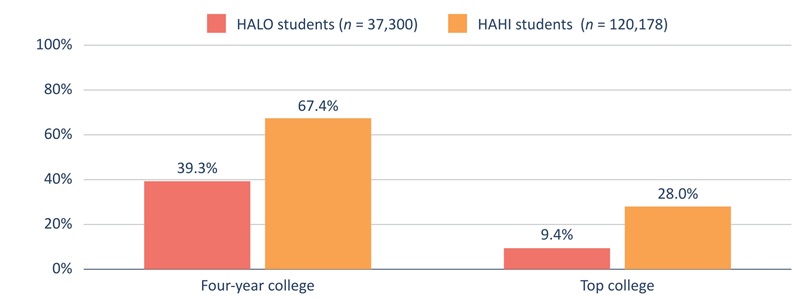
This systemic neglect has ramifications for their college-going. Figure A shows that only two in five HALO students enroll in any four-year college within two years of high school, and fewer than one in ten attends a top college. These college-going rates are far lower than those of high-achieving, high-income (HAHI) students. Specifically, Ohio’s HALO students are 42 percent less likely to attend a four-year college and 66 percent less likely to attend a top college than their similarly-scoring but more affluent peers.[3]
Figure A. HALO students attend college at much lower rates than their more affluent, similarly-scoring peers.
Underscoring how leaky this pipeline is for HALO students, consider this: While they are outnumbered 3-to-1 by their more affluent counterparts in the top achievement quintile in third grade, a decade later they are outnumbered 6-to-1 in four-year colleges and a staggering 10-to-1 in top colleges.
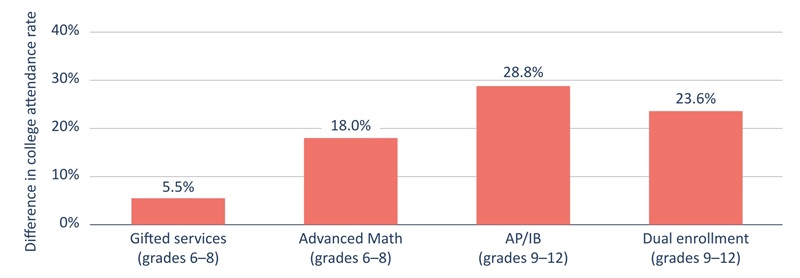
What would keep more HALO students on-track for college? Figure B shows that AP or IB and dual-enrollment course-taking during high school makes a difference in their college-going prospects, as do advanced math courses during middle school and gifted services in English language arts or math. For instance, HALO students who completed an AP or IB course had four-year college-going rates that are 29 percentage points higher than HALO students who did not complete such courses. These results provide compelling evidence that advanced learning opportunities are critical to keeping students on a college pathway.[4]
Figure B. HALO students who participate in advanced learning opportunities have higher four-year college attendance rates than HALO students who do not.
Policy implications
What should state and local policymakers do? Many solid recommendations were recently made by a national working group on advanced education, which can be found in a recent Fordham report. Here, let us highlight five ideas.
HALO students have demonstrated their potential to reach college and use it as a springboard to the American dream. Yet due to the widespread neglect of their talents, our education system allows too many of them to fall through the cracks. There is a clear pathway that can better nurture HALO students. It includes early identification and acceleration in elementary school, access to advanced math coursework starting in middle school, and enrollment in high schools with strong college-prep curricula and college-going cultures. The playbook is there. Now the question is whether states and school systems can execute and give HALO students the challenge and rigor that prepares them to compete for spots at our top universities.
Ohio has a large store of untapped human potential. Every year, thousands of students with exceptional academic ability—many from low-income households—fall off the path to college, missing out on opportunities to improve their economic well-being and, consequently, the prosperity of their families and fellow Ohioans. This report examines Ohio’s public-school pipeline to college, particularly for high-achieving low-income (HALO) students, and identifies the characteristics of districts and high schools that are most effective at getting these students into four-year colleges and universities.
The analysis defines HALO students as those who qualify for free or reduced-price lunches and whose state test scores put them in the top 20 percent of Ohio students (as of third grade or eighth grade, depending on whether the focus is on districts or high schools). It first provides a descriptive look at these students, comparing their demographic attributes and college attendance rates with those of high-achieving peers who do not qualify for free or reduced-price lunches. The analysis then employs statistical techniques to estimate “college-going value-added” for the Ohio districts in which HALO students reside and the specific high schools (including charter and STEM schools) they attend. Those estimates capture the extent to which students in a district or school exceed (or fall short of) average rates of college attendance among students with similar characteristics. Using these value-added[5] estimates, the analysis then examines factors that might explain the relative success of some districts and high schools in getting HALO students into college. Finally, the study focuses on how taking advanced coursework in middle and high school relates to HALO students’ college-going. Below are some of the most noteworthy findings.
First, there is evidence of a “leaky” pipeline to college for HALO students:
Second, the analysis indicates that some districts and high schools provide HALO students with a bigger boost—they provide greater “college-going value-added”—and that there are commonalities between these high value-added districts and schools:
Finally, comparing HALO students who took advanced coursework or received gifted services with similar HALO students who did not, the analysis reveals major differences in college-going:
The results suggest that Ohio could better support its high-achieving low-income students by expanding their access to advanced coursework and high-achieving peers throughout the K–12 pipeline. Early interventions, so that students are ready to enroll in algebra by eighth grade and to enroll in AP coursework during high school, appear to be effective pathways to get HALO students into top colleges and universities. Expanding students’ schooling options, such as establishing selective-enrollment magnet schools and increasing districts’ participation in Ohio’s open enrollment program, could help families and schools overcome resource constraints that prevent them from providing HALO students with advanced coursework and access to high-achieving peers. Indeed, selective high schools located in city districts are some of Ohio’s most effective at getting HALO students into college. Offering families more help in navigating these and other school options, such as Ohio’s Educational Choice Scholarship Program (EdChoice), would likely further enhance their benefits.
Research indicates that the rapid growth in U.S. postsecondary education during the twentieth century increased incomes while reducing socioeconomic inequality. The college-going wage premium—the difference in income between those who attend at least one year of college and those who do not—remains substantial, but it no longer benefits low- and high-income students equally.[6] By the end of the twentieth century, the premium had increased for high-income students while shrinking for low-income students—what Zachary Bleemer and Sarah Quincy (2025) call “collegiate regressivity.”[7] Their analysis indicates that 80 percent of collegiate regressivity is due to low-income students disproportionately selecting into community and for-profit colleges, the divergence in quality between research-based universities and the teaching-focused colleges where low-income students tend to enroll, and higher-income students shifting their studies toward computer science and engineering.
That high-achieving students—whether rich or poor—might fail to attend and graduate from a high-quality postsecondary institution harms us all. The best available research indicates that human capital—individuals’ productive capacity—explains at least half of income differences across countries, that schooling is effective at developing human capital, and that today’s labor market increasingly favors higher-order thinking skills, such as problem-solving.[8] Research suggests that the college wage premium doubles throughout graduates’ careers because college is a gateway for individuals with strong cognitive skills to access nonroutine occupations associated with high wage growth.[9] Evidence also indicates that universities play an important role in delivering general economic benefits by developing students’ productive capacities and generating innovations that benefit their communities.[10] Failing to capitalize on the talents and potential of high-achieving students has an especially negative impact, as their forgone lifetime income is greater and society misses out on more economic growth.
Some barriers to HALO students’ college-going are easier to address than others. As James Coleman concluded decades ago, families’ socioeconomic circumstances have a large impact on their children’s performance in school, as does the performance of their peers.[11] For example, disruptive peers have been shown to have substantial negative impacts on students’ college-going and future earnings.[12] In a recent study using exceptionally rich data, economist Raj Chetty and his colleagues determined that kids’ economic connectedness—the extent to which low-income kids interact with higher-income kids—is a strong predictor of whether low-income kids improve their economic standing down the road.[13] They also find that schooling is a determinant of economic mobility for low-income students in part because schools facilitate connectedness between low- and high-income students.[14] Thus, a serious analysis of the postsecondary pipeline for HALO students must consider the potential impact of their residential and school peers.
By third grade—the starting point of our analysis below—socioeconomic inequalities are largely baked into student achievement.[15] And rigorous research indicates that increased spending on schools has, on average, a modest impact on student achievement and attainment.[16] Yet schooling, including how money is spent on it, matters a great deal after third grade. For example, there is strong evidence that providing AP coursework causes increased college attendance and success.[17] This is consistent with a larger body of research documenting that AP coursework and, to a lesser extent, dual-enrollment options are highly predictive of college-going.[18] Research also indicates that the entire pipeline of coursework, back to elementary school, can affect college-going.[19] For example, taking algebra in eighth grade can substantially increase the probability that students take and succeed in advanced math coursework in high school, provided that they are sufficiently high-achieving students at the end of seventh grade.[20]
Preparing HALO students to participate in this advanced coursework is a significant challenge, as one must contend with some of the broader social forces noted above. But research also demonstrates that much can be gained by simply providing options and advising students and parents. For example, recent randomized controlled trials—the “gold standard” for estimating causal effects—have demonstrated that advising low-income high-school students to enroll in higher-quality colleges and universities can significantly increase their bachelor’s degree attainment.[21] Such advising decisions work further down the pipeline, as well, such as when schools directly enroll high-achieving seventh graders into eighth-grade algebra.[22]
When schools lack the capacity to provide the requisite coursework, instructors, and advising, HALO students could benefit from options such as selective magnet schools, private schools, or schools in another district. For example, research has demonstrated that charter schools and private-school vouchers can yield substantial educational benefits for low-income students, in terms of both achievement and attainment.[23] Importantly, these studies indicate that such benefits can accrue to both the students using those options and, via competitive effects, the students who remain in district schools. Rigorous studies of selective exam schools have often found null impacts on student test scores, but recent research suggests that may be because such schools are delivering educational benefits on dimensions not captured by tests.[24] That also appears to be the case with other school options, as evidenced by a recent study documenting higher rates of college-going among students who participated in Ohio’s EdChoice private-school scholarship program than among similar students who did not participate in the program.[25]
This literature review shows several paths through which communities and schools might affect the college-going of HALO students after third grade. The analysis below considers most of the above factors to some extent when examining the district- and school-level predictors of HALO students’ pursuit of higher education at four-year colleges and universities. It explicitly accounts for broader social forces that affect both school and home life (the affluence and achievement of students’ residential district and school peers), public investments in schools (spending per pupil), access to alternative schooling options that might better match students’ needs and generate competitive effects (student enrollment in charter schools and eligibility for private-school vouchers), and school inputs such as advanced coursework and services for students identified as gifted. Importantly, the focus is on factors that lead students to attend four-year colleges and universities—especially top colleges that serve similarly talented students—as research indicates that these institutions are most likely to help HALO students reach their academic potential.
The analysis begins with a look at the attributes and education trajectories of low-income students in Ohio who were high-achieving third graders between the 2008–09 and 2013–14 school years. It compares their attributes and education trajectories with those of the average Ohio student, as well as those of similarly high-achieving but wealthier students. Consistent with past Ohio research—and to ensure the sample of students is large enough to conduct the analysis that follows—“high-achieving student” is defined as one whose average score on Ohio’s third-grade tests in English language arts (ELA) and mathematics was in the top 20 percent statewide.[26] Whether students were eligible for free or reduced-price lunches during that third-grade year serves as a proxy for income to identify whether students are high-achieving low-income (HALO) or high-achieving high-income (HAHI).[27] The analysis uses third grade as the baseline because that is the earliest point of the public-school pipeline for which student achievement data are available.
Baseline Characteristics of Ohio’s HALO Students
Table 1 reveals that only 25 percent of Ohio’s high-achieving third graders are low-income (5 of the top 20 percent) and that HALO students are approximately five times more likely to be Black or Hispanic than their wealthier high-achieving peers. Put differently, by third grade, academic achievement already diverges significantly by students’ household income and race. These results are not surprising, as research has long demonstrated that education gaps by income and race have largely set in by third grade. Thus, the analysis in this report is about what benefits a HALO student’s residential district or high school might provide after family, community, and schooling environments have significantly shaped their early childhood development. It does not address how earlier interventions might boost the proportion of low-income kids who are high-achieving third graders.
Table 1. Characteristics of HALO and Other Students in Third Grade between 2008–09 and 2013–14
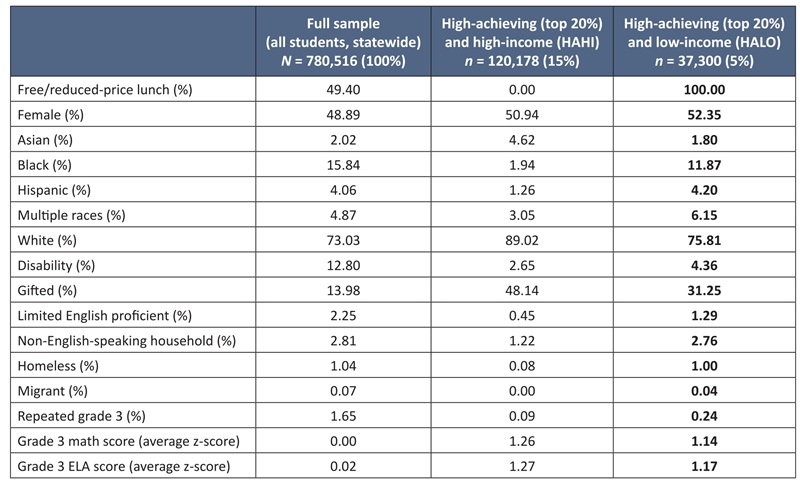
Table 1 also indicates that HALO students’ test scores in grade 3 are 10–20 percent of a standard deviation lower than that of their higher-income peers (1.1 and 1.2 standard deviations above the average math and ELA score, respectively, as opposed to 1.3 standard deviations above the average score). This difference in achievement might appear to explain their being identified as “gifted” (in any area) at significantly lower rates (31 percent compared with 48 percent).[28] However, as the analysis below demonstrates, the differences in baseline test scores between HALO and HAHI students are not sufficiently great to account for significant differences in these students’ current and future schooling experiences.
A Leaky Pipeline: College-Going Among Ohio’s HALO Students
Table 2 provides comparisons like those in Table 1 but focuses on measures of students’ future educational attainment. It indicates that the HALO students identified above are only somewhat less likely than their wealthier peers to receive a high-school diploma (82 percent compared with 87 percent) but are far less likely to attend college (two- or four-year) within two years of graduating high school (52 percent compared with 76 percent). HALO students’ rates of college attendance are only marginally greater than those of the average Ohio student. Note that these percentages understate college-going rates because of data limitations (for example, students exiting public schools after third grade would be identified as not having graduated or attended college), but they nonetheless illustrate the disparities between HALO students and their wealthier peers.[29]
Table 2. Educational Attainment of HALO Students and Other Students (Grade 3 Cohorts from 2008–09 to 2013–14)
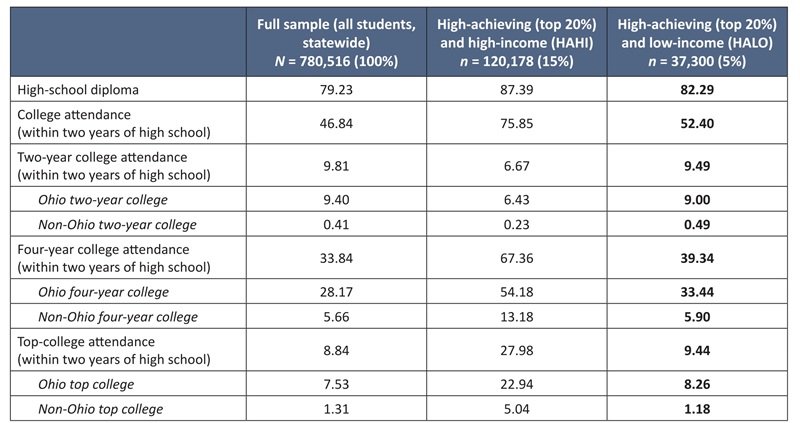
Comparing overall rates of college-going understates the severity of the situation, however. HALO students have the academic potential to excel at top four-year colleges, which this study defines as those where incoming classes have average ACT and SAT scores in the top 20 percent of the Ohio score distribution.[30] Although HALO students are twenty-four percentage points less likely to attend any college than their wealthier high-achieving peers (a rate of college-going that is 31 percent lower than HAHI students’ rate), they are twenty-eight percentage points less likely to attend a four-year college (a rate that is 42 percent lower) and nineteen percentage points less likely to attend a top college (a rate that is 66 percent lower) than their wealthier peers.
In other words, HALO students’ college-going rates fall increasingly short as a percentage of the rate of their wealthier peers as the degree level (two-year versus four-year) and selectivity increase. The statistics in Table 2 imply that if HALO students’ college-going rates matched those of their peers from wealthier households, 1,742 more HALO students would enroll in a four-year college every year—and 1,153 of those students would enroll in a top college or university.
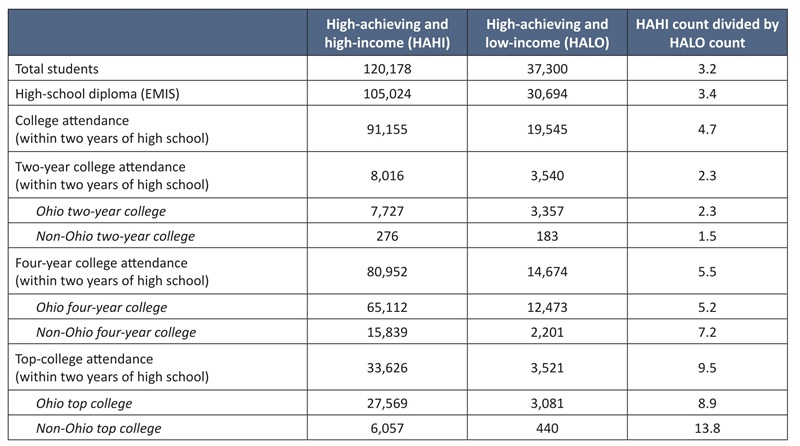
Another way to characterize this “leak” in the public-school pipeline to college is to consider differences in student counts, as one can then consider how overrepresented one group is over another at each attainment level. The third column of Table 3 (below) reveals that wealthier high-achieving students outnumber HALO students 3-to-1 in third grade, but HALO students are later outnumbered nearly 6-to-1 at four-year colleges and nearly 10-to-1 at top colleges. In other words, the greater the postsecondary attainment level—two-year, four-year, or top college, in that order—the greater the extent to which HALO students’ wealthier peers outnumber them.
Table 3. Educational Attainment of HALO Students and Other Students (Grade 3 Cohorts from 2008–09 to 2013–14)
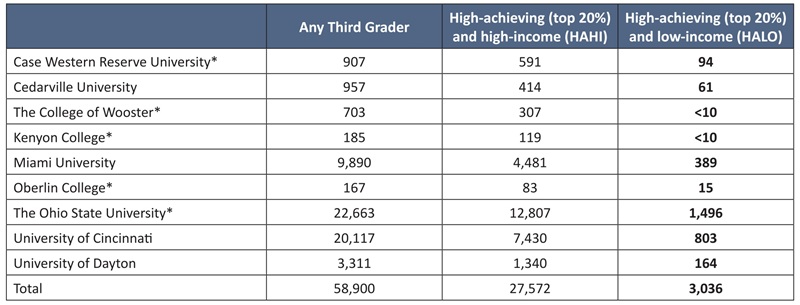
The tables above also indicate that HALO students are more likely to attend college within Ohio than their wealthier high-achieving peers—which is to be expected, given the costs associated with higher education. Table 4 (below) provides more information on the top Ohio colleges and universities that HALO students attend. It indicates that 58,900 of the 780,516 public-school students in third grade between 2008–09 and 2013–14 ultimately attended top Ohio colleges and universities. The table illustrates that HALO students are heavily outnumbered at all of Ohio’s top colleges and universities and that 75 percent of HALO students (2,299 of 3,036) attend the main campuses of just two schools: The Ohio State University and the University of Cincinnati.
Table 4. Attendance at Top Ohio Colleges (Grade 3 Cohorts from 2008–09 to 2013–14)
Potential Source of the Leak: Advanced Coursework and Gifted Services
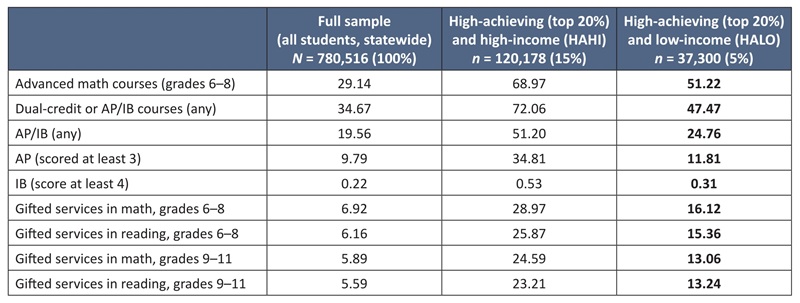
HALO students’ rates of participation in advanced coursework and gifted services provide some suggestive evidence of how schools may be contributing to the leaky public-school pipeline described above. Table 5 indicates that HALO students’ enrollment in high school–level math courses (primarily algebra) while in middle school is eighteen percentage points lower than the enrollment rate of their wealthier peers. The divergence in advanced coursework is even greater in later grades. The rate at which HALO students enroll in AP, IB, or other dual-credit college courses (as part of Ohio’s CCP program) while in high school is twenty-five percentage points (34 percent) lower than the rate of their wealthier high-achieving peers. And HALO students are approximately twelve percentage points (44 percent) less likely to receive gifted services in English language arts or math in middle school or high school.[31] These statistics imply that if HALO students took advanced coursework at the same rate as their wealthier high-achieving peers, then 1,103 more HALO students in a given third-grade cohort would ultimately take high school–level math courses during middle school and 1,644 more HALO students would take at least one AP course in high school.
Table 5. Courses Taken by HALO Students and Other Students as Percentages of the Respective Samples (Grade 3 Cohorts from 2008–09 to 2013–14)
This portion of the analysis examines how much the districts where HALO students live affect their probability of attending college. Focusing on where students live, as opposed to which schools they attend, has several benefits. First, one can consider the broader ecosystem that influences third graders’ future college-going, beyond school-specific inputs. Factors include the affluence and academic performance of their residential peers and the availability of publicly funded school options beyond district schools. For example, charter schools affect the educational outcomes of students who attend them, of course, but they also affect students attending traditional district schools that must compete with these alternatives.
A second benefit of focusing on HALO third graders’ district of residence is that doing so makes it straightforward to analyze the factors that predict college-going. The elementary schools students attend vary significantly in terms of grades served and governance structures, making it difficult to identify a broad set of comparable metrics and to attribute college-going to particular schools. For example, some students attend K–4 schools that could influence their future trajectories for just one more year, whereas others attend K–12 schools that could shape their futures straight through to graduation. But all third-grade HALO students reside in districts that serve students through twelfth grade.
The analysis below uses statistical estimates of “college-going value-added” to characterize districts’ impacts on the probability that HALO students attend college. These estimates capture the extent to which students in a district exceed (or fall short of) average rates of college attendance for students with similar characteristics. Generating these estimates first requires calculating for each student their expected probability of attending college based on their third-grade achievement levels and attributes such as parents’ income level, sex, race, and whether they were identified as gifted, homeless, a migrant, residing in a non-English-speaking household, having repeated third grade, having an individualized education plan (IEP), or having limited English proficiency. Then, for each district, one calculates the difference between the actual rate of college-going for those students and the expected (average) rate of college-going for students with similar characteristics.[32] The analysis focuses on attendance at any four-year college and, in particular, more selective top colleges, as these are institutions that HALO students have the academic potential to attend and that would likely best enable them to realize their potential.[33]
Note that the analysis below is primarily concerned with identifying district-level factors—including those related to peer characteristics, school spending, and the availability of advanced coursework and gifted services—that predict the extent to which a district’s HALO students attend college (relative to expectations based on averages for students with similar characteristics). This portion of the analysis is thus about assessing how the broader ecosystem in a HALO student’s district of residence predicts their college-going, as opposed to estimating the causal impact of the specific schools they attend or the coursework they take. Analyses in subsequent sections of this report consider the impact of schools and coursework more directly.
Districts’ College-Going Value-Added for HALO students
Before examining patterns in the college-going value-added of residential school districts across Ohio, there are some important facts to consider about the value-added estimates. First, the value-added of districts in which students reside explains to a significant degree the gap in college-going between HALO students and their wealthier high-achieving peers. Most notably, 37 percent of the gap in attendance at top colleges between HALO students and their wealthier high-achieving peers is attributable to these students residing in different districts, as opposed to HALO students and their wealthier high-achieving peers in the same district attending college at different rates.[34] In short, the district in which students reside appears to matter considerably—particularly when it comes to attending top colleges and universities.
Second, college-going value-added estimates reveal that districts that serve as effective pipelines for Ohio’s average student also serve as effective pipelines for HALO students. Figure 1 plots districts’ college-going value-added for HALO students against their value-added for all students, focusing on the 355 (of 615) Ohio districts in which at least ten HALO students resided while in grade 3 from 2008–09 through 2013–14.
Figure 1. HALO College-Going Value-Added (VA) and Overall College-Going VA (Grade 3 Cohorts from 2008–09 to 2013–14)
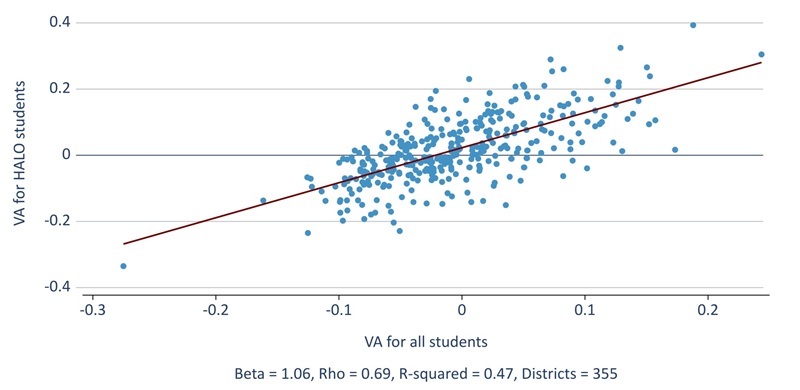
The figure reveals that districts where the average student’s probability of attending a four-year college is ten percentage points above expectations (0.10) are those where, on average, HALO students’ probability of attending college will also be approximately ten percentage points above expectations based on their grade-3 characteristics (the slope, beta, is just about 1.0). The correlation coefficient is 0.69, just below the cutoff of 0.7 often used to characterize a statistical relationship as “strong.” Put differently, the R-squared coefficient indicates that a district’s college-going value-added for the average student “explains” 47 percent of the variation in its college-going value-added for HALO students. That districts that are effective postsecondary pipelines for the average student also tend to be effective for HALO students is important, as the value-added measures based on all students are more precise and available across all Ohio districts (in other words, even if they educate fewer than ten HALO students). On the other hand, as the analysis below indicates, the districts and schools that provide the biggest boost to HALO students have distinguishing characteristics—particularly when it comes to getting them into top colleges and universities.
SIDEBAR 1: Link Between Test-Score Value-Added and College-Going Value-Added
Most education research focuses on schools’ impacts on student test scores. One potential concern is that districts’ and schools’ test-score value-added does not correspond to their college-going value-added. After all, although schools may be able to impart cognitive skills captured by test scores, they may not impart “non-cognitive” behavioral skills necessary for college attendance and graduation. For example, a recent analysis using a rigorous design found that participation in gifted programming increased rates of college-going among disadvantaged boys with high cognitive ability. It appears to have done so by improving their non-cognitive skills (as evidenced by their course-taking and grades) while having no impact on their test scores.[35] On the other hand, studies have shown that schools’ impact on student test scores (as measured by test-score value-added) is a relatively strong predictor of college enrollment.[36]
Estimating districts’ and high schools’ test-score value-added involves the same procedure as estimating their college-going value-added, except that the outcome of interest is a test score from (near) the end of a student’s K–12 schooling experience, as opposed to their college-going. For districts, one first estimates students’ expected end-of-schooling test scores based on the average for students with similar third-grade test scores and other attributes. The estimated district test-score value-added is the difference between their actual score average and the expected score average. The procedure is the same for high schools, except that student characteristics in eighth grade are used to generate expectations based on averages for similar students. To capture as much K–12 schooling as possible, the analysis here focuses on districts’ test-score value-added on the ACT or SAT. Students primarily take these tests in eleventh grade, and there is solid coverage across Ohio students.[37]
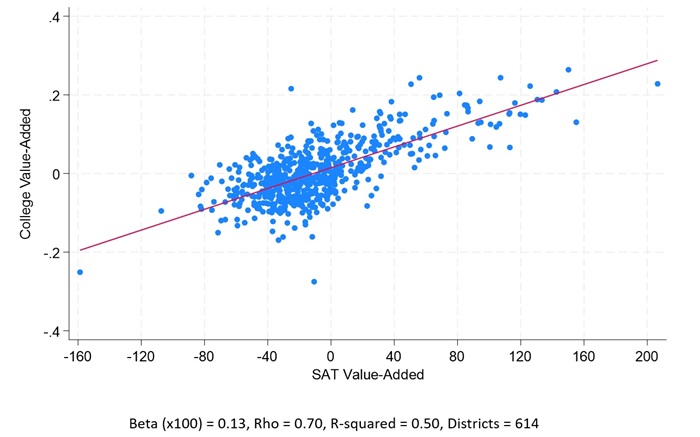
Figure S1 (below) illustrates the correlation between districts’ test-score value-added on the ACT or SAT—reported on an SAT scale, such that the highest possible score on the exam is 1600. The figure indicates a strong relationship between a district’s estimated value-added for college-going and its estimated value-added with respect to college admissions exams. Specifically, it indicates that a 100-point increase in a district’s SAT value-added corresponds to an increase of thirteen percentage points in its college-going value-added for four-year colleges.[38]
Figure S1. College-Going Value-Added Versus SAT/ACT Value-Added (SAT Scale)
The correlation is similar but not quite so strong if one estimates value-added using Ohio’s eighth-grade math or ELA tests or end-of-course exams in algebra (primarily ninth grade) or ELA 2 (primarily tenth grade). The results are similar when the focus is on the value-added of high schools.
District Attributes That Predict College-Going Value-Added for HALO Students
The research reviewed earlier in this report summarized the range of factors that might bear on HALO students’ education and life outcomes, including the socioeconomic factors affecting them in and out of school and the quality of their school options. The analysis in this section examines the predictive value of such factors—including peer affluence, peer achievement, district spending, the availability of advanced coursework and services, and the availability of alternative schooling options, including charters and private-school vouchers—using reasonable (though imperfect) proxies captured at the district level at the time students were in third grade (2008–09 to 2013–14). In other words, these variables should capture the district conditions at the third-grade baseline and do not measure students’ actual experiences as they progressed through school. That is why these factors are characterized as district-level “predictors” of students’ future college-going (net of expectations based on students’ characteristics).
The district-level predictors include the standardized fraction of students residing in a district who are not eligible for free or reduced-price lunches (“peer affluence”)[39]; the standardized average of third-grade test scores among students residing in the district (“peer achievement”); the standardized spending per pupil in district schools; the average of the standardized fraction of students enrolled in charter schools and the standardized fraction of students eligible for private-school vouchers (“school options”); and the average of the standardized fraction of students taking high-school math courses in grades 6–8 and the standardized fraction of students receiving gifted services in ELA or math in any grade (“advanced courses and services”). These variables are standardized so that the magnitudes of their relationships to district value-added are directly comparable in each figure below (but not between figures). The relationships between these district-level attributes and residential districts’ value-added is estimated using basic regression models that include all attributes at once, such that the estimate for any given attribute is based on holding the others constant.[40]
Figure 2 (below) presents the estimates with respect to value-added at four-year colleges and universities. It reveals that peer achievement is by far the strongest predictor of college-going value-added for HALO students. Going from an average district to one with test scores one standard deviation above average (equivalent to a district’s average student going from approximately the fiftieth percentile to approximately the sixtieth percentile on the third-grade test-score distribution) corresponds to a 3.5-percentage-point increase in the probability that district students attended a four-year college within two years of graduating high school.[41] Notably, spending per pupil, peer affluence, the proportion of district students taking advanced math courses or receiving gifted services in ELA or math, and the availability of school options have no statistically significant predictive value.[42] In other words, having high-achieving peers—and the family, community, and school factors that contributed to their high achievement leading up to third grade—appear to have outsize effects on students’ future college-going.
Figure 2. Predictors of Districts’ Value-Added for Four-Year Colleges
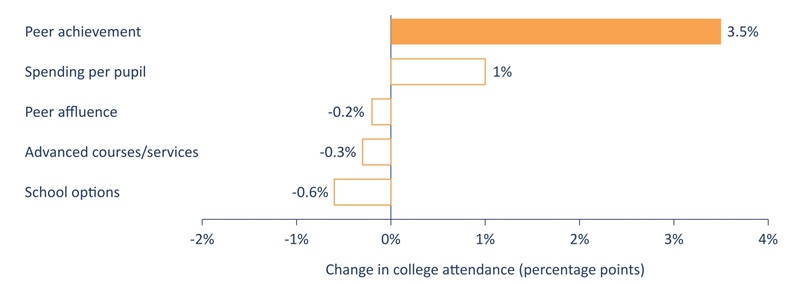
The predictive value of achievement is similar whether or not one controls for the other factors. It’s important to note, however, that the results in Figure 2 are partly attributable to the analysis’s putting more weight on districts that enroll more HALO students. Consistent with research reviewed earlier in this report, the primary predictor of college-going value-added for the average Ohio student is the affluence of residential peers—that is, the percentage of students who do not qualify for free or reduced-price lunches—with peer achievement as the second-strongest predictor (see Table D2 in Appendix D). The divergence in results could be because peer affluence does not alter HALO students’ probability of college attendance after third grade (which is what Figure 2 implies, although it may still play a significant role in driving peers’ third-grade achievement). But it could also be because the measure of peer affluence does not vary sufficiently among the districts that HALO students attend, meaning there is relatively little opportunity to observe its effects. Relatedly, peer affluence is not measured as precisely as peer achievement. There is significant variation in household income even among students who qualify for free meals, and this unmeasured variation could in fact matter for HALO students.
What one can say is that based on available data and an analysis focused on altering HALO students’ college trajectory after third grade, peer achievement is the strongest predictor of college-going value-added across the districts where HALO students are concentrated. One can reasonably conclude, therefore, that whether district peers are high-achieving is the best predictor of whether a HALO student’s district will serve as an effective pipeline to a four-year college. But there is also good reason to suspect—based on past research and the analysis of college-going for the average Ohio student—that HALO students would also benefit from residing in districts with wealthier peers for reasons other than their achievement level.
Figure 3 (below) presents the results of a similar analysis but focuses on attendance at top colleges—the outcome for which a student’s district of residence (or attendance) most greatly influences the gap in college-going between HALO students and their wealthier high-achieving counterparts (see prior subsection of this report).[43] Notably, peer achievement is no longer a significant predictor of college-going value-added. Figure 3 reveals that when one focuses on HALO students attending top colleges, the significant predictors are the availability of and participation in alternative schooling options and coursework or services for advanced students.
Figure 3. Predictors of Districts’ Value-Added for Top Colleges
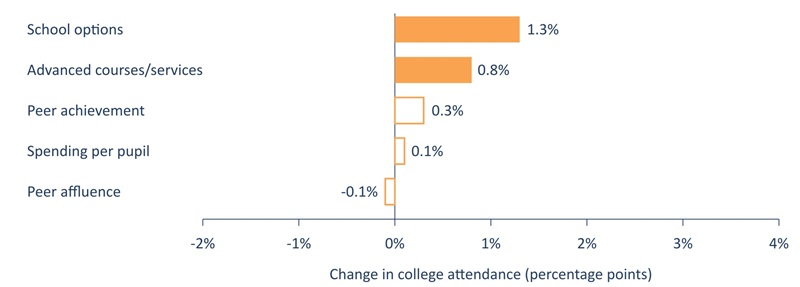
Specifically, the results in Figure 3 indicate that a one-standard-deviation increase in the proportion of district students attending charter schools or eligible for private-school vouchers corresponds to a 1.3-percentage-point increase in the probability that a district’s students attend a top college within two years of graduating high school. The results also indicate that students in districts with higher rates of enrollment in gifted services in ELA and math or in advanced math coursework in grades 6–8 have a 0.8-percentage-point higher probability of attending a top college. Note that disaggregating the impacts of advanced math coursework and gifted services (which often consists of advanced coursework), as well as charter school enrollments and rates of voucher eligibility, reveals that these results are driven primarily by rates of charter school attendance and gifted service provision (see Table D3 in Appendix D). The average attendance rate at a top college is 9 percent for HALO students, so the combined “impact” of a one-standard-deviation increase in school options, advanced math coursework, and gifted services (1.3 plus 0.8, a 2.1-percentage-point increase) is a 24 percent increase in the probability that HALO students residing in a district attend a top college.
One cannot directly compare the estimates in Figure 2 and Figure 3, as they are based on different effective samples of students.[44] For example, the analysis of value-added for top colleges puts more emphasis on data for HALO students who reside among higher-achieving peers, as those are the students for whom we can most reliability estimate top-college attendance. What one can take away from Figure 3 is that, among districts for which we have relatively reliable measures of top-college-going value-added, those that have more school options and provide more advanced coursework and gifted services are more successful at getting their HALO students to attend top colleges.
Once again, it is worth noting that for the average Ohio student, the affluence of district students is the strongest predictor of whether they attend a top college, just as it is the strongest predictor of whether a student attends a four-year college. In other words, the results suggest that even after third grade, the affluence of a student’s residential peers can significantly alter that student’s schooling trajectory. That is also the case for HALO students if one does not put greater weight on value-added estimates that are more reliable (see Table D5 in Appendix D). What the analyses in figures 2 and 3 tell us, though, is that when one focuses on the best available data on HALO students’ college-going—based on where HALO students tend to reside—the average achievement of their peers is the primary predictor of whether they attend a four-year college, and the availability of alternative schooling options, advanced coursework, and gifted services are the best predictors of whether they get into top colleges. The analysis of high schools (below) provides an informative test of the robustness of these results.
A Closer Look at Districts’ College-Going Value-Added for HALO Students
The predictors identified above provide a general portrait of the characteristics of districts where HALO students are most likely to realize their potential. The analysis here adds to this portrait by illustrating how districts with varying levels of college-going value-added are distributed across the state, and it identifies (and lists the value-added estimates for) the twenty-five Ohio districts that provide the most opportunity for HALO students. Doing so requires adjusting the value-added estimates for statistical uncertainty. Appendix C describes the procedure for generating these empirical Bayes estimates. Note that, like the previous analysis above, this analysis includes only those districts that educated at least ten HALO students between the 2008–09 and 2013–14 school years.
Figure 4 (below) presents a pair of heat maps that illustrate the geographic distribution of district value-added for HALO students—providing a visual look at the estimated quality of public-school pipelines for recent HALO students across Ohio. The maps yield a couple of patterns. First, district value-added for HALO students’ attendance at four-year colleges and universities (panel a) seems relatively stronger in suburbs surrounding (but not including) large urban districts—particularly near Cleveland and Akron and, to a lesser extent, Columbus, Cincinnati, Toledo, and Youngstown. But the pattern is fuzzy, and there are significant clusters of high-value-added districts in some remote areas.
Figure 4. Districts’ College-Going Value-Added for HALO Students
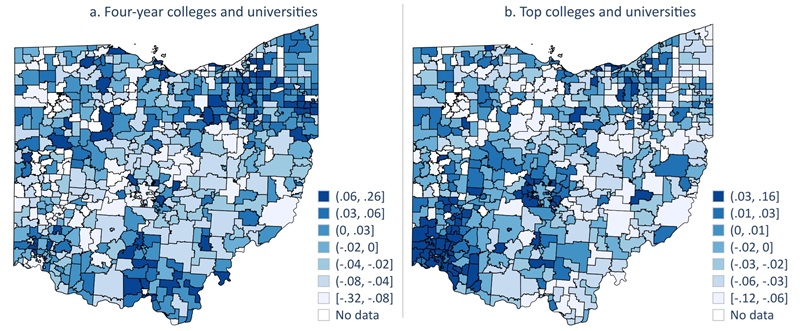
Second, district value-added for HALO students’ attendance at top colleges is highest in the Cincinnati and Dayton areas, followed by the Columbus and Cleveland areas, respectively. The clustering may be because of Cincinnati and Dayton’s proximity to top public universities in Ohio, including the University of Cincinnati, the University of Dayton, and Miami University. Research indicates that geographic proximity and lower tuition rates are big factors driving the enrollment of low-income students, and the public universities near Cincinnati and Dayton likely offer both to students in nearby districts.[45]
Table 6 (below) confirms the patterns in Figure 4. It presents the twenty-five districts with the highest average rank across the four-year and top-college-going value-added estimates (weighted equally). Twenty of the top twenty-five districts are suburban. Most have high-achieving and relatively affluent students, and none is in a city. There are a few exceptions, such as Winton Woods City School District, Waverly City School District, Bath Local Schools, and Union-Scioto Local School District, which provide a relatively strong pipeline for HALO students despite relatively high poverty rates. But these districts do not educate many of Ohio’s HALO students. Indeed, across six third-grade cohorts (from 2008–09 to 2013–14), only Dublin City School District, Fairfield City School District, and Pickerington Local School District educated over 100 HALO students—just twenty-six to twenty-eight HALO third graders per year in each of these three districts.
Table 7 (further below) presents the districts with the highest numbers of HALO third graders. It demonstrates that Ohio’s HALO students are most concentrated in large city and, to a lesser extent, suburban districts and that their rates of college-going are typically well below what one would expect based on their third-grade test scores and demographics. For example, the 1,346 HALO third graders in Columbus City Schools (approximately 225 per year from 2008–09 to 2013–14) attend four-year colleges at rates that are eighteen percentage points below the statewide average for other similar students. Residing in Cleveland, Cincinnati, or Toledo similarly impedes four-year college–going among HALO students—though, consistent with the map above, residing in Cincinnati or Dayton seems to have benefits when it comes to attending top colleges and universities.
Table 6. Districts with the Highest College-Going Value-Added for HALO Students
| Rank | District of Residence | HALO Third Graders (2009–2014) | College (4-year) VA | Top-College VA | NCES Locale | Test Scores (Grade 3) | Poverty (Grade 3) | Spending Per Pupil (TPS) | Adv. Math (G 6–8) | Gifted Services | Charters / EdChoice |
| 1 | Solon | 33 | 0.23 | 0.08 | Suburb | High | Low | High | High | High | No |
| 2 | Mason | 47 | 0.12 | 0.11 | Suburb | High | Low | High/Mod. | High | Low | No |
| 3 | Dublin | 155 | 0.10 | 0.16 | Suburb | High | Low | High | High | High | No |
| 4 | New Albany-Plain | 16 | 0.10 | 0.09 | Suburb | High | Low | High | High | High | Yes |
| 5 | Avon Lake | 38 | 0.13 | 0.06 | Suburb | High | Low | High/Mod. | High | High | No |
| 6 | North Canton | 64 | 0.17 | 0.06 | Suburb | High | Low | Mod./Low | Moderate | Moderate | No |
| 7 | Bay Village | 19 | 0.26 | 0.05 | Suburb | High | Low | High | Low | Mod./Low | No |
| 8 | Jackson | 94 | 0.10 | 0.08 | Suburb | High | Low | Low | High | High | No |
| 9 | Rocky River | 17 | 0.15 | 0.06 | Suburb | High | Low | High | High/Mod. | High | No |
| 10 | Fairfield | 167 | 0.08 | 0.11 | Suburb | Moderate | Mod./Low | Low | Mod./Low | High/Mod. | No |
| 11 | Winton Woods | 84 | 0.09 | 0.10 | Suburb | Low | High | High | Moderate | Mod./Low | No |
| 12 | Beachwood | 14 | 0.10 | 0.07 | Suburb | High | Low | High | High | Moderate | No |
| 13 | Pickerington | 156 | 0.07 | 0.10 | Suburb | High/Mod. | Low | Moderate | High | Moderate | Yes |
| 14 | Waverly | 71 | 0.19 | 0.04 | Town | Low | High | Mod./Low | High | High/Mod. | No |
| 15 | Bath | 50 | 0.09 | 0.06 | Suburb | Moderate | High/Mod. | Mod./Low | Mod./Low | Low | No |
| 16 | Springboro | 34 | 0.08 | 0.06 | Suburb | High | Low | Low | High | High | No |
| 17 | Revere | 15 | 0.12 | 0.04 | Rural | High | Low | High | High | High | No |
| 18 | Poland | 12 | 0.19 | 0.03 | Suburb | High/Mod. | Low | Mod./Low | Mod./Low | Mod./Low | No |
| 19 | Danbury | 10 | 0.14 | 0.03 | Town | Mod./Low | Moderate | High | High/Mod. | High | No |
| 20 | Union-Scioto | 31 | 0.07 | 0.06 | Town | Mod./Low | High/Mod. | Low | Mod./Low | Moderate | No |
| 21 | Perkins | 39 | 0.18 | 0.03 | Town | High/Mod. | Mod./Low | Moderate | High | Moderate | No |
| 22 | Aurora | 12 | 0.09 | 0.04 | Suburb | High | Low | High/Mod. | High/Mod. | High/Mod. | No |
| 23 | Westlake | 55 | 0.05 | 0.09 | Suburb | High | Low | High | High | High | Yes |
| 24 | Madeira | 16 | 0.08 | 0.04 | Suburb | High | Low | High | Mod./Low | High | No |
| 25 | Mayfield | 44 | 0.09 | 0.04 | Suburb | Moderate | Low | High | High | High | No |
Note: The table lists the districts that most exceeded expectations in terms of the probability that their grade-3 residents would attend a four-year college or a top college (where students have an average score of approximately 25 or above on the ACT and 1200 or above on the SAT). Specifically, focusing on districts that had at least ten HALO residents attending public schools (including charters) in grade 3 between 2008–09 and 2013–14, it identifies districts with HALO college-going value-added estimates that rank among the top twenty-five statewide (i.e., those whose average ranking across both estimates puts them in the top twenty-five). The value-added estimates listed in the two columns next to district names indicate the increased probability of college attendance among HALO students. (For example, Bay Village City School District’s value-added of 0.26 indicates that the fraction of HALO students going to college was twenty-six percentage points greater than expected based on those HALO students’ grade-3 characteristics.) The remaining columns summarize district characteristics in those baseline years (2008–09 to 2013–14) when HALO residents were in third grade, summarizing how those districts stack up compared with other Ohio districts regarding the baseline achievement level of students in grade 3 (average test scores in ELA and math), the proportion of grade-3 students who qualify for free or reduced-price lunches (“poverty”), spending per pupil, the fraction of students in grades 6–8 who are enrolled in advanced math courses, and the fraction of students receiving gifted services in ELA or math. The possible categories are “high” (top 20 percent), “high/moderate” (sixtieth to eightieth percentiles), “moderate” (fortieth to sixtieth percentiles), “moderate/low” (twentieth to fortieth percentiles), and “low” (bottom 20 percent). “NCES” is an abbreviation for the National Center for Education Statistics. “TPS” is an abbreviation for traditional public schools, indicating that public school spending captures only that spent on district schools (not charter or state STEM schools).
Table 7. Districts with the Greatest Number of HALO Third Graders from 2008–09 to 2013–14
| Rank | District of Residence | HALO Third Graders (2009–2014) | College (4-year) VA | Top-College VA | NCES Locale | Test Scores (Grade 3) | Poverty (Grade 3) | Spending Per Pupil (TPS) | Adv. Math (G 6–8) | Gifted Services | Charters / EdChoice |
| 1 | Columbus | 1,346 | -0.18 | -0.01 | City | Low | High | High | Moderate | High/Mod. | Yes |
| 2 | Cleveland | 1,322 | -0.13 | -0.02 | City | Low | High | High | Low | Moderate | Yes |
| 3 | Akron | 1,113 | 0.06 | -0.04 | City | Low | High | High | High/Mod. | Mod./Low | Yes |
| 4 | Cincinnati | 866 | -0.11 | 0.05 | City | Low | High | High | High/Mod. | Mod./Low | Yes |
| 5 | Toledo | 713 | -0.15 | -0.04 | City | Low | High | High | Low | Low | Yes |
| 6 | South Western | 565 | -0.09 | 0.04 | Suburb | Low | High | Moderate | Moderate | High/Mod. | Yes |
| 7 | Dayton | 521 | -0.09 | 0.03 | City | Low | High | High | Low | Mod./Low | Yes |
| 8 | Westerville | 289 | -0.07 | 0.01 | Suburb | High/Mod. | Mod./Low | High/Mod. | High/Mod. | High | Yes |
| 9 | Newark | 282 | -0.12 | -0.04 | Suburb | Mod./Low | High | Moderate | High/Mod. | Moderate | Yes |
| 10 | Parma | 277 | -0.01 | 0.01 | Suburb | Mod./Low | Moderate | High | High/Mod. | Low | Yes |
| 11 | Hamilton | 274 | -0.04 | 0.04 | Suburb | Low | High | Mod./Low | Low | High | Yes |
| 12 | Canton | 264 | -0.07 | -0.03 | City | Low | High | High | Moderate | Mod./Low | Yes |
| 13 | Youngstown | 242 | -0.09 | 0.00 | City | Low | High | High | Mod./Low | Mod./Low | Yes |
| 14 | Kettering | 236 | -0.08 | 0.07 | Suburb | High/Mod. | Moderate | High | High | Mod./Low | No |
| 15 | Elyria | 230 | -0.16 | -0.04 | City | Low | High | High/Mod. | Moderate | Moderate | Yes |
| 16 | Troy | 222 | -0.09 | 0.03 | Suburb | High | High/Mod. | Moderate | Moderate | Moderate | No |
| 17 | Lorain | 218 | -0.11 | 0.04 | Suburb | Low | High | High | Low | Moderate | Yes |
| 18 | Springfield | 211 | -0.06 | 0.03 | City | Low | High | High | High | Mod./Low | Yes |
| 19 | Middletown | 211 | -0.04 | 0.01 | Suburb | Low | High | High | Mod./Low | Mod./Low | Yes |
| 20 | Washington | 202 | -0.07 | -0.07 | City | Mod./Low | High | High | Low | High/Mod. | Yes |
| 21 | Lancaster | 197 | -0.06 | -0.03 | Town | Mod./Low | High/Mod. | Mod./Low | Mod./Low | High | No |
| 22 | West Clermont | 195 | -0.02 | 0.06 | Suburb | Moderate | Moderate | Low | High | Mod./Low | No |
| 23 | Lakota | 193 | 0.00 | 0.09 | Suburb | High | Low | Mod./Low | Moderate | High | No |
| 24 | Huber Heights | 193 | -0.11 | 0.01 | Suburb | Mod./Low | High/Mod. | High/Mod. | Mod./Low | Low | No |
| 25 | Northwest | 190 | 0.00 | 0.06 | Suburb | Low | High/Mod. | Mod./Low | High | High/Mod. | Yes |
Note: The table lists the districts with the greatest number of grade-3 HALO students (from 2008–09 to 2013–14) included in the analysis. Once again, the list is restricted to districts that had at least ten HALO residents attending public schools (including charters) in grade 3 between 2008–09 and 2013–14, and the value-added estimates listed in the two columns next to district names indicate the increased probability of college attendance among HALO students. The remaining columns summarize district characteristics in those baseline years (2008–09 to 2013–14) when HALO residents were in third grade, summarizing how those districts stack up compared with other Ohio districts regarding the baseline achievement level of students in grade 3 (average test scores in ELA and math), the proportion of grade-3 students who qualify for free or reduced-price lunches (“poverty”), spending per pupil, the fraction of students in grades 6–8 who are enrolled in advanced math courses, and the fraction of students receiving gifted services in ELA or math. The possible categories are “high” (top 20 percent), “high/moderate” (sixtieth to eightieth percentiles), “moderate” (fortieth to sixtieth percentiles), “moderate/low” (twentieth to fortieth percentiles), and “low” (bottom 20 percent). “NCES” is an abbreviation for the National Center for Education Statistics. “TPS” is an abbreviation for traditional public schools, indicating that public school spending captures only that spent on district schools (not charter or state STEM schools).
SIDEBAR 2: The Strong Link Between College Attendance and Graduation
This report focuses on college attendance, not college completion. Ultimately, however, the goal is to get HALO students to graduate at higher rates. This report focuses on college attendance for two reasons. First, estimating value-added for college completion would severely limit the sample size. There are only two grade-3 cohorts for which there are college data five years after high-school graduation, and there is only one cohort with data six years after high-school graduation (a common cutoff used to calculate graduation rates). That leaves too few HALO students for the majority of Ohio districts.
Fortunately, districts whose students exceed expectations in their rates of college attendance are also the districts whose students exceed expectations in their college graduation rates. Figure S2 illustrates this relationship. It indicates that there is nearly a one-to-one relationship between attendance and graduation value-added. The correlation coefficient indicates a strong relationship (0.81), and the R-squared indicates that 66 percent of the variation in graduation value-added is explained by attendance value-added. The results using high schools are comparable, with a correlation coefficient of 0.76 and an R-squared of 0.58.
Figure S2. College-Going Value-Added Versus Graduation Value-Added
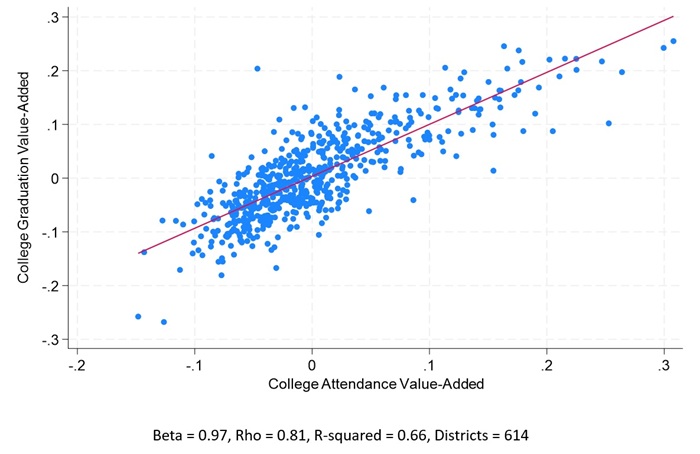
Focusing on high schools provides important advantages. First, the attrition issues with the district-level analysis of HALO students (because of students exiting public schools after third grade and not being matched to postsecondary data) are minimal because the analysis is limited to students linked to specific high schools in ninth grade. Ninth-grade cohorts are those that the Ohio Department of Education and Workforce matches to National Student Clearinghouse data, so there is less chance that a student is missed and incorrectly coded as not having attended college. A second advantage is that one can observe students’ entry into high schools, as a large majority of high schools have the same entry grade. Thus, unlike the district analysis—which awards districts no value-added credit for educational gains to which they contribute prior to grade 4 (grade 3 is the baseline for the value-added calculations)—one can generally examine students’ education trajectories before and after entering high school.
A third advantage of focusing on high schools is that one can estimate the impact of more immediate preparation for college, particularly via college-level coursework. Approximately 40 percent of the gap between HALO students’ AP course–taking and credit for Ohio’s public colleges (score of 3 or above) and those of HAHI students is attributable to these students residing in different districts.[46] However, data on AP and other high school coursework are unavailable for the 2008–09 to 2013–14 baseline years used in the district-level analysis. By setting a new grade-9 baseline for school years 2014–15 to 2018–19, one can examine the link between the availability of AP courses in high school and the probability of college attendance.
A significant share of the ninth-grade students used in this analysis are the third graders used in the district analysis, even though this analysis identifies HALO students using seventh- and eighth-grade data instead of third-grade data.[47] As with districts of residence, the high schools students attend in grade 9 explain a significant share of the gap in course-taking and college-going. Indeed, nearly 50 percent of the gap between HALO students’ AP course–taking and credit for public colleges (score of 3 or above) and those of HAHI students is attributable to students attending different high schools in grade 9. Similarly, although where students go to high school accounts for 13 percent of the four-year college–going gap between HALO students and their wealthier peers, it accounts for 41 percent of the gap in attendance at top colleges.[48]
The analysis of high schools proceeds like the analysis of districts. It first involves estimating how much the schools students attended in ninth grade affected their probability of attending college—isolating, to the extent possible, high schools’ influence from students’ cognitive, demographic, and socioeconomic attributes as of eighth grade (see Appendix C for details). The analysis then examines the extent to which school-level attributes observed at the time students were in eighth grade are predictive of college attendance (relative to expectations based on averages for students with similar characteristics). Given the methodological advantages enumerated above, this analysis provides a valuable check and extension of the district-level analysis.
High School Attributes That Predict College-Going Value-Added
The predictors are like those used in the district-level analysis but are measured at the school level. They include the fraction of students who are not eligible for free or reduced-price lunches (“peer affluence”),[49] peers’ average grade-8 test scores (“peer achievement”), spending per pupil, and the average share of students receiving gifted services in ELA or math, taking AP/IB courses, and getting dual credit through CCP (“advanced courses and services”). Unlike the district-level analysis, however, there is not a measure of school options, as there is no analogous measure when shifting the focus from the district of residence to the school of attendance.[50] Descriptive statistics, results in tabular form, and sensitivity analyses are available in Appendix E.
Figure 5 (below) presents the estimates with respect to value-added for four-year colleges and universities. It reveals that when comparing high schools’ attributes at baseline, peer achievement is by far the strongest predictor of college-going. An increase of one standard deviation in the average test score of one’s high-school peers (equivalent to a school’s students going from approximately the fiftieth percentile to the sixtieth percentile on the grade-8 test-score distribution) corresponds to an 8.6-percentage-point increase in the probability of attending a four-year college.[51] School spending comes in second, with an increase of one standard deviation—$2,350 per student—corresponding to an increase of 1.9 percentage points in the probability of attending college. Notably, as in the district analysis, there is no positive relationship between the proxy for peer affluence or advanced course–taking and a school’s value-added with respect to attending a four-year college. Indeed, HALO students’ college-going is higher when they attend school with other students who are eligible for free or reduced-price lunches. The negative result for peer affluence may be because of the limitations of using free or reduced-price meal eligibility as a proxy for student poverty.[52]
Figure 5. Predictors of High Schools’ Value-Added for Four-Year Colleges
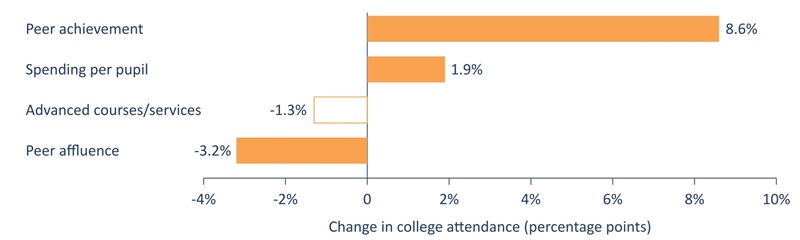
Figure 6 (below) presents the estimates for attendance at top colleges and universities. Once again, like the district-level analysis, it reveals that advanced coursework and gifted services overtake peer achievement as the strongest predictor of college-going. Specifically, a one–standard deviation increase in participation in advanced coursework and gifted services corresponds to a 4.3-percentage-point increase in the probability of attending a top college. This result is driven entirely by AP coursework, as opposed to other dual-credit options or gifted services.[53] Peer achievement comes in a close second (an estimated effect of 3.2 percentage points), and HALO students’ college-going is again somewhat higher when they attend school with other students who are eligible for free or reduced-price lunches.[54]
Figure 6. Predictors of High Schools’ Value-Added for Top Colleges
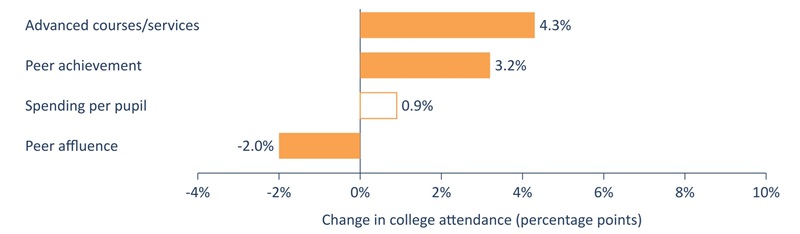
Note that null or negative estimates (e.g., for advanced coursework in Figure 5 and peer affluence in both figures) do not imply that those factors do not affect college-going. This analysis is merely identifying school-level predictors of changes in students’ schooling trajectories after grade 8.[55] Additionally, as discussed in the district analysis, whether the analysis can identify such predictors depends on the effective sample used. The schools that educate a sufficient number of HALO students and that are reliably effective or ineffective at changing these students’ trajectories when it comes to four-year colleges may not vary all that much in the coursework they offer (e.g., few may offer AP courses), but those that are particularly effective or ineffective at changing HALO students’ trajectories when it comes to top colleges may indeed vary significantly in the availability of AP coursework. That does not mean that schools effective at getting their students into four-year colleges without the aid of AP coursework would not benefit from it. Indeed, an analysis that includes all Ohio schools and students (not just HALO students) reveals that the availability of AP coursework (but, once again, not CCP or gifted services) is predictive of getting the average Ohio student into a four-year college or top college.[56]
The above results largely corroborate those of the district-level analysis and, reassuringly, are less sensitive to the sample used and statistical weighting.[57] Once again, the analysis points to the predictive power of peer achievement and advanced coursework in getting HALO students into four-year and top colleges, respectively. This is an important addition to the set of results from the district-level analysis, as a student’s district of residence explains much of the variation in AP course–taking.
A Closer Look at High Schools’ College-Going Value-Added for HALO Students
The preceding analysis identifies peer achievement and AP course enrollment rates as top predictors of HALO students’ probability of attending four-year and top colleges, respectively. This section looks for similarities in high schools that are particularly effective at increasing HALO students’ probability of attending a four-year or top college. First, Table 8 (below) lists the top twenty-five high schools in terms of the average statewide rank of their college-going value-added estimates for four-year and top colleges and universities. (The appendix provides a high-school value-added ranking focused exclusively on top colleges and universities.[58])
Table 8 reveals that the high schools most effective at changing students’ attainment trajectories after grade 8 are primarily in the suburbs, but there are some notable exceptions. Portsmouth High School, for example, is in a district that federal data label as a town, and it has relatively low average test scores, high rates of school meal eligibility, and moderate-to-low rates of participation in AP coursework. This school is unusual, however, in that it also includes a junior high school (it serves grades 7–12). Zanesville High School is another high-poverty and low-achievement school in a town, but notably, it boasts a moderate-to-high rate of enrollment in AP courses. Perhaps the biggest standout is the Cleveland School of Science and Medicine—one of the Cleveland Metropolitan School District’s selective “criteria schools.” It is a high-poverty school in a city district, but its students are high-achieving and have access to advanced coursework.
Table 9 (further below) restricts the rankings to schools in the top 40 percent in terms of the proportion of their students who qualify for free or reduced-price lunches (those indicated as having “high” or “high/moderate” poverty rates in Table 8). It includes several schools in city districts that enroll large numbers of HALO students, with a solid mix of schools from towns, suburbs, and rural areas. Consistent with the analysis of value-added for top colleges and universities, several schools on the list have moderate-to-high rates of student participation in AP coursework and moderate-to-high average test scores. Among these schools are four of Cleveland Metro’s five selective “criteria schools.[59] It is beyond the scope of this study to thoroughly examine similarities across these schools, but the presence of selective and early-college high schools stands out.
Table 8. High Schools with the Highest College-Going Value-Added (VA) for HALO Students
| School of Attendance | 4-Year College VA | Top-College VA | Location District | NCES Locale | Test Scores (Gr. 8) | Poverty (Gr. 8) | Spending Per Pupil | Gifted Services | AP/IB | College Credit Plus | |
| 1 | Turpin | 0.25 | 0.19 | Forest Hills | Suburb | High | Low | Moderate | Moderate | High | Low |
| 2 | Granville | 0.26 | 0.15 | Granville | Suburb | High | Low | High/Mod. | High | High | Mod./Low |
| 3 | Portsmouth | 0.22 | 0.16 | Portsmouth | Town | Mod./Low | High | High | Mod./Low | Mod./Low | Mod./Low |
| 4 | Mathews | 0.28 | 0.13 | Mathews | Rural | Mod./Low | Mod./Low | High/Mod. | High/Mod. | Low | High/Mod. |
| 5 | Williamsburg | 0.19 | 0.21 | Williamsburg | Suburb | High/Mod. | Moderate | Low | High/Mod. | High/Mod. | High/Mod. |
| 6 | Anderson | 0.19 | 0.20 | Forest Hills | Suburb | High | Low | Moderate | Moderate | High | Low |
| 7 | Sycamore | 0.22 | 0.15 | Sycamore | Suburb | High | Low | High | Moderate | High | Mod./Low |
| 8 | Dublin Coffman | 0.17 | 0.22 | Dublin | Suburb | High | Low | High/Mod. | Low | High | Mod./Low |
| 9 | William Mason | 0.18 | 0.20 | Mason | Suburb | High | Low | Mod./Low | High/Mod. | High | High |
| 10 | Lakota West | 0.18 | 0.16 | Lakota | Suburb | High | Low | Mod./Low | Moderate | High | Mod./Low |
| 11 | Bay | 0.27 | 0.10 | Bay Village | Suburb | High | Low | High/Mod. | High/Mod. | High | Mod./Low |
| 12 | Cleveland School of Science and Medicine | 0.17 | 0.18 | Cleveland | City | High | High | High | High/Mod. | High | High |
| 13 | Orange | 0.22 | 0.12 | Orange | Suburb | High | Low | High | High | High | Low |
| 14 | Zanesville | 0.21 | 0.12 | Zanesville | Town | Low | High | High/Mod. | Moderate | High/Mod. | Moderate |
| 15 | Springboro | 0.21 | 0.12 | Springboro | Suburb | High | Low | Low | High | High/Mod. | High |
| 16 | Oakwood | 0.16 | 0.20 | Oakwood | Suburb | High | Low | High/Mod. | High | High | High |
| 17 | Madeira | 0.17 | 0.16 | Madeira | Suburb | High | Low | High | High | High | High |
| 18 | Perrysburg | 0.23 | 0.09 | Perrysburg | Suburb | High | Low | Moderate | Mod./Low | High | High/Mod. |
| 19 | Finneytown Secondary Campus | 0.16 | 0.13 | Finneytown | Suburb | Mod./Low | High/Mod. | Moderate | Mod./Low | High | Mod./Low |
| 20 | West Clermont | 0.14 | 0.17 | West Clermont | Suburb | Moderate | Mod./Low | Low | Low | High | Moderate |
| 21 | Solon | 0.22 | 0.08 | Solon | Suburb | High | Low | High | High | High | Moderate |
| 22 | Medina | 0.17 | 0.10 | Medina | Suburb | High/Mod. | Low | Moderate | Mod./Low | High | Moderate |
| 23 | Waynesfield Goshen | 0.24 | 0.07 | Waynesfield Goshen | Rural | High/Mod. | Mod./Low | High/Mod. | High/Mod. | Low | High |
| 24 | West Geauga | 0.16 | 0.09 | West Geauga | Rural | High | Low | High/Mod. | High/Mod. | High | Mod./Low |
| 25 | Johnstown | 0.24 | 0.06 | Johnstown-Monroe | Rural | High | Low | Low | High/Mod. | Mod./Low | High/Mod. |
Note: The table lists the high schools that most exceeded expectations in terms of the probability that their grade-9 students would attend a four-year college or a top college (where students have an average score of approximately 25 or above on the ACT and 1200 or above on the SAT). Specifically, focusing on districts that had at least ten HALO residents attending public schools (including charters) in grade 9 between 2014–15 and 2018–19, it identifies schools with HALO college-going value-added estimates that rank among the top twenty-five statewide (i.e., those whose average ranking across both estimates puts them in the top twenty-five). The value-added estimates listed in the two columns next to school names indicate the increased probability of college attendance among HALO students. (For example, Turpin High School’s value-added of 0.25 indicates that the fraction of HALO students going to college was twenty-five percentage points greater than expected based on those HALO students’ characteristics in grade 8 and earlier.) The remaining columns summarize school characteristics in those baseline years (2014–15 to 2018–19) when HALO residents were in ninth grade, summarizing how those schools stack up compared with other Ohio high schools regarding the baseline achievement level of students in grade 8 (average test scores in ELA and math), the proportion of grade-8 students who qualify for free or reduced-price lunches (“poverty”), spending per pupil, the fraction of students in grades 9–12 who are receiving gifted services in ELA or math, and the fraction of students taking AP and IB coursework. The possible categories are “high” (top 20 percent), “high/moderate” (sixtieth to eightieth percentiles), “moderate” (fortieth to sixtieth percentiles), “moderate/low” (twentieth to fortieth percentiles), and “low” (bottom 20 percent).
Table 9. High-Poverty High Schools with the Highest College-Going Value-Added for HALO Students
| Rank | School of Attendance | 4-Year College VA | Top-College VA | Location District | NCES Locale | School Type | Test Scores (Grade 8) | Spending Per Pupil | Gifted Services | AP/IB | College Credit Plus |
| 1 | Portsmouth | 0.22 | 0.16 | Portsmouth | Town | District | Mod./Low | High | Mod./Low | Mod./Low | Mod./Low |
| 2 | Cleveland School of Science and Medicine | 0.17 | 0.18 | Cleveland | City | District | High | High | High/Mod. | High | High |
| 3 | Zanesville | 0.21 | 0.12 | Zanesville | Town | District | Low | High/Mod. | Moderate | High/Mod. | Moderate |
| 4 | Finneytown Secondary Campus | 0.16 | 0.13 | Finneytown | Suburb | District | Mod./Low | Moderate | Mod./Low | High | Mod./Low |
| 5 | Chillicothe | 0.17 | 0.07 | Chillicothe | Town | District | Mod./Low | Moderate | High/Mod. | High | Mod./Low |
| 6 | Claymont | 0.18 | 0.06 | Claymont | Town | District | Mod./Low | High/Mod. | Moderate | Moderate | Moderate |
| 7 | Toledo Technology Academy of Engineering | 0.15 | 0.07 | Toledo | City | District | High | High | Mod./Low | Mod./Low | High |
| 8 | Vinton County | 0.12 | 0.08 | Vinton County | Rural | District | Mod./Low | Mod./Low | High | Moderate | Low |
| 9 | Hamilton | 0.11 | 0.10 | Hamilton | Suburb | District | Moderate | Low | High/Mod. | High/Mod. | Mod./Low |
| 10 | Warren G. Harding | 0.18 | 0.05 | Warren | City | District | Low | High | Low | Moderate | Mod./Low |
| 11 | Youngstown Rayen Early College | 0.09 | 0.14 | Youngstown | City | District | Moderate | High | Moderate | Mod./Low | High |
| 12 | Valley | 0.31 | 0.03 | Valley | Town | District | High/Mod. | Moderate | Low | Moderate | High/Mod. |
| 13 | Paint Valley | 0.23 | 0.03 | Paint Valley | Rural | District | Mod./Low | Moderate | Low | Mod./Low | Mod./Low |
| 14 | Dayton Early College Academy | 0.09 | 0.13 | Dayton | City | Charter | Moderate | High/Mod. | Low | Moderate | High |
| 15 | Whitney M. Young | 0.14 | 0.05 | Cleveland | City | District | Moderate | High | High | High | High/Mod. |
| 16 | Cleveland Early College | 0.15 | 0.04 | Cleveland | City | District | High | High | High/Mod. | High | High |
| 17 | Marion-Franklin | 0.10 | 0.08 | Columbus | City | District | Low | High | Mod./Low | High/Mod. | Low |
| 18 | National Inventors Hall of Fame STEM | 0.23 | 0.02 | Akron | City | STEM | High/Mod. | High/Mod. | High | Moderate | High |
| 19 | Bard Early College | 0.10 | 0.07 | Cleveland | City | District | High/Mod. | High/Mod. | High/Mod. | Mod./Low | High |
| 20 | Harding | 0.08 | 0.10 | Marion | Town | District | Low | High/Mod. | Moderate | Moderate | Moderate |
| 21 | Princeton | 0.05 | 0.14 | Princeton | Suburb | District | Mod./Low | High/Mod. | High/Mod. | High | Mod./Low |
| 22 | Coshocton | 0.10 | 0.06 | Coshocton | Town | District | Mod./Low | Moderate | High | High/Mod. | High/Mod. |
| 23 | Alliance | 0.15 | 0.03 | Alliance | Town | District | Mod./Low | Moderate | High/Mod. | Moderate | High/Mod. |
| 24 | Middletown | 0.06 | 0.10 | Middletown | Suburb | District | Low | Mod./Low | Mod./Low | Moderate | Low |
| 25 | Waverly | 0.27 | 0.00 | Waverly | Town | District | Mod./Low | Mod./Low | Moderate | Moderate | Mod./Low |
Note: The table lists the high schools that most exceeded expectations in terms of the probability that their grade-9 students would attend a four-year college or a top college (where students have an average score of approximately 25 or above on the ACT and 1200 or above on the SAT). Specifically, focusing on districts that had at least ten HALO residents attending public schools (including charters) in grade 9 between 2014–15 and 2018–19, it identifies schools with HALO college-going value-added estimates that rank among the top twenty-five among high- and high/moderate-poverty schools statewide (i.e., those whose average ranking across both estimates puts them in the top twenty-five among schools with poverty rates in the top 40 percent). The value-added estimates listed in the two columns next to school names indicate the increased probability of college attendance among HALO students. (For example, a value-added of 0.20 indicates that the fraction of HALO students going to college was twenty percentage points greater than expected based on those HALO students’ characteristics in grade 8 and earlier.) The remaining columns summarize school characteristics in those baseline years (2014–15 to 2018–19) when HALO residents were in ninth grade, summarizing how those schools stack up compared with other Ohio high schools regarding the baseline achievement level of students in grade 8 (average test scores in ELA and math), the proportion of grade-8 students who qualify for free or reduced-price lunches (“poverty”), spending per pupil, the fraction of students in grades 9–12 who are receiving gifted services in ELA or math, and the fraction of students taking AP and IB coursework. The possible categories are “high” (top 20 percent), “high/moderate” (sixtieth to eightieth percentiles), “moderate” (fortieth to sixtieth percentiles), “moderate/low” (twentieth to fortieth percentiles), and “low” (bottom 20 percent).
The preceding analysis identifies commonalities among the districts and schools where HALO students are most likely to exceed expectations in their college-going. One clear takeaway is that, holding other inputs constant, districts and schools where students take advanced coursework at higher rates are also those where HALO students attend top colleges at higher rates. The analysis cannot tell us, however, how the postsecondary prospects of HALO students compare between those who participate in advanced coursework and those who do not participate in advanced coursework. The analysis in this section does so by focusing on observationally similar HALO students who attended the same baseline school. Specifically, it focuses on similar students who attended the same elementary school in grade 3, comparing the college-going of those who received gifted services in ELA or math with the college-going of those who did not receive gifted services in ELA or math (often advanced coursework) and comparing the college-going of those who took advanced math coursework in grades 6–8 with the college-going of those who did not, and it also focuses on similar students who attended the same middle school in grade 8, comparing the college-going of those who participated in AP/IB coursework or dual-credit options via CCP with the college-going of those who did not.[60]
Note that although this research design is relatively strong, it is unlikely to isolate the causal impact of taking advanced coursework or receiving gifted services on students’ college attendance. There are school-related factors and non-school-related factors that might lead talented HALO students to enroll in advanced coursework (or not), and these other factors may affect the probability of college-going beyond their impact on course-taking. For example, school guidance counselors and students’ friends may affect their aspirations, which may affect both course selection and college attendance. These environmental forces may be more important levers to pull to increase college-going among HALO students (hence the preceding school- and district-level analyses). That said, because the comparisons below are between similar students—who attended the same baseline school and who have similar prior test scores, demographic characteristics, gifted identification, and the like—this analysis should capture, to a reasonable extent, the impact of advanced course–taking and gifted services on college-going among HALO students.
Figure 7 (below) indicates that HALO students who took advanced coursework—from algebra in middle school to AP classes in high school—have substantially higher rates of college attendance than similar HALO students who did not. HALO students who took high-school math courses in grades 6–8 (mostly algebra) have college-going rates that are eighteen percentage points higher than similar students who did not take advanced math coursework. And Figure 8 (further below) indicates that HALO middle-school students’ probability of attending a top college is six percentage points higher if they take advanced math courses. One cannot directly compare the magnitude of the estimated impacts between middle schools and high schools, as they are based on different samples of students. The middle-school sample also less reliably links students to higher-education data, which most likely leads to underestimating true effects. One should instead focus on the fact that the estimates are large and positive across all types of coursework and services in both middle school and high school.
Figure 7. Comparing Attendance Rates at Four-Year Colleges Between Similar HALO Students Who Did/Didn’t Take Advanced Coursework or Receive Gifted Services
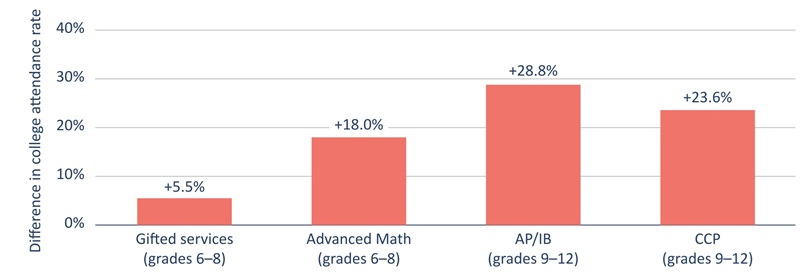
Figure 8. Comparing Attendance Rates at Top Colleges Between Similar HALO Students Who Did/Didn’t Take Advanced Coursework or Receive Gifted Services
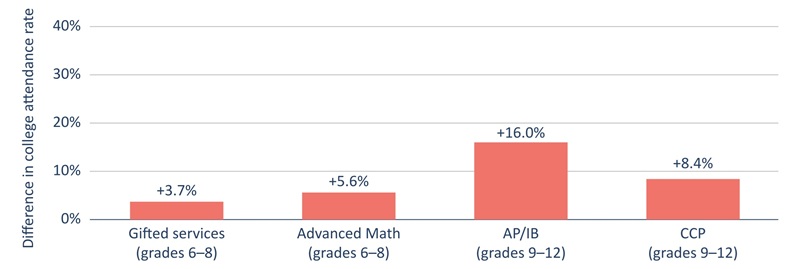
Figure 7 also indicates that taking AP coursework likely provides the strongest path to college for HALO high-school students—whether they are eyeing a four-year college or a top college. Students who took at least one AP (or IB) course increased their college-going by twenty-nine percentage points relative to HALO students who did not take at least one AP (or IB) course.[61] Figure 8 indicates that the margin for top-college attendance is sixteen percentage points. The estimates for CCP are also positive and substantial, but they are half the size of the AP estimates when it comes to HALO students getting into top colleges.
Finally, the figures indicate that students who receive gifted services in ELA or math are indeed more likely to attend four-year colleges (by six percentage points) and top colleges (by four percentage points) relative to HALO students who do not receive such services—which are a variable mix of advanced coursework or other programming linked to students’ areas of gifted identification.
The above analysis does not allow one to completely isolate the causal impact of course-taking from other factors that might lead students to take advanced courses in the first place. And again, one should not compare the magnitudes of the estimates between the middle-school and high-school estimates, as they are based on different samples. What is clear, however, is that HALO students who took more advanced courses and received gifted services fared far better than those who did not. The results also suggest that the impacts of advanced math coursework in middle school and AP coursework in high school are larger than the impacts of gifted services and CCP coursework, respectively.
The analysis confirms that HALO students in Ohio are significantly less likely to attend a college or university, especially a top college or university, than their wealthier peers who had similar academic performance and demographic characteristics back in third grade. The results suggest that students’ district of residence and the high school they attend play a significant role in this college-going disparity—particularly when it comes to top colleges and universities. A major reason appears to be that the academic achievement of HALO students’ peers and their access to advanced coursework (particularly AP classes) are strong predictors of college-going that vary significantly across districts and schools.
The districts and schools that provide the greatest boost to HALO students’ college-going tend to be in high-achieving, wealthy suburbs that enroll few HALO students. But the analysis also indicates that schools serving primarily low-income kids—often located in cities and towns—are sometimes effective at getting HALO students into college at high rates. This is particularly true if they surround HALO students with high-achieving peers and provide them with advanced coursework and gifted services. For example, four of Cleveland’s five selective “criteria schools”—which have high poverty rates but offer a variety of dual-credit options and have relatively high-achieving student bodies—are among the top twenty-five high-poverty high schools in Ohio in terms of boosting HALO students’ college-going. More generally, across all Ohio districts and schools, HALO students who took advanced coursework or received gifted services in middle and high school were far more likely to attend four-year colleges and universities than other HALO students who attended the same schools but did not pursue advanced coursework.
Thus, this study suggests Ohio could improve its K–12 pipeline to higher education by providing HALO students with more opportunities to take advanced coursework, receive gifted education services, and surround themselves with similarly high-achieving peers. Schools should encourage HALO students to take advantage of those opportunities when they are available. Rigorous research demonstrates how effective high-school guidance counselors can be in getting HALO students into top colleges and universities simply by making them aware of those opportunities.[62] The results of this analysis suggest that HALO students should receive encouragement to take advanced coursework and to get on a path to college well before it is time to choose a college, however. Policy proposals to automatically enroll high-achieving kids in algebra in eighth grade are a good start. Doing so could, in turn, increase AP coursework in high school—the strongest predictor of college-going among HALO students.[63] The National Working Group on Advanced Education’s (2023) report enumerates several opportunities for schools and policymakers to implement such an approach throughout the K–12 pipeline.[64]
Grouping high-ability students together and offering advanced coursework requires enough high-achieving students to make it financially viable, and it requires access to a supply of teachers with the requisite expertise. Many HALO students reside in districts that don’t meet these conditions.[65] But as this analysis shows, there are many districts with substantial concentrations of HALO students that do not provide much of a boost in HALO students’ college-going. For example, Columbus City Schools has the highest number of HALO students residing within its boundaries, and these students’ rate of college-going is eighteen percentage points lower than the state average for students with similar test scores and other attributes in third grade. That’s forty HALO third graders in Columbus alone, every year, who won’t go to college but would have if they resided in an Ohio district of average quality (where HALO students’ college-going is still significantly lower than that of their wealthier high-achieving peers). Indeed, among the twelve districts with the largest number of HALO students—including Ohio’s eight large urban districts—only in Akron does the rate of four-year college–going among HALO students not fall below what one would have expected based on these students’ third-grade test scores and attributes.
One way to address this problem is for Ohio policymakers to expand access to high-quality school options and to provide families with the information and decision-making assistance they need to make the best use of those options. For example, policymakers might establish selective schools that draw high-achieving students from several districts to get the critical mass of students needed to make the model viable. Each district in the region could have a right to some share of seats. Note, however, that to reach HALO students, there may need to be seats set aside for low-income students. For example, Metro Early College High School—a state STEM school that draws students from several districts in central Ohio—is effective at boosting HALO students’ chances of getting into top colleges and universities. But it does not make the top-twenty-five among “high-poverty” high schools for getting HALO students into college, because it educates relatively few low-income students.[66] Moreover, Ohio’s state STEM schools do not have test score requirements, which likely undermines their effectiveness when it comes to improving HALO students’ rates of college-going.
Another option is to expand Ohio’s interdistrict open enrollment program to all districts so that HALO students could attend a neighboring high-achieving district, free of charge, if that district has open seats.[67] Suburban districts filled with high-achieving students might be open to admitting HALO students from surrounding districts if there were financial incentives to doing so—for example, if they were to receive the substantially higher per-pupil aid allocated to low-income students attending high-poverty districts. The recent expansion of EdChoice, which provides considerable financial assistance to low-income households, is also a promising route, given its success in getting Ohio’s low-income students into college.[68]
The state of Ohio excels at providing information that is predictive of schools’ college-going value-added. For example, the report card grades capturing high-school achievement levels, test score growth, and college preparation during the baseline years (2014–2019) were all highly predictive of students’ future college-going.[69] Thus, as new school options become available, the information is largely available to assess the quality of those options. The missing link seems to be helping families incorporate this information into their decision-making. Research demonstrates that with such support, parents make decisions that better align with educational goals.[70] Such support becomes increasingly important as school options expand.
It is worth remembering that the decision to attend college often hinges on factors beyond the K–12 public schooling system. For example, one reason the concentration of high-achieving students and high rates of AP coursework in schools might lead to more college-going is that colleges are more likely to target these high schools in the recruitment process.[71] Similarly, as the analysis suggests, HALO students’ attendance at top colleges increases if their district of residence is geographically near top public colleges and universities, which is consistent with research demonstrating the impact of cost and proximity on low-income students’ college-going decisions.[72] Nevertheless, this report also clearly documents the educational benefits of HALO students attending public schools that provide access to advanced coursework and high-achieving peers, in spite of factors such as college cost and proximity.
The analysis in this report focuses on how districts and schools might alter students’ academic trajectories beyond third grade—after family-, community-, and school-related factors have already played a significant role in putting kids on or off track for college—and it relies primarily on descriptive statistical methods to do so. Yet the results are strikingly consistent throughout, line up with the results of other rigorous studies, and point to clear opportunities for substantially improving college-going among Ohio’s HALO students. Unlocking this talent not only would transform these students’ futures but would likely also deliver broad economic and social benefits for Ohio.
I am grateful for the extensive and helpful feedback I received from Fordham’s Chad Aldis, Aaron Churchill, Chester Finn, and Michael Petrilli (listed in alphabetical order by last name), as well as from external readers Richard Kahlenberg, Vladimir Kogan, and Jonathan Plucker. The report improved greatly because of their feedback. The weaknesses that remain are entirely my fault.
- Stéphane Lavertu
I offer my deepest gratitude to Stéphane Lavertu for his fine work carrying out this project. Special thanks also to the Ohio Department of Education and Workforce for providing the data that made possible this report. I wish to thank David Yontz, who copy edited the report, and Dave Williams, who designed the layout. Finally, I thank my Fordham Institute colleagues Jeff Murray, Victoria McDougald, Meredith Coffey, and Stephanie Distler for their support in report publication and dissemination.
- Aaron Churchill
Ohio Research Director
[1] A “top college” in this report is one in which the average student scores in the top 20 percent on college admissions exams. Among Ohio institutions of higher education, this includes Case Western University, Cedarville University, College of Wooster, Kenyon College, Miami University, Oberlin College, Ohio State University, University of Cincinnati, and University of Dayton.
[2] HALO students are identified based on their characteristics in third or eighth grade, depending on the analysis. Specifically, they are students who scored in the top 20 percent statewide on math and ELA exams and who were identified as “economically disadvantaged,” which is largely based on their eligibility for free or reduced-price lunch.
[3] These college-going gaps reflect not only uneven in-school opportunities, but also factors not directly observed in this study such as college affordability and parents’ educational backgrounds, which a recent study from North Carolina indicates contributes to excellence gaps.
[4] These are not precise “causal” estimates, as unobserved factors, like an effective counselor, might have led students to take advanced courses in the first place.
[5] This value-added metric was created as part of this analysis and is unrelated to the “value-added” and “growth” metrics on Ohio district and school report cards.
[6] Zimmerman, Seth D. 2014. “The Returns to College Admission for Academically Marginal Students.” Journal of Labor Economics 32(4): 711–754.
[7] Bleemer, Zachary, and Sarah Quincy. 2025. “Changes in the College Mobility Pipeline Since 1900.” NBER Working Paper No. 33797.
[8] Deming, David J. 2022. “Four Facts About Human Capital.” Journal of Economic Perspectives 36(3): 75–102. Hanushek, Eric A., and Ludger Woessmann. 2012. “Do better schools lead to more growth? Cognitive skills, economic outcomes, and causation.” Journal of Economic Growth 17(4): 267–321.
[9] Deming, David J. 2023. “Why Do Wages Grow Faster for Educated Workers?” NBER Working Paper No. 31373.
[10] Valero, Anna, and John Van Reenen. 2019. “The Economic Impact of Universities: Evidence from Across the Globe.” Economics of Education Review 68: 53–67.
[11] Coleman, James, Ernest Q. Campbell, Carol J. Hobson, James McPartland, Alexander M. Mood, Frederic D. Weinfeld, and Robert L. York. 1966. Equality of Educational Opportunity. Washington, DC: Department of Health, Education and Welfare.
[12] Carrell, Scott E., Mark Hoekstra, and Elira Kuka. 2018. “The Long-Run Effects of Disruptive Peers.” American Economic Review 108(11): 3377–3415.
[13] Chetty, Raj, Matthew O. Jackson, Theresa Kuchler, Johannes Stroebel, Nathaniel Hendren, Robert B. Fluegge, Sara Gong, Federico Gonzalez, Armelle Grondin, Matthew Jacob, Drew Johnston, Martin Koenen, Eduardo Laguna-Muggenburg, Florian Mudekereza, Tom Rutter, Nicolaj Thor, Wilbur Townsend, Ruby Zhang, Mike Bailey, Pablo Barberá, Monica Bhole, and Nils Wernerfelt. 2022. “Social Capital I: Measurement and Associations with Economic Mobility.” Nature 608: 108–121.
[14] Chetty, Raj, Matthew O. Jackson, Theresa Kuchler, Johannes Stroebel, Nathaniel Hendren, Robert B. Fluegge, Sara Gong, Federico Gonzalez, Armelle Grondin, Matthew Jacob, Drew Johnston, Martin Koenen, Eduardo Laguna-Muggenburg, Florian Mudekereza, Tom Rutter, Nicolaj Thor, Wilbur Townsend, Ruby Zhang, Mike Bailey, Pablo Barberá, Monica Bhole, and Nils Wernerfelt. 2022. “Social Capital II: Determinants of Economic Connectedness.” Nature 608: 122–134.
[15] Heckman, James J. 2006. “Skill Formation and the Economics of Investing in Disadvantaged Children.” Science 312: 1900–1902.
[16] Jackson, C. Kirabo, and Claire L. Mackevicius. 2024. “What Impacts Can We Expect from School Spending Policy? Evidence from Evaluations in the United States.” American Economic Journal: Applied Economics 16(1): 412–446.
[17] Smith, Jonathan, Michael Hurwitz, and Christopher Avery. 2017. “Giving College Credit Where It Is Due: Advanced Placement Exam Scores and College Outcomes.” Journal of Labor Economics 35(1): 67–147. Jackson, C. Kirabo. 2010. “The Effects of an Incentive-Based High-School Intervention on College Outcomes.” NBER Working Paper 15722. Cambridge, MA: National Bureau of Economic Research.
[18] Aughinbaugh, Alison. 2012. “The Effects of High School Math Curriculum on College Attendance: Evidence from the NLSY97.” Economics of Education Review 31 (6): 861–70; Byun, Soo-yong, Matthew J. Irvin, and Bethany A. Bell. 2015. “Advanced Math Course Taking: Effects on Math Achievement and College Enrollment.” Journal of Experimental Education 83 (4): 439–68. Speroni, Cecilia. 2011. “Determinants of Students’ Success: The Role of Advanced Placement and Dual Enrollment Programs.” NCPR Working Paper. New York: National Center for Postsecondary Research.
[19] Imberman, Scott. 2021. Ohio’s Lost Einsteins: The Inequitable Outcomes of Early High Achievers. Thomas B. Fordham Institute. Cohodes, Sarah R. 2020. “The Long-Run Impacts of Specialized Programming for High-Achieving Students.” American Economic Journal: Economic Policy 12(1): 127–166.
[20] McEachin, Andrew, Thurston Domina, and Andrew Penner. 2020. “Heterogeneous Effects of Early Algebra across California Middle Schools.” Journal of Policy Analysis and Management 39, no. 3 (Summer): 772–800. Brummet, Quentin, Lindsay Liebert, Thurston Domina, Paul Yoo, and Andrew Penner. 2023. “Early Algebra Affects Peer Composition.” EdWorkingPaper No. 23-878. Annenberg Institute at Brown University. National Working Group on Advanced Education. 2023. Building a Wider, More Diverse Pipeline of Advanced Learners. Thomas B. Fordham Institute.
[21] Barr, Andrew C., and Benjamin L. Castleman. 2024 “Increasing Degree Attainment Among Low-Income Students: The Role of Intensive Advising and College Quality.” NBER Working Paper No. 33921. Holzman, Brian, Irina Chukhray, and Courtney Thrash. 2025. “EMERGEing Educational Opportunities: The Effects of Social Capital on Selective College Outcomes.” Education Finance and Policy, June 18, 1–44.
[22] McEachin, Andrew, Thurston Domina, and Andrew Penner. 2020. “Heterogeneous Effects of Early Algebra across California Middle Schools.” Journal of Policy Analysis and Management 39, no. 3 (Summer): 772–800.
[23] Lavertu, Stéphane, and John J. Gregg. 2022. The Ohio EdChoice Program’s Impact on School District Enrollments, Finances, and Academics. Thomas B. Fordham Institute. Chingos, Matthew M., David N. Figlio, and Krzysztof Karbownik. 2025. The Effects of Ohio’s EdChoice Voucher Program on College Enrollment and Graduation. Urban Institute. Figlio, David N., Cassandra M.D. Hart, and Krzysztof Karbownik. 2023. “Effects of Maturing Private School Choice Programs on Public School Students.” American Economic Journal: Economic Policy 15 (4): 255–94. Cohodes, Sarah, and Astrid Pineda. 2024. “Different Paths to College Success: The Impact of Massachusetts’ Charter Schools on College Trajectories.” NBER Working Paper No. 32732. Chen, Feng, and Douglas N. Harris. 2023. “The Market-Level Effects of Charter Schools on Student Outcomes: A National Analysis of School Districts.” Journal of Public Economics 228: 105015.
[24] Ellison, Glenn, and Parag A. Pathak. 2025. “Optimal School System and Curriculum Design: Theory and Evidence.” NBER Working Paper No. 34091. Cambridge, MA: National Bureau of Economic Research.
[25] Chingos, Matthew M., David N. Figlio, and Krzysztof Karbownik. 2025. The Effects of Ohio’s EdChoice Voucher Program on College Enrollment and Graduation. Urban Institute.
[26] For example, this recent study used the top 20 as the threshold: Imberman, Scott. 2021. Ohio’s Lost Einsteins: The Inequitable Outcomes of Early High Achievers. Thomas B. Fordham Institute.
[27] More precisely, the data identify whether a student is “economically disadvantaged,” which is determined primarily based on their eligibility for free or reduced-price lunches. The report refers to “free or reduced-price lunch” eligibility because it is a commonly used and understood metric, and to draw attention to the fact that it is a fuzzy measure of economic disadvantage. Students may or may not receive this label for a variety of reasons that have little to do with household income. For example, students from low-income households may not be labeled as economically disadvantaged because they did not submit an application for the meals program and their families are not participating in means-tested public assistance programs. Notably, beginning in 2012-13, several Ohio districts and schools began to use the “community eligibility” option of the National School Lunch Program. Students attending a school participating in the program are labeled “economically disadvantaged” regardless of their household income. The coarseness of this proxy for poverty means that the analysis in this report likely understates the educational disparities between HALO and HAHI students. The analysis below further examines the implications of using this measure.
[28] Ohio law provides criteria for identifying gifted students based on superior cognitive, academic (e.g., in mathematics, science, English language arts, or social studies), creative, or artistic ability. The Ohio Department of Education and Workforce provides a list of approved assessments, and districts develop a screening plan that draws from this list. In the absence of whole-grade screening in a school or district, assessments of these abilities typically depend on a referral from a parent, teacher, or guardian.
[29] All students we do not observe attaining a milestone—such as receiving a high-school diploma or attending a four-year college—are coded as not having achieved that milestone. This includes students whose families moved out of state or who transferred to a private school after third grade, as the data track public-school students only. Thus, the results presented in Table 2 understate rates of high-school graduation and, in particular, college attendance because of some additional imprecision in linking grade-9 public-school cohorts to National Student Clearinghouse data. Because higher-achieving and higher-income students are more likely to exit the dataset, however, comparing HALO students with their wealthier peers should lead us to understate attainment gaps between HALO and HAHI students.
[30] A top college is one with ACT and SAT scores in the top 20 percent of the Ohio distribution, because that corresponds to HALO students’ place in the test-score distribution in grade 3. The coding is based on Integrated Postsecondary Education Data System data from 2016 to 2019, which is around the time these students applied to college and preceded the post-COVID wave of test-optional policies.
[31] A student is identified as having received any gifted service if they were enrolled in accelerated coursework or other programs in ELA or math that were directly relevant to their category of gifted identification. Recall from Table 1 that HALO students’ average grade-3 test scores are approximately 10 percent of a standard deviation lower than those of their wealthier high-achieving peers. One might wonder whether those differences account for the differences in college-going and K–12 coursework presented in Table 3 and Table 4, respectively. The analysis in Appendix B reveals they do not. For example, test scores account for less than two percentage points in the difference in college-going between HALO students and their wealthier high-achieving peers, and they account for two to three percentage points in the differences in the rates of advanced coursework and gifted services.
[32] This is a stylized description of the procedure, as these quantities are calculated simultaneously. Appendix C provides details of the statistical procedure.
[33] Research demonstrates that community colleges and less selective four-year schools yield inferior life outcomes for low-income kids. For example, see Bleemer, Zachary, and Sarah Quincy. 2025. “Changes in the College Mobility Pipeline Since 1900.” NBER Working Paper No. 33797.
[34] These results are from Table B3 in Appendix B.
[35] Card, David, Eric Chyn, and Laura Giuliano. 2024. “Can Gifted Education Help Higher-Ability Boys from Disadvantaged Backgrounds?” NBER Working Paper No. 33282.
[36] Angrist, Joshua, Peter Hull, Russell Legate-Yang, Parag A. Pathak, and Christopher R. Walters. 2025. “Putting School Surveys to the Test.” NBER Working Paper No. 33622.
[37] State law requires high schools to administer the ACT or SAT free of charge to all juniors, but students can opt out. There are ACT/SAT scores for 75 percent of the district sample based on third-grade data (87 percent of HAHI students and 80 percent of HALO students). For the grade-9 sample used in the high-school analysis, there are SAT-equivalent scores for 83 percent of the sample (97 percent of HAHI students and 93 percent of HALO students). The analysis of high-school value-added is limited to students who could be linked to a high school, which helps explain the better sample coverage.
[38] The correlation coefficient indicates a strong relationship (0.70), and the R-squared indicates that 50 percent of the variation in college-going value-added is explained by test-score value-added. The results using high schools are comparable, with a correlation coefficient of 0.55 and an R-squared of 0.30 (though the relationship becomes stronger if one restricts the analysis to high schools with at least ten students who took the SAT).
[39] This is a common but coarse measure of student poverty that has become less valid over time as districts began to use the “community eligibility provision” of the National School Lunch Program. Most of the observations in this district-level analysis are based on years prior to Ohio schools adopting the “community eligibility” option. The results of the district analysis are similar if the analysis is limited to years prior to the rollout of the program in 2012-13. Because the measure is nonetheless coarse, however, it may be that other variables (e.g., student test scores used to capture “peer achievement”) capture student poverty to a significant extent. For more information, see Koedel, Cory, and Eric Parsons. 2021. “The Effect of the Community Eligibility Provision on the Ability of Free and Reduced-Price Meal Data to Identify Disadvantaged Students.” Educational Evaluation and Policy Analysis 43(1): 3–31.
[40] The results are generally similar when estimating separate bivariate correlations. Appendix D provides details of the regression models, descriptive statistics for the variables, tabular results of the estimates presented in the figures, and the results of a variety of additional analyses that test for the robustness of the results depending on whether the models are weighted by the precision of the value-added estimates and whether the value-added estimates are based on all students or the HALO or HAHI subsets of students.
[41] Averages and standard deviations for the non-standardized district-level variables appear in Table D1 of Appendix D. Test scores are converted to student-level percentiles by converting the average student-level z-scores.
[42] Estimates are weighted by the inverse of the squared standard error of the value-added estimate, such that more weight is placed on observations in which we have more confidence. The relative ranking of predictors changes if one estimates regressions without weights, with district spending rising to the top and peer achievement remaining significant but sliding down to second place (see Table D4 in Appendix D). The inconsistent estimates suggest that the predictive value of variables depends on the sample of districts on which one focuses. Peer affluence is the strongest predictor if one uses value-added estimates based on all district students (HALO and not), regardless of weighting procedure.
[43] Also see Table B1 in Appendix B for the full set of results.
[44] The reasons for the differences between Figure 2 and Figure 3 appear to be that (1) there is a modest relationship between a district’s overall college-going value-added and its value-added for top colleges and (2) the average district achievement level for Figure 3’s effective sample is higher than for Figure 2’s effective sample. Only 86 percent of the 563 districts in the sample (those with at least ten HALO students during the 2009–2014 baseline) had a HALO student who attended a top college, whereas all but two districts in the sample had a HALO student who attended a four-year college. The correlation between the four-year and top-four-year college-going value-added estimates is 0.40. This correlation drops to 0.09 when precision weights are included.
[45] Acton, Riley K., Kalena Cortes, and Camila Morales. 2024. “Distance to Opportunity: Higher Education Deserts and College Enrollment Choices.” NBER Working Paper No. 33085; Denning, Jeffrey T. 2017. “College on the cheap: Consequences of community college tuition reductions.” American Economic Journal: Economic Policy, 9(2): 155–188.
[46] See Table B3 in Appendix B.
[47] Approximately 85 percent of the students in the high-school analysis are also in the district analysis. Appendix B and Appendix C provide descriptive statistics of the samples. Although there is significant overlap between the HALO students identified using grade-3 and grade-9 data, the overlap is imperfect. The grade-3 cohort based on 2013–14 data would have required 2019–20 grade-9 cohort data, which were not included. There is also further evidence of a leaky pipeline for HALO students. The share of high-achieving students who qualify for free or reduced-price lunches declines from 5 percent based on grade-3 identification to 4.3 percent based on grade-8 identification. Also note that high-achieving students identified for the grade-9 analysis are more likely to graduate from high school and attend college than the grade-3 sample. This is partly because of the attrition issues noted earlier, which artificially decrease the rates of college-going reported for the district analysis based on grade-3 cohorts. But it is also because the sample is limited to students linked to a particular high school in grade 9.
[48] See Table B6 in Appendix B.
[49] This measure of poverty is particularly problematic for the high-school analysis, as there is extensive use of the National School Lunch Program’s “community eligibility” provision during the baseline years of 2014–15 through 2018–19. That means that the entire student body in some schools might be labeled as being eligible for the meal program even if many students do not meet the income threshold. The analysis below assesses the sensitivity of the results when one uses high-school students’ eligibility in third grade for free or reduced-price meals to calculate peer affluence in a school. For more information on the use of the lunch eligibility measure to calculate school-level economic disadvantage, see Koedel, Cory, and Eric Parsons. 2021. “The Effect of the Community Eligibility Provision on the Ability of Free and Reduced-Price Meal Data to Identify Disadvantaged Students.” Educational Evaluation and Policy Analysis 43(1): 3–31.
[50] For example, some high schools are independent schools of choice—charter schools and science, technology, engineering, and mathematics (STEM) schools—and by 2014–15, eligibility for private-school vouchers in Ohio was closely related to students’ eligibility for free or reduced-price lunches because the EdChoice scholarship was tied to family income and school achievement levels. One could create a composite measure based on the proximity and size of nearby private schools that accept vouchers, but that measure would be qualitatively different and creating it would be beyond the scope of this project.
[51] Averages and standard deviations for the non-standardized district-level variables appear in Table E1 of Appendix E. Test scores were translated to student-level percentiles by converting the average student-level z-scores.
[52] Using third-grade meal eligibility among a high school’s current ninth-grade students—meal eligibility observed prior to the introduction of schoolwide meal eligibility—yields a null estimate and diminishes the estimate for peer achievement by approximately two percentage points. These results suggest that peer achievement may capture student disadvantage more precisely than meal eligibility for the years of this analysis. However, because the measure based on third-grade observations also introduces error by basing peer composition on only a fraction of a school’s students (the approximately 85 percent of students per school for whom there are grade-3 data), one cannot say for certain.
[53] See Table E3 in Appendix E.
[54] Once again, as is the case for the analysis reported in Figure 5, using grade-3 meal eligibility yields null estimates and leads to a reduction in the predictive power of peer achievement.
[55] As Table E6 in Appendix E reveals, schools with higher rates of four-year college–going among HALO students do indeed have lower rates of eligibility for free or reduced-priced lunches and higher rates of AP course participation. This analysis indicates, however, that this fact does not predict the college-going value-added of high schools.
[56] See Table E2 and Table E5 in Appendix E.
[57] See Table E4 and Table E5 in Appendix E.
[58] See Table G1 in Appendix G.
[59] Of the five “criteria schools” listed on the district website, only the Cleveland School of the Arts fails to make the ranking in Table 9 (see https://www.clevelandmetroschools.org/Page/11592).
[60] Appendix F provides details of the methodology and the results in tabular form. As with the value-added analysis, the method used to compare observationally similar students was to use statistical controls for baseline characteristics. The analysis employs baseline-school fixed effects to estimate comparisons among students who attended the same prior school.
[61] The results are similar when one considers whether students scored a 3 or above on the exam.
[62] Barr, Andrew C., and Benjamin L. Castleman. 2024 “Increasing Degree Attainment Among Low-Income Students: The Role of Intensive Advising and College Quality.” NBER Working Paper No. 33921. Holzman, Brian, Irina Chukhray, and Courtney Thrash. 2025. “EMERGEing Educational Opportunities: The Effects of Social Capital on Selective College Outcomes.” Education Finance and Policy, June 18, 1–44.
[63] McEachin, Andrew, Thurston Domina, and Andrew Penner. 2020. “Heterogeneous Effects of Early Algebra across California Middle Schools.” Journal of Policy Analysis and Management 39, no. 3 (Summer): 772–800.
[64] National Working Group on Advanced Education. 2023. Building a Wider, More Diverse Pipeline of Advanced Learners. Thomas B. Fordham Institute.
[65] Hoxby, Caroline M., and Christopher Avery. 2012. “The Missing ‘One-Offs’: The Hidden Supply of High-Achieving, Low-Income Students.” NBER Working Paper No. 18586.
[66] Metro does not make the overall high-school rankings because it does not boost HALO students’ chances of attending a four-year college. Its rates of four-year college-going are those we would have expected based on students’ test scores and other attributes in eighth grade. Table G1 in Appendix G provides rankings of schools most effective at getting HALO students into top colleges and universities.
[67] Carlson, Deven, and Stéphane Lavertu. 2017. Interdistrict Open Enrollment in Ohio: Participation and Student Outcomes. Thomas B. Fordham Institute.
[68] Chingos, Matthew M., David N. Figlio, and Krzysztof Karbownik. 2025. The Effects of Ohio’s EdChoice Voucher Program on College Enrollment and Graduation. Urban Institute.
[69] See the analysis in Appendix H.
[70] Campos, Christopher. 2024. “Social Interactions, Information, and Preferences for Schools: Experimental Evidence from Los Angeles.” NBER Working Paper No. 33010. Cambridge, MA: National Bureau of Economics; Jon Valant. 2022. What happens when families whose schools close receive EdNavigator support and OneApp priority? New Orleans, LA: Education Research Alliance for New Orleans / National Center for Research on Educational Access and Choice. Hastings, Justine S., and Jeffrey M. Weinstein. 2008. “Information, School Choice, and Academic Achievement: Evidence from Two Experiments.” The Quarterly Journal of Economics 123(4): 1373–1414.
[71] Hoxby, Caroline M., and Christopher Avery. 2012. “The Missing ‘One-Offs’: The Hidden Supply of High-Achieving, Low-Income Students.” NBER Working Paper No. 18586.
[72] Acton, Riley K., Kalena Cortes, and Camila Morales. 2024. “Distance to Opportunity: Higher Education Deserts and College Enrollment Choices.” NBER Working Paper No. 33085.