Last year, Ohio lawmakers overhauled the state’s K–12 education governance system by transferring the majority of powers and duties assigned to the state board of education to a revamped executive branch office known as the Department of Educat
Last year, Ohio lawmakers overhauled the state’s K–12 education governance system by transferring the majority of powers and duties assigned to the state board of education to a revamped executive branch office known as the Department of Education and Workforce (DEW). In November, Governor DeWine appointed Steve Dackin to serve as its first director.
Although the department has plenty of important issues on its plate, one of its most significant priorities—as evidenced by its new name—is expanding and improving career-technical education (CTE). In a recent interview with The 74, Director Dackin emphasized how critical it is for students and families to be aware of their CTE options. “Most kids were led to believe that their primary opportunities would be either in college or the military,” he explained. “So right now they’re at a deficit. If you ask a kid, what do you want to do when you get out of high school, they’re void of much information about what’s available.”
Raising the awareness of career pathways to the same level as post-secondary enrollment and military enlistment is a priority for the department going forward. “I think our challenge is to make sure that every kid, as they’re going through our K–12 system, their parents have access to labor market data that talks about what the careers are, what the pay is, what it takes to get from point A to point B,” Dackin added. “So many people don't know how to navigate the system, because it’s very complex.”
Making this system more easily accessible is an ongoing effort. But DEW recently took another important step forward by launching a communications campaign called “Your Future. Your Way.” The campaign has two primary goals: (1) to communicate that CTE programs offer high-quality educational experiences that will help students acquire real-world skills and find a career they’re passionate about, and (2) to provide students and families with information about the CTE opportunities that are available.
The centerpiece of the campaign is a brochure. Given that brochures aren’t known for offering in-depth information, and that they likely aren’t the communication method of choice for students in middle or high school, that might not seem like something worthy of praise. But there are two important things to remember.
First, every district in Ohio is required to adopt a policy on career advising. These policies must specify how districts will provide career advising to all students in grades 6–12, train staff to advise students on career pathways, and “identify and publicize” courses that award students CTE credit. The department offers districts a career advising toolkit to help them accomplish these goals. But a concise, easy-to-distribute brochure that lays out students’ career pathway options should make districts’ jobs a lot easier—and thus make it more likely that the vast majority of Ohio students will end up with one of these brochures in hand.
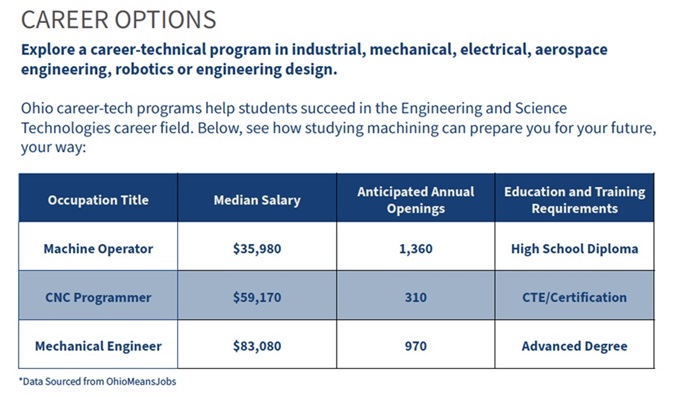
Second, the brochure itself—which provides an overview of career pathways and jobs associated with each of the state’s fifteen career fields—is a lot more informative than you might expect. For example, the section dedicated to the engineering and science technologies field identifies two pathways available to students—engineering and design, as well as robotics—and provides a list of associated careers. The brochure also identifies at least three specific occupations within each career field and lists the median salary, number of anticipated annual job openings, and education and training required. Below is an example of some of the information provided for the engineering field.
This information is a helpful starting point that gives students and families an idea of the jobs and opportunities available in a variety of career fields. But DEW didn’t stop there. For those who are interested in conducting a more in-depth exploration, the brochure provides a QR code that leads to the Ohio Means Jobs website. Here, students can select a career cluster (perhaps information technology) and then choose a career pathway that interests them (such as a computer network support specialist, a web developer, or an information security analyst). From there, they can explore the type of activities they might perform on a daily basis; an overview of the skills, knowledge, and abilities needed; necessary education, work experience, and training; and the typical salary and hourly wages for the bottom and top 10 percent of jobs, as well as the median. They can even explore current job listings to see what companies they could end up working for and where.
Making this information easily accessible should go a long way toward helping students figure out what they want to do after high school. But the campaign could also help reframe how parents and the general public view CTE and its connection to coursework. For example, when adults think of CTE, they often think of jobs in manufacturing (like a machinist) or transportation (like an automotive service technician). Those are, indeed, career fields and pathways available to students. But Ohio also offers courses and programs that are traditionally linked with higher education, fields like engineering, finance, and information technology.
Some parents—especially those with an outdated view of CTE—might also assume that it isn’t associated with well-paid, in-demand jobs. But as indicated in the brochure, that’s not true. An HVAC installer, for example, has a median salary of almost $51,000 with over 1,400 anticipated annual job openings. Welders, meanwhile, have a median salary exceeding $46,000 with more than 2,000 expected yearly openings. The education and training requirements for both these occupations are CTE and certification, not college, which means little to no student loan debt. These days, that’s an attractive option. And it’s a big step forward to have that information clearly presented to students and their families.
The bottom line is that CTE has something for everyone. By launching this campaign, DEW has taken an important step toward making sure Ohioans know that. There’s still plenty of work to be done, including making sure that these brochures actually get into the hands of kids and families. But for now, kudos to the revamped department for hitting the ground running.
Ohio’s superintendents and principals are ostensibly in charge of managing the operations of public schools. But, in reality, they typically have little latitude to do so. For many, their chief managerial constraint is that they are bound by the terms of collective bargaining agreements between school boards and district employees (“employee contracts”). These contracts, which can reach 300 pages in length, prescribe in exacting detail whom district leaders can consider for employment, what salaries and benefits they must offer, what workloads they can assign, how they must evaluate employees, and under what circumstances and in what manner they can attempt employee dismissals. They also often dictate far more than personnel management practices, imposing rules and procedures that prescribe how district administrators must make decisions on matters such as curriculum, student discipline, school closure, resource allocation, and testing.
Research (and common sense) tells us that binding the hands of public-school leaders in this way undermines their ability to meet the varied and evolving needs of students. If they lack the authority to manage personnel and make important decisions, then how much should we expect them to accomplish? It’s remarkable that superintendents and principals can move the needle at all when it comes to students’ academic outcomes. Indeed, research indicates that superintendents typically have a small impact on student achievement. A handful of rigorous studies reveal that principals can have a substantial impact on students’ academic and behavioral outcomes through their leadership and management of personnel and resources, but these studies draw primarily on data from a few states (especially Florida, North Carolina, and Texas) that were near the bottom in terms of union strength (and the likely restrictiveness of teacher contracts) around the time the data were collected.
The impact of superintendents and principals may be more muted in states that have strong public-sector collective-bargaining laws. But there is also significant variation in managerial discretion across states with strong bargaining laws. Research on teacher contracts in states with strong unions (California, Michigan, and Washington) indicates that the restrictiveness of teacher contracts varies significantly, even across districts within each state. Thus, regardless of whether schools operate in states with strong employee unions, the extent to which employee contracts restrict managerial discretion varies significantly.
How oppressive are districts’ employee contracts and how much does their managerial restrictiveness vary? Answering this question precisely is labor intensive. The most careful research on the topic coded 334 potential contract provisions for a sample of California districts, including 140 items related to benefits (e.g., do teachers get a bonus for having a doctorate?), 120 related to working conditions (e.g., the extent to which senior teachers control their building assignments), 46 regarding evaluations and grievances (e.g., whether teachers are exempt from performance evaluations), and 28 items related to association rights (e.g., the extent to which employees can take a leave of absence to conduct union business).
Fortunately, there is a more efficient way to code the restrictiveness of Ohio districts’ employee contracts. One can simply count the number of statements indicating that district personnel “shall” or “will” perform some action. After demonstrating that this proxy of contract restrictiveness is informative, I use the results of my analysis (which includes recently negotiated and currently active teacher contracts across 556 of Ohio’s 609 districts) to identify the fifteen districts with the most oppressive contracts. I conclude with a real-world illustration (courtesy of the Akron Education Association) of how such managerial constraints continue to directly harm Ohio’s most vulnerable students, as well as some hope that we can use this knowledge to push back and put kids’ interests first.
Measuring the restrictiveness of Ohio districts’ employee contracts
Scholars have tried a number of strategies to measure the extent to which laws and union-negotiated contracts restrict managerial discretion. The total number of pages or words in a contract are common proxies. The problem with these approaches, however, is that variation in word or page counts may be unrelated to contract restrictiveness. For example, contracts may have narrow margins (like a pamphlet), advertisements from union sponsors, introductory remarks from union representatives, and extensive appendices that provide forms or other information—all of which might drive up word or page counts without affecting a contract’s restrictiveness. Indeed, some scholars have expressed concern that word counts and length may largely reflect the idiosyncrasies of the legal and leadership teams that draft contracts, such as the language conventions that they use and their inclination to regurgitate state law. Finally, not all contract language is equally restrictive. A provision that describes employee dental benefits may not impede management as much as a provision that prescribes exactly how administrators must fill teaching vacancies.
It is for these reasons that two renowned scholars, Katherine Struck and Sean Reardon, precisely coded how each California contract they reviewed addressed 334 separate potential contract provisions. Due to resource constraints, in subsequent studies they coded a subset of forty-three provisions that explained the bulk of the variation in California contracts’ restrictiveness. Yet these resource-intensive studies revealed two important facts: 1) contract length can be a reasonable proxy for contract restrictiveness (at least when irrelevant text is removed); and 2) contract restrictiveness, if measured correctly, correlates with district size, as both are strongly tied to the strength of districts’ employee unions. I use these facts to generate and validate my easier-to-code measure of contract restrictiveness.
I requested from the Ohio State Employment Relations Board (SERB) every contract (for teaching and non-teaching employees) that Ohio boards of education agreed to between January 1, 2019, and December 31, 2023.[1] Among these 2,000+ contracts, I identified all contracts that were active as of January 1, 2024; scanned them using Adobe’s optical character recognition (OCR) software; and wrote code that cycled through each contract and counted the number of times the words “shall” or “will” appeared.[2] These counts should roughly capture the number of provisions that restrict managerial discretion while sidestepping some of the drawbacks of using word or page counts, such as varying margins and the inclusion of text unrelated to contract restrictiveness.
Based on the contracts SERB shared, I was able to generate measures of restrictiveness for the primary teacher contract (i.e., excluding contracts for particular types of teachers or for non-teaching employees) across 556 Ohio districts.[3] Table 1 (below) reveals that the typical Ohio district had two active employee contracts that contained 38,632 words and 898 instances of the words “shall” or “will.” In other words, the typical Ohio district’s contracts contain nearly 900 statements that likely restrict the managerial discretion of district leaders and administrators. The table also reveals that there is tremendous variation across Ohio districts in terms of the restrictiveness of the contracts they signed between 2019 and 2023.
Table 1. Number and length of active labor contracts in Ohio public school districts
To validate this measure of contract restrictiveness, I spot-checked a sample of contracts to confirm that these words primarily capture prescriptive statements, examined their frequency distribution compared to other words (like words such as “the,” “and,” and “a,” “will” and “shall” are often in the top ten of a contract’s most frequently used words), and correlated these counts with measures of district size, such as a district’s total residential population and student enrollment (correlations of 0.64 and 0.59, respectively). These correlations are comparable to those reported in the Strunk-Reardon study that coded 334 potential contract provisions.
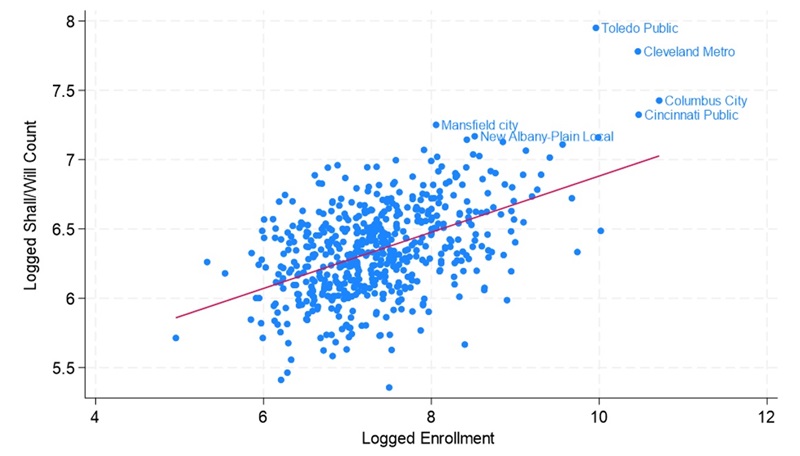
The figure below illustrates just how strong the relationship is between district enrollment and the count of “shall” and “will” in districts’ primary teacher contract. Although the axes are hard to interpret because the counts of restrictive provisions and district enrollments are logged (something that statisticians do so that very large districts with exceptionally restrictive contracts do not dominate the estimated relationship), the important takeaway is that there is a positive relationship between district size and my measure of contract restrictiveness. This fits the conventional wisdom among scholars that larger districts have more powerful unions and, thus, more restrictive contracts. Like the multi-state study I cite above, I found only a modest relationship between child poverty rates and contract restrictiveness. This suggests that restrictive contracts burden large districts regardless of wealth.
Figure 1. The relationship between district enrollments and the number of times a district’s primary teacher contract uses the words “shall” or “will” (restrictiveness proxy)
Which districts’ primary teacher contracts are the most oppressive?
In addition to demonstrating the relationship between district size and contract restrictiveness, Figure 1 reveals that some districts stand out. At the top righthand corner are the largest Ohio districts for which I coded contract data (Columbus City, Cleveland Metropolitan, Cincinnati Public, and Toledo Public). They have by far the most restrictive contracts. But some smaller districts (Mansfield City and New Albany-Plain Local) also jump out for having especially restrictive contracts.
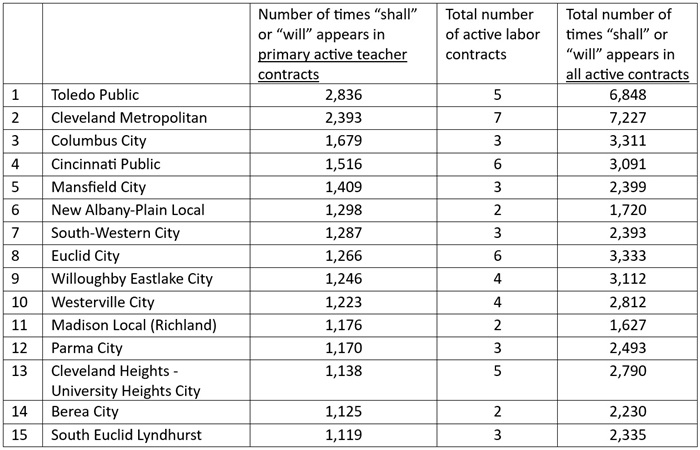
Table 2 provides a list of the top fifteen districts in terms of the restrictiveness of their primary teacher contracts, and it provides simple counts of restrictive statements containing “shall” or “will” (instead of hard-to-comprehend logged counts). By my measure, these districts’ primary teacher contracts are approximately 2–5 times as restrictive as the typical Ohio district’s contract. The gap is even bigger among the larger districts when one considers the total restrictiveness of all employee contracts combined (covering teaching and non-teaching staff).
Table 2. Ohio districts with the most restrictive active teacher contracts signed since 2019
Those concerned about strengthening our public schools should skim the Toledo Public Schools contract to get a sense for how impossibly difficult (and likely soul-crushing) it must be to try to manage districts operating under such constraints. To provide an example, I simply scrolled to a random page (truly!) in Toledo Public’s contract and ended up on page thirty-six. I then selected the first paragraph just below the primary subheading on that page (to provide a bit of context as to the topic at hand). I have highlighted mentions of “shall” and “will” in yellow (bolded text is from the original):
These words may not capture every directive in the paragraph—particularly since the paragraph references content that is delineated elsewhere in the document—but the frequency with which “will” and “shall” appear suggests to me that those words serve as a reasonable proxy for how restrictive these sentences are for the leadership of Toledo Public Schools. Now, consider that these leaders are subjected to over 250 pages of this type of language. How large of an administrative staff does one need to even keep track of these rules and procedures?
The excerpt above reminds me of an old stereotype about government bureaucrats being primarily concerned with following rules and routines, as opposed to prioritizing the pursuit of public goals. Such rule-following is understandable, as it means that district leadership is less likely to be bogged down by employee grievances and political battles for having violated some contract provisions (perhaps inadvertently), but it also implies that they are likely less focused on the primary goals of public education.
Alleviating contract restrictiveness requires limiting union power
The “top fifteen” districts above are, by my measure, forced to operate under the most oppressive managerial constraints. But it is important to remember that contract restrictiveness is essentially a proxy for union strength. Larger districts have stronger unions (more dues-paying members means more resources and political power), and districts with stronger unions tend to negotiate contracts that are more restrictive (as Figure 1 illustrates). In other words, administrators who work in districts with restrictive teacher contracts are likely constrained by broader political dynamics, even if those constraints are not explicitly stated in teacher contracts. Indeed, research has documented how union strength—as captured by contract length, union revenue, district size, or the presence of collective bargaining agreements—is a key predictor of the sustained school closures that seriously harmed Ohio’s most disadvantaged students.
Remarkably, in spite of widespread awareness of teachers unions’ culpability in undermining the education of low-income kids during the pandemic and, therefore, contributing to expanding student achievement gaps, unions continue to exact harm on these students. For example, Akron Public Schools recently received a grant of $156,000 from the state to contract with a firm that would provide one-on-one tutoring to struggling readers—one of the few effective remedies for pandemic-induced learning loss. Because of union pressure, however, the superintendent felt compelled to ask the Akron Board of Education to rescind that contract. And how did the Akron Education Association exert this influence? By claiming unfair labor practices and filing grievances and lawsuits based in part on the terms of their collective bargaining agreement. (Unfortunately, Akron is one of the districts that had no active collective bargaining agreement in the files SERB pulled on December 31. I’ll try to have a full accounting of Ohio school districts in my next set of rankings. In the meantime, Akron Public’s seven employee contracts are available here.)
To alleviate the burden of oppressive union contracts, one must address unions’ political clout. One way to do so is for the state to limit what unions can bargain over. For example, as I discuss in a prior post, research suggests that prohibiting unions from negotiating rigid salary schedules (“step and lane” systems based on academic degrees and seniority) led to measurable gains in the effectiveness of Wisconsin districts, as district leadership was better able to recruit and retain effective teachers. Lawmakers could also prevent districts from waiving their management rights in collective bargaining negotiations, as my colleague Aaron Churchill recommends in his recent Fordham report.
Another way to address oppressive contracts is to limit more fundamental sources of union bargaining power in contract negotiations, such as their right to strike, their ability to raise money from district employees, and their ability to mobilize district resources for political gain. These sources of broad-based political power effectively enable unions to influence the election of school board members (and, thus, who will be on the other side of the table during contract negotiations), the outcomes of districts’ tax elections, and even the outcomes of state and federal elections and policymaking. As Terry Moe and Michael Hartney have convincingly and painstakingly documented, teachers unions have accumulated considerable political power and, using that power, in turn have secured policy changes that allowed them to amass yet more power.
Ultimately, countering teachers unions’ sweeping political influence is the best way to limit their hold on district management and provide district leaders some space to manage. But parents, taxpayers, district leaders, and other concerned citizens can only push back if they are aware of the problem. My simple measure of contract restrictiveness is meant to enhance this awareness by shining a light on just how oppressive union contracts can be and who the most egregious offenders are.
Stéphane Lavertu is a Senior Research Fellow at the Thomas B. Fordham Institute and Professor at The Ohio State University’s John Glenn College of Public Affairs. The opinions and recommendations presented in this editorial are those of the author and do not necessarily represent policy positions or views of the John Glenn College of Public Affairs or The Ohio State University.
[2] Fordham Institute President Mike Petrilli rightfully suggested other words like “must” could be good candidates. In the future, I hope to use a broader set of words and a more sophisticated algorithm to capture contract restrictiveness more precisely. Nevertheless, “shall” and “will” were the most common words in the set of contracts on which I conducted my original run.
[3] At least a dozen teacher contracts are not accounted for because I received them after running my program (which took several days), and a handful of others are missing because Adobe’s OCR could not generate readable files.
When it comes to facilities, Ohio’s public charter schools have long gotten the shortend ofthe stick. They’re excluded from the state’s main school construction program, which has sent billions to school districts for high end facility upgrades over the past couple decades. Unlike districts, charters don’t receive any local taxpayer support for capital improvements either. Thankfully, the state does provide a per-pupil facility allowance that covers a portion of charters’ building expenses (e.g., rent and utilities). But their meager resources overall thwart more ambitious building projects that would allow them to occupy more suitable educational spaces and expand to serve additional students.
Recognizing these challenges, Ohio policymakers have made efforts to help charters access vacant or underutilized district-owned buildings via right of first refusal laws.[1] As outlined in statute, districts must offer to charters[2] buildings that meet one of two conditions: (1) any type of facility (e.g., instructional or administrative) that has not been used for one year or (2)an instructional-use facility in which less than 60 percent was used for “direct academic instruction” during the previous year.When a building meets one of these conditions, it’s deemed “unused” and the district must offer it to charters located within its territory for lease or purchase (the district decides which one).
High-performing charters[3] are first in line for an unused facility. If more than one is interested, an auction (for a sale) or lottery (for a lease) is held to determine the buyer. When no high-performers are interested, other local charters are next in line (with the same auction or lottery process if multiple entities are interested). Should there be no interest whatsoever in the facility, the district may either auction it to other entities or retain ownership. The facility must be sold or leased for at least “appraised fair market value.”
Having these provisions on the books is an important first step. Yet questions have emerged about just how accessible unused facilities are for charters in practice. For one, there are concerns that districts, which are loathe to compete with charters, are sidestepping these requirements and withholding buildings. Back in 2016, nearly half of charter leaders reported that districts were “generally uncooperative” in making facilities available. In 2019, former Auditor of State Dave Yost noted in a report that “efforts by school districts to prevent charter schools from employing unused district school buildings is an issue.” In 2020, the Columbus Dispatch ran a troubling story about the city’s school district giving the high-performing United Schools Network (whose schools Fordham authorizes) the runaround after it expressed interest in purchasing a vacant school.
A look at recent enrollment data also raises questions. In Youngstown, for example, East High School enrolled just 522 students in 2022–23, while it enrolled more than 1,300 students eight years ago. In Cleveland, Collingwood High School enrolled just 304 students last year, but enrolled 600 students a decade ago. And in Columbus, Innis Elementary School enrolled 214 students last year but served more than 400 students in 2014–15. These aren’t the only underenrolled schools, of course, and others could fall into that category if district enrollments continue to slide. How many schools operate at less than 60 percent capacity, but haven’t been offered for lease or purchase?
Finally, cost issues remain for charters seeking to purchase an unused facility. In some circumstances, the market value of a school building can run into the hundreds of thousands or even millions of dollars, making a purchase—plus possible repair and renovation expenses—cost-prohibitive. This, along with the restrictive language allowing only local charters to vie for the facility, may be why districts often end up selling unused facilities to otherentities. It may also explain why only a handful of charters are located in former district buildings.
To address these issues, state lawmakers should work to strengthen the right of first refusal law in the following ways.
Require districts to report unused facilities to the Ohio Department of Education and Workforce, and then require the department to publish a list of such facilities and verify that they’ve been offered first to charters. Currently, there is no centralized record of which facilities are “unused” or confirmation that districts have indeed offered them to charters. Increased transparency and a verification process would help confirm that districts are following the law. A regularly updated list of unused facilities would allow charter leaders to know which buildings are available at a given time.
Tighten the language around what it means for a building to be operating at less than 60 percent capacity. Current statute that designates a severely underutilized building as “unused” is too vague and could allow districts to avoid offering such schools to charters based on technicalities.[4] For instance, a district could claim that 65 percent of the classrooms in a building are in use even if classrooms meant for twenty-five students are being used for just five. To make the capacity provision more concrete and enforceable, legislators should create a clearer enrollment- or occupancy-based standard (e.g., building enrollment is below 60 percent of its designed enrollment capacity).[5]
Allow all Ohio charter schools—no matter their location—to seek an unused district facility. As noted above, only charters located within a district’s boundary can purchase or lease an unused facility. To be sure, high-performing charters located in the district should continue to have first priority. But should no local high-performers express interest, all charters in the state and out-of-state charters that received approval to open should be able to buy or lease the building. This would allow Columbus-based charters to more easily expand into Cleveland (and vice-versa). It would also give existing charters an avenue to secure facility space in districts where charters have never had a significant (or any) presence.
Require districts to sell or lease the building for an amount less than the “appraised fair market value.” This would make acquiring a facility more affordable for charters, especially in areas with higher real estate values. Remember, taxpayers have already paid for these facilities, so providing them to charters at low cost isn’t a financial loss to the district. As for what the value should be, legislators could follow the Indiana model, which requires unused buildings to be offered for $1. If that isn’t politically workable, they could require sale or lease at half the building’s market value, or an appraised value as an educational facility (not private development). Lowering the price point would encourage more interest from charters and better ensure that school buildings retain their original purpose—to educate a community’s students.
Move to a lottery system to determine which charter (whether among high-performers or all charters) may purchase an unused facility. This shift, which would follow the current process for determining a lessee, would avoid an auction in which the price could get bid up beyond the fair market value (or some percentage of it, if recommendation four is adopted). An auction likely advantages more established charters over smaller startups that operate on tighter budgets, even if both are well-positioned to put the facility to good use. A lottery would put charters on equal footing when multiple parties have interest in the building.
Create a credit enhancement and/or revolving loan fund to support facility purchases. Expensive capital projects typically require charters to seek financing, as they aren’t likely to have saved enough for such projects. Legislators can defray financing costs for charter schools by creating a credit enhancement and/or revolving loan program. This would make the purchase of an unused district facility that needs major repairs more financially viable (as well as purchases and renovations of other types of properties—e.g., a commercial building). It would also allow charters to keep more money in the classroom instead of paying debt service.
Ohio’s right of first refusal law provides an avenue for charter schools to obtain purpose-built educational facilities often at more reasonable cost than other building options. It also helps ensure that districts are not hoarding vacant properties, perhaps letting themdeteriorate from neglect, or spending inefficiently by operating half-empty buildings. However, the policy has not opened access to unused district buildings in quite the way that one might hope. With some modifications to this section of law, more charters—whose enrollments are swelling—will be able to breathe new life into buildings that have long served students in their communities.
[1] This piece focuses on a mandatory disposal of a district facility. Districts may also choose at their own discretion to dispose of a facility. Local charters also have the right of first refusal in those cases, too.
[2] Independent STEM schools also have a right of first refusal alongside charters. However, there are only eight such schools in the state, so this piece focuses on charters’ access to unused district buildings.
[3] In general, a “high-performing” charter school under this section of law earned at least three stars on the state’s performance index and at least four stars on the state’s value-added growth measure on its most recent report card.
[4] The exact language is: “Any school building [is ‘unused’] that has been used for direct academic instruction but less than sixty per cent of the building was used for that purpose in the preceding school year.”
[5] Indiana legislation has a much clearer occupancy- or enrollment-based standard to determine whether a school is underutilized (see page 10).
Over the course of the pandemic, the number of chronically absent students in Ohio skyrocketed, as it did nationally. In 2018–19, Ohio’s statewide chronic absenteeism rate was just under 17 percent, meaning that one in six students were missing at least 10 percent of instructional time. By 2021–22, the statewide rate had jumped to a whopping 30 percent; it ticked down to 26 percent during the most recent school year. Given the well-known negative impacts of chronic absenteeism, as well as lingering learning loss, it’s a significant problem that over a fourth of Ohio students are missing so much instructional time.
State leaders have floated several ideas aimed at addressing the issue. Last fall, the Ohio Attendance Taskforce released a series of recommendations aimed at bolstering attendance. More recently, a legislative proposal to provide cash incentives to kindergartners and ninth graders for regular school attendance has been making the rounds.
It’s understandable that state leaders are eager for solutions. This is a serious problem that has significant short- and long-term impacts on kids. But state policy alone won’t solve the chronic absenteeism problem. It’s local action and decision-making that will drive change.
Consider the Dayton Early College Academy (DECA), a charter school in Dayton. During the 2021–22 school year, DECA registered a chronic absenteeism rate of 30 percent. Rather than cast blame or shrug off responsibility, DECA staff rolled up their sleeves and got to work. They interviewed students and families to determine barriers for attendance. They hosted spirit days and family events to build positive relationships. And staff educated families on the impact of missed instruction, including that excused absences can be just as problematic as unexcused ones. These efforts paid off. During the 2022–23 school year, the chronic absenteeism rate at DECA dropped to 19 percent. Similar efforts in Columbus City Schools and Delaware City Schools have also proved successful.
These are clear, Ohio-specific examples of how school-led efforts are the most promising way to boost attendance. But that doesn’t mean that state lawmakers are helpless. In fact, the state plays a crucial monitoring role. Accurately tracking attendance and transparently reporting data is critical because, otherwise, we have no way of knowing the size and scope of the problem. For example, last fall, lawmakers in the House proposed prohibiting the department from including absences for which a student has a legitimate excuse in the calculation for the chronic absenteeism indicator on school report cards. But if schools are permitted to forego tracking absences because they are “excused” or “legitimate,” it will only appear that chronic absenteeism rates have improved. Hiding the ball won’t solve the problem. The negative impacts of missing school will remain.
State leaders who are feeling pressure to do more than just hold the line could take a page out of the early literacy playbook. Like chronic absenteeism, early literacy has a huge impact on students’ short- and long-term outcomes. Also, like absenteeism, improving early literacy hinges on local effort. In last year’s state budget, lawmakers figured out a way to leverage state policy to improve reading instruction in schools. These efforts offer a roadmap on how lawmakers can also respond to chronic absenteeism.
For example, during the upcoming school year, public schools will be required to use reading curricula that appear on a state-approved list of high-quality materials. The state already offers schools plenty of guidance on effective attendance intervention strategies. But just like they did with reading curriculum, state leaders could take it a step further and create a simplified, easily-accessible list of state-approved attendance interventions. Districts and schools with chronic absenteeism rates over a certain threshold could be incentivized to implement interventions from this list.
School-based coaching is another possibility. Last year’s budget allocated up to $18 million to pay for literacy coaches, who will be sent into schools with the lowest rates of reading proficiency. During next year’s budget cycle, lawmakers could set aside funding to send trained attendance coaches into districts with the highest rates of chronic absenteeism. These coaches could work with teachers and administrators to revise and improve their absenteeism prevention and intervention efforts.
The upshot? Chronic absenteeism is a problem that schools and local communities must address. But lawmakers aren’t powerless. Holding the line on data tracking and transparency is firmly in their control. So, too, is the power to incentivize schools to implement evidence-based strategies and to broadly share examples of what’s working. As was the case with early literacy, the goal for state policymakers should be to provide schools with the resources and funding they need to improve—and then hold them accountable for doing so.
The scale of student absenteeism today is large and worrisome, exacerbated by pandemic disruption to the routine of school. But the problem itself is not new, and numerous efforts have been undertaken over the years to address it. One of those is the Early Warning System Network (EWS), which has been in place in various forms since the 1980s. EWS is intended to predict those students who are at risk of multiple absences and to flag them to school administrators before the problem becomes chronic. New research indicates that it’s positive step toward a solution but not enough by itself.
Indiana University researcher Yusuf Canbolat looks at data from an unnamed school district in the southeastern United States. The district is large and socioeconomically diverse, with approximately 80,000 students. Just over half are low-income, as determined by eligibility for free or reduced-price lunch. Sixty percent of students are White, 24 percent are Hispanic, and 8 percent are Black. The study covers attendance data from the 2020–2021 and 2021–2022 school years, excluding kindergarten and twelfth grade students who do not have two consecutive years of data, for a total sample of 66,223 students. In both years, in-person school was the default although virtual schooling was available to families who wanted it. Absenteeism was counted the same in both in-person and virtual modes, and days in quarantine were not counted toward absence for any student.
The district requires schools to use EWS to monitor student absenteeism and to trigger intervention. EWS categorizes the risk levels based on the percentage of missed instructional time, which is equivalent to the percentage of absent days, either excused or unexcused, in a school year. District rules count students present if they attend at least one period in a day. EWS identifies students who miss less than 4 percent of instructional time during a school year as “on track”; those who miss more than 4 percent but less than 10 percent as “at risk”; and those who miss more than 10 percent as “off track.” Based on those cut-offs, 56 percent of the students were identified as on track; 28 percent as at risk; and 16 percent as off track in the 2020–2021 school year.
Canbolat’s models use students who are just above the “at-risk” and “off-track” thresholds as the two treatment groups—with the treatment being the simple act of applying those EWS labels to those students—while the control groups are their peers who are just below each cutoff.
He finds that EWS identification has no significant effect in reducing either moderate (at-risk) or chronic (off-track) absenteeism among low-income students, as well as moderate absenteeism among their higher-income peers. EWS identification did, however, reduce chronic absenteeism for higher-income students by 22 percent (or 1.3 percentage points).
We don’t know what which actions districts took no action in response to EWS triggers, but something positive is likely occurring with regard to higher-income students who reach the off-track threshold. For everyone else, perhaps the interventions are misaligned with the various causes of absenteeism—especially across socioeconomic strata—and are thus insufficient to change students’ trajectories. For example, if a student is absent because he must work a job late into the weekday evenings, no amount of pep talks about the importance of school—nor any amount of suspensions even—will change his patterns. Likewise, a typical attendance intervention will likely not motivate a bullied student to attend school every day, no matter how important they deem education.
In the end, an early warning system for student absenteeism is only as good as the interventions that follow. In this district, and probably many others, the causes of absenteeism are so resistant to existing remediation efforts that the warning might as well be sounding in a vacuum.
Marginalized students have long lacked access to advanced education programs in the U.S., compared to more advantaged peers, and have been under-identified and therefore underserved when such programs exist. Research also suggests that these “opportunity” and “excellence” gaps—nearly ubiquitous in elementary, middle, and high schools—are worsening post-pandemic due to learning interruptions that were experienced unequally by low-income, Black, Hispanic, and Native American children.
RAND Corporation’s multi-year American Mathematics Educator Study (AMES) recently shed further light on these problems. Although focused on the entire spectrum of math achievement, not specifically the high end, its findings are highly relevant to advanced education—and plenty depressing. The study was announced in October 2023 with the goal of finding and explaining “key factors that shape equitable, high-quality mathematics teaching and learning,” to be used as baseline data necessary to remediate the stark declines in student math achievement witnessed as a result of pandemic-era school disruptions. The very first research findings were released this month, looking at school “structures” that may facilitate or limit access to math learning opportunities for students in elementary and middle schools. (A high school report is coming in the near future.)
The research team, led by Julia H. Kaufman, defines “school opportunity structures” as the systems and resources in place to support students in their mathematics education. Specifically, the three structures studied are: grouping of students by achievement, and their subsequent access to rigorous mathematics courses; whether students have access to certified, knowledgeable math teachers and principals; and the availability of and access to additional supports for struggling students beyond standard classroom instruction. Most of the findings center on the existence (or not) of these structures, with a lesser focus on utilization. And the first two areas, especially—achievement grouping and knowledgeable teachers and principals—are relevant to opportunity and excellence gaps in advanced education.
Data come from a spring 2023 survey given to nationally representative samples of teachers and principals from RAND’s American Teacher Panel and American School Leader Panel. The present report is based on responses from 2,505 teachers of mathematics (including elementary teachers of all subjects) and 2,293 principals across all grades K–12 (but including answers specific to K–8 grade bands only). Responses are weighted to be representative of the national population of K–12 teachers and school leaders. However, the researchers also oversampled teachers and principals in the four largest states—California, Florida, New York, and Texas—to provide some state-level comparisons.
They report that a majority of principals nationwide (59 percent) say their schools do not group students by math achievement in the elementary grades. That percentage effectively flips in middle school (grades 6–8), which still means that more than one-third of schools aren’t doing this. Among middle schools that do, principals report an almost even split between students grouped by achievement within their math classes (that is, several smaller groups within a single classroom) and those grouped into their mathematics classes (students of different achievement levels learning in different classrooms).
The most commonly reported means by which students are assigned to groups are diagnostic or benchmark assessment (reported by 85 percent of principals) and teacher recommendation (83 percent). Principal recommendation is the least commonly reported means (15 percent), with parent/guardian request in the middle at 42 percent. Relevant to opportunity gaps: Parental requests for math class assignment are reported by 50 percent of principals in low-poverty schools versus just 30 percent in high-poverty schools.
The research team also zeroed in on Algebra I offerings in middle school, as introductory algebra has long been considered a “gateway” course to participation in higher level math in high school—provided students can take and pass it by the end of eighth grade. Eighty-five percent of middle school principals reported that Algebra I was offered in their schools—meaning one in every six schools did not offer the course—while 65 percent of them said they offer the course but restrict it to certain students. This latter group of schools likely gatekeeps enrollment via prerequisites like course completion, letter grades, test scores, teacher or principal approval, parental pressure, or a combination of these. This can be a good thing if the students excluded truly aren’t yet capable of success. But too often, schools rely on inequitable metrics that are biased against marginalized subgroups and therefore leave out otherwise prepared students and contribute to the opportunity and excellence gaps they should be trying to narrow. (Here’s where the report’s lack of utilization information is a small weakness.) Worse, however, are California-specific data that echo other research showing the “unambiguously harmful” impacts of the state’s Algebra for All initiative, which had the main effect of moving Algebra access to ninth grade (at the earliest) for a majority of students.
Also concerning is that too few math teachers report being certified to actually teach their subject. This is true of one-third of middle school math educators and nine out of ten in the elementary grades. This likely reflects different licensure requirements for those grade bands in various states—and, indeed, most states only require generic elementary education certification in grades K–5. But it combines to call into question schools’ ability to offer rigorous, high-quality math instruction that provide students with the sort of solid early-grade foundations necessary to prepare more of them for advanced courses in later years.
All of this together adds up to poor prospects for narrowing opportunity and excellence gaps in advanced education. Research tells us that the structures that the RAND study found lacking in schools across the country—accelerated classes like Algebra 1 in middle school and achievement grouping—significantly improve the learning outcomes of advanced learners. Acceleration is “one of the most-studied intervention strategies in all of education, with overwhelming evidence of positive effects on student achievement,” as scholar Jonathan Plucker puts it. Numerous high-quality studies have found that arranging students by academic achievement in the same or separate classrooms is a net positive for advanced students and isn’t detrimental to their peers. And as another RAND resource puts it, “teachers matter more to student achievement than any other aspect of schooling,” so having such a large number of K–8 math educators lack certification in the subject may also be negatively impacting achievement—no matter how standard this practice is across states and school systems in the elementary grades.
The structural problems laid bare here are significant, but they’re also, of course, fixable. We know what works. Build the structures! Doing so would help improve achievement for all students, as well as narrow excellence gaps in advanced education. Consider, for example, the thirty-six recommendations put forth by The National Working Group on Advanced Education (of which one of us was a member) in its final report, Building a Wider, More Diverse Pipeline of Advanced Learners. That may seem like a large number of steps, but the core principle is simple: Become a champion for excellence and equity. As this RAND study shows, too many schools are failing at both.
In the post-pandemic era, Ohio’s K–12 education system continues to be the source of much debate. A mix of hot-button and bipartisan policies ranging from workforce readiness to early literacy to school funding to quality educational choice are drawing attention at the Statehouse and in communities statewide.
Clear and accessible education data has never been more important, and thus we are pleased to present our latest version of Ohio Education by the Numbers.
In its seventh edition and updated for 2024, this publication contains a wealth of data on student enrollment, school options, performance on state and national exams, post-secondary readiness, educators, and school funding. In the area of readiness, for instance, we include the most recent trends in industry credentials earned by students, dual enrollment participation, and college enrollment and completion.
Whether you’re a lawmaker, reporter, community or business leader, or a parent or grandparent, this booklet is designed for you. As a readily accessible resource, we hope you’ll find it to be a go-to guide as you discuss education in your community.
You can download a PDF version of the booklet by clicking the link to the right, or you can view these data online at our companion webpage, www.OhioByTheNumbers.com.
A few decades ago, Career-Technical Education (CTE) was considered a path to nowhere. Typically called “vocational education” or “vo-tech” at the time, these courses were too often seen as a dumping ground for academically struggling students who were deemed incapable or unwilling to participate in traditional academic courses.
Recognizing that today’s students deserve better, that schools have an obligation to better prepare their students for the future, and that employers and the broader economy depend on a skilled workforce, state leaders in Ohio and elsewhere have worked hard to transform CTE programs and courses. Traditional academic skills and knowledge are now integrated with technical, job-specific skills that aim to prepare students for careers in high-tech, in-demand fields. At the high school level, effective CTE programming can provide students with the opportunity to earn industry-recognized credentials and postsecondary degrees. It can open the door to entry-level jobs. And it can also connect students to higher education programs, typically through community colleges that offer specialized training within a career field.
Ohio now has a vibrant CTE sector, and tens of thousands of high school students are availing themselves of these options. In 2021–22, over 135,000 secondary students were CTE participants, meaning they completed at least one CTE course that year. Of these, roughly 83,000 were CTE concentrators—students who earned two or more credits in a single career pathway. Since 2014, the number of high school students earning industry-recognized credentials has also steadily increased, from just under 9,000 credentials earned by the graduating class of 2014 to over 78,000 credentials among the class of 2022. The state budget bill passed in July 2023 includes a quarter billion dollars in new funding to expand the capacity of CTE providers, increase student participation in high-quality programs, and bolster initiatives like the Innovative Workforce Incentive Program, which aims to increase the number of students who earn qualifying industry-recognized credentials in “priority” industry sectors.
One key reason why participation and credential attainment have increased in Ohio is because beginning in 2014, state law required every public school (with a few exceptions) to ensure that students in grades 7–12 have the opportunity to enroll in CTE programming in state-approved career fields. How students access these opportunities—and how many options they have— depends primarily on where they live and what school they attend. There are also additional opportunities available through programs like College Credit Plus, Ohio’s statewide dual enrollment system.
But Ohio’s CTE system still needs work. It’s uneven and complex, which can lead to confusion and missed opportunities. The average student and her family may not realize which programs and courses are available, or may be unaware of the many benefits of participating in CTE. The average taxpayer may not realize how important it is for Ohio to continue improving, expanding, and investing in its CTE programs.
In this paper, we provide a broad overview of the various ways in which Ohio high schoolers can participate in CTE, and the benefits they can expect to derive from their participation.[1] Although there are plenty of areas across the sector that are ripe for improvement, recommendations for addressing these issues will come later, via additional in-depth analyses. This paper is designed to function merely as a directory of the state’s various CTE pieces and parts, so that policymakers and advocates have a common foundation—as simplified as possible, and all in one place—from which to move forward.
Who provides CTE and what types of opportunities do students have?
In Ohio, CTE programming is delivered through Career-Technical Planning Districts (CTPDs). These are distinct organizational structures that must meet state requirements and standards to offer CTE programming to students. There are three structures for CTPDs:
Comprehensive CTPDs
These are single school districts that provide CTE programming at schools or career centers located within district boundaries. Typically, students access this programming the same way they access traditional academic classes, as CTE courses are part of the district’s available course offerings. Comprehensive CTPDs are governed by the same local school board and superintendent responsible for operating the traditional district. They are funded via local taxes collected for the district, as well as through state and federal subsidies.
For example, the state’s largest district, Columbus City Schools, operates a comprehensive CTPD that offers nearly forty CTE programs to Columbus City Schools students, but also to students enrolled in other districts, charter, and STEM schools. It includes two career-technical centers that serve both juniors and seniors: Columbus Downtown High School, which is a full-day career center and offers both academic and CTE courses, and the Fort Hayes Career Center, which offers half-day CTE courses in certain career pathways.
Compact CTPDs
Compact CTPDs are groups of districts that collaborate and combine resources to offer CTE programming. Typically, different programs and courses are offered at various schools and buildings within member districts.
For example, the Six District Educational Compact in northeast Ohio is comprised of six suburban districts: Cuyahoga Falls, Hudson, Kent, Stow-Munroe Falls, Tallmadge, and Woodridge. It offers students who attend any of these districts a menu of twenty-eight CTE programs from which to choose. This includes programming and software development, athletic health care and fitness, an aeronautics careers academy, and a biotechnology academy. If a student is interested in participating in a program offered at a building other than the one they currently attend, they can attend half the day in their home school and the other half at their CTE school. Bus transportation is provided, and students can still participate in extracurriculars, like sports or marching band, in their home schools. Compact CTPDs like the Six District Educational Compact are governed by the board and superintendent of a lead district, which is always one of the compact’s member districts. They are funded via local taxes collected by participating districts and through state and federal subsidies.
Joint Vocational School Districts (JVSDs)
These districts operate as independent school districts and primarily offer CTE programming. Each one serves a geographic area containing adjacent school districts. Districts that do not directly provide CTE programming for their students—meaning they are not a comprehensive CTPD and do not participate in a compact CTPD—make CTE programming available to their students by partnering with a JVSD. Students can attend a JVSD full or part-time. JVSDs typically provide programming in a dedicated CTE-focused building, though they can also offer programming within member schools through satellite programs. For example, the Jefferson County JVSD serves several traditional districts as well as Steubenville Catholic Schools. It offers students fifteen CTE programs and boasts a full-service restaurant operated by its culinary arts students.
Students who aren’t enrolled in one of the districts served by the JVSD can still attend the JVSD if it has adopted a policy permitting open enrollment, as several in Ohio do. Because JVSDs are independent from traditional public districts, each one is governed by its own board. By law, their boards have many of the same powers, duties, and authority over management and operation as do traditional districts. They consist of appointed representatives who serve three-year terms, and can either be current elected board members from the participating district, or individuals with appropriate experience or knowledge. JVSDs are funded through local taxes and levies in participating counties, but also by state and federal subsidies.
Common features of CTPDs
Ohio has twenty-five comprehensive CTPDs, fifteen compact CTPDs, and forty-nine JVSDs.[2] Every public high school in Ohio—including charter and independent STEM schools—must be part of one of these CTPDs. As such, the CTE programming available to high schoolers varies across the state and depends on the CTPD option chosen by a student’s school. There are, however, some common features across all CTPDs.
Programming
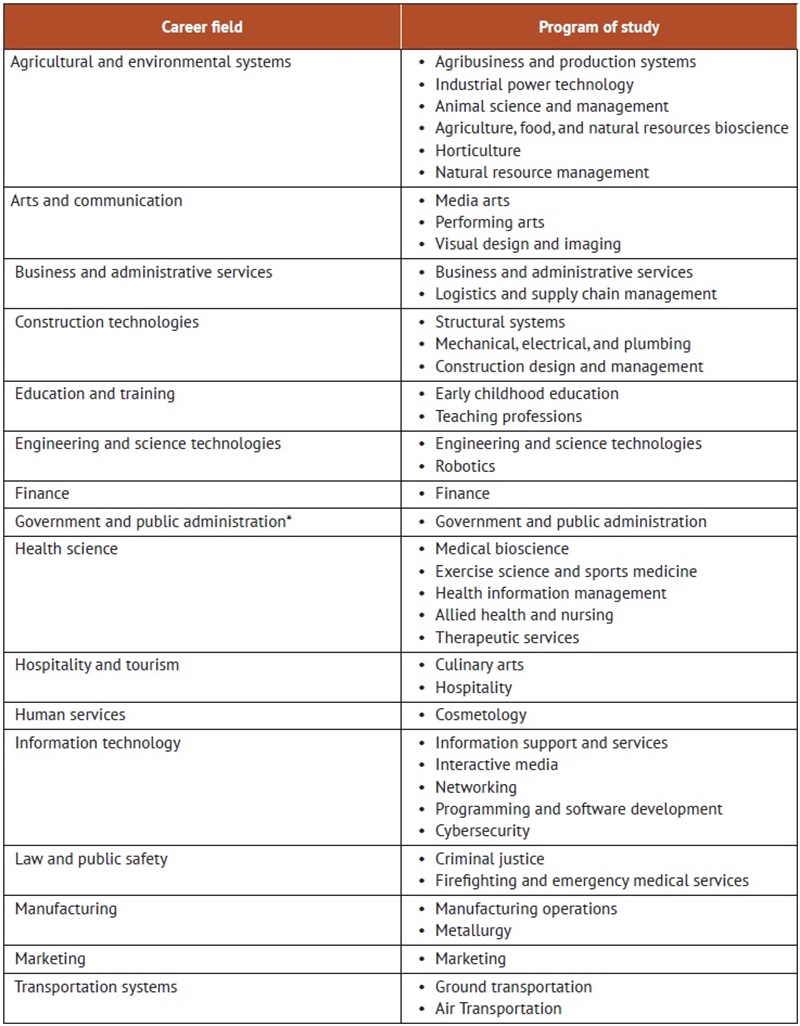
State law requires that CTPDs provide students with courses representing twelve programs in at least eight career fields. CTPDs with fewer than 2,250 students enrolled in grades 7–12 are only required to provide courses in ten different programs in at least eight career fields. In total, Ohio supports thirty-nine programs of study across sixteen approved career fields. The state establishes content standards for each career field, as well as course titles, descriptions, and outlines. The sixteen fields and their associated programs of study are listed below.
Work-based learning
One key feature of CTE is that it offers students the ability to get hands-on experience in their chosen career field via work-based learning. Although the specific work-based learning opportunities available to students depend on the CTPD they attend and the career field and program they choose, the state has established several guiding principles for these experiences. For example, experiences must occur at a work site and must be supervised by an instructor and an employer or business mentor. The state also recognizes several types of work-based learning, including internships and apprenticeships.
Alongside what’s offered through CTPDs, several state-funded programs help incentivize employers to create additional opportunities for students. For example, the High School Tech internship provides high school students with work experience in technology-related roles. Under this program, employers who hire high school interns in tech-related roles can be reimbursed for wages if students are employed for a minimum number of hours and are paid at least $12 per hour. The state also offers a tax credit certificate program for employers that offer work-based learning experiences to students.
Assessments
Students enrolled in CTE pathway programs are required to take end-of-course exams for each course in which they are enrolled. These exams are designed to cover the material identified in course outlines provided by the Ohio Department of Education and Workforce. The department also annually updates a CTE assessment and program matrix.
CTE exams are developed and administered by Ohio State University’s Center on Education and Training for Employment (CETE) via a proprietary system called WebXam. The majority of pathway programs have established end-of-course tests. However, because the state has been in the process of transitioning to a new model of testing in recent years, there are a few that still await development of their exams. There are three levels that CETE uses to delineate student performance: nonproficient, proficient, and advanced.
College Credit Plus
College Credit Plus (CCP) is a state-run, state-funded dual-enrollment program that offers academically eligible students in grades 7–12 the opportunity to earn postsecondary credit by taking college courses for free before high school graduation. State law requires all public schools serving eligible students to participate in CCP. This means that every student who meets CCP eligibility guidelines can access available postsecondary CTE courses through CCP, regardless of their assigned CTPD. The percentage of students statewide who have enrolled in CCP technical courses—defined as those that are part of an associate degree program of technical education—has modestly increased over the years. Roughly 13 percent of courses taken during 2015–16 were technical, compared to 15 percent during 2021–22.
The benefits of participating in CTE
Students who participate in CTE can benefit in a variety of ways depending on their chosen program and career field. Potential outcomes include the following.
Industry-recognized credentials
One of the key benefits of CTE is the opportunity for students to earn industry-recognized credentials that demonstrate their knowledge and skill mastery. Credentials verify a student’s qualifications and competence via a third-party, and signal to employers that job applicants are well–prepared. They can be prerequisites to certain jobs, and can also boost earnings and employment.
Certificates are earned when students successfully complete a training, course, or series of courses. Although certificates are issued for specific skills or competencies within one or more industries or occupations, they don’t always have a meaningful impact on a student’s job prospects. Some certificates may be part of hiring criteria but not associated with critical job tasks, or may be viewed by employers as desirable but not required. Certificates can also be awarded for attendance or participation.
Certifications indicate a student’s mastery of specific knowledge, skills, or processes that are measured against a set of accepted industry standards. Certifications are not tied to a specific educational program, but are typically awarded to students via an assessment or a validation of skills in cooperation with a business, trade association, or other industry group. To maintain a certification, students are usually required to meet ongoing requirements.
Occupational licenses are awarded by state government agencies and are often required for students to obtain specific jobs or positions.
Students can earn industry-recognized credentials by completing a comprehensive CTE program, by completing courses that integrate the content needed to obtain the credential, or via a state program dedicated specifically for students in their senior year of high school. Every credential is assigned a point value between one and twelve. Point values are based on employer demand and/or state regulations and often signal the significance of the credential. For example, within the health career field, credentials for CPR first aid or blood-borne pathogens compliance training are each worth one point. In that same career field, earning a state-issued license through the Ohio State Board of Pharmacy to become a Certified Pharmacy Technician is worth twelve points.
High school diploma
In addition to gaining specific job skills, students can use the CTE credits and experiences they’ve accumulated to meet Ohio’s graduation requirements. State law provides students with multiple pathways to demonstrate their academic competency and earn a diploma, and one of those pathways focuses on career experience and technical skill. It requires students to complete two of the following seven options. One of the completed options must be from the “foundational” category.
Foundational options
Earn a cumulative score of “proficient” or higher on three or more WebXams in a single career pathway;
Earn a twelve-point approved industry-recognized credential, or a group of approved credentials totaling twelve points in a single career field;
Complete a pre-apprenticeship program recognized by the Ohio State Apprentice Council (OSAC), complete an OSAC registered apprenticeship in the student’s chosen career field, or, if the program requires a student to be eighteen or older, show evidence of acceptance into an OSAC registered apprenticeship program after high school;
Obtain a state-issued license, such as an Ohio Commercial Driver’s License, for practice in a vocation that requires an examination.
Supporting options
Complete a 250-hour work-based learning experience with evidence of positive evaluations;
Earn the workforce readiness score on WorkKeys, which is a career assessment created by ACT to measure foundational skills required for success in the workplace;
Earn the Ohio Means Jobs-Readiness Seal, which requires students to demonstrate proficiency in fourteen state–identified professional skills evaluated by three mentors from school, work, or the community.
College credit
Another benefit received by students who complete CTE courses through College Credit Plus is simultaneously earning secondary and post-secondary credit. But CCP isn’t the only way that students can earn college credit for the CTE courses they complete. They can also do so through articulation agreements.
Articulation agreements are arrangements between secondary schools and colleges or universities that link high school–level courses to similar college courses. These agreements can be narrow—focused on a partnership between a single secondary school and a university—or they can extend statewide. Obtaining credit is a relatively simple process: Students request college credit for secondary classes they passed using a verification form. The Ohio Department of Higher Education, which administers articulated credit programs, has an online credit transfer tool that enables students to look up equivalencies for coursework, credentials, and experience. Articulated credit shows up on a student’s college transcript but does not include a course grade.
The majority of dual-credit options focus almost exclusively on traditional academic courses. For many students, this traditional route fits their postsecondary and career plans. But for the thousands of high schoolers who are enrolled in CTE programs, traditional dual-credit options aren’t always as useful. That’s where Career-Technical Credit Transfer, a type of articulated credit, comes in. State law requires that the state Departments of Education and Workforce and Higher Education create a policy that allows students to transfer technical courses to state institutions of higher education. The departments have opted to fulfill this mandate in two ways: through bilateral articulation agreements and Career Technical Assurance Guides (CTAGs).
Bilateral articulation agreements are arrangements between a secondary CTE program and a higher education institution. In essence, they are written assurances that courses completed in a secondary CTE program will count for credit at a particular college or university offering a program in the same field. Colleges outside the agreement can also award credit, but they aren’t required to do so. This option is typically utilized by career tech centers, and can include local business partners as part of the agreement.
CTAGs, on the other hand, are statewide articulation agreements. This means that, by law, all public colleges and universities are required to award postsecondary credit for particular CTE courses. Not every CTE course is included in a CTAG, but there are a wide variety of program options, like virtual design and imaging or electrical engineering technology, that transfer to a wide range of institutions. The state requires students to meet standards—such as successfully completing the course and earning a qualifying score on the corresponding end-of-course exam—to receive credit via a CTAG. Students must seek credit within three years. The state also has Industry-Recognized Credential Transfer Assurance Guides, which guarantee that students will be awarded college credit for approved industry-recognized credentials.
Conclusion
Ohio has a vibrant and established CTE sector. Every high school student has access to CTE courses and programs, whether through their assigned CTPD or through College Credit Plus. These courses and programs offer students the opportunity to explore various career fields, participate in work-based learning, earn high school and college credit, obtain a high school diploma, and attain industry-recognized credentials that can lead to well-paying jobs or additional educational opportunities.
But there is still much work to be done to ensure that Ohio’s CTE sector is living up to its full potential. Far too many students and families are unaware of the plethora of opportunities that exist along with their short- and long-term benefits. And although a foundation for transparency and accountability is already in place, the state must do more to clearly and concisely track data on access and outcomes, and to ensure that courses, programs, credentials, and work-based learning opportunities are rigorous and meaningful.
Acknowledgments
I wish to thank my Fordham colleagues Michael J. Petrilli, Chester E. Finn, Jr., Chad L. Aldis, and Aaron Churchill, as well as Cassandra Palsgrove of Ohio Excels, for their thoughtful feedback during the drafting process. Jeff Murray assisted with report production and dissemination. Special thanks to Nathan Leibowitz who copy edited the manuscript and Andy Kittles who created the design.
- Jessica Poiner, Senior Education Policy Analyst, Thomas B. Fordham Institute
Endnotes
[1] This paper does not delve into federal standards, accountability, or Ohio’s Perkins plan.
[2] In addition, the state has two correctional institutions that offer CTE programming.