Mobile Navigation

  • National
    • Policy
      • High Expectations
      • Quality Choices
      • Personalized Pathways
    • Research
    • Commentary
      • Gadfly Newsletter
      • Flypaper Blog
    • Events
    • Scholars Program
  • Ohio
    • Policy
      • Priorities
      • Media & Testimony
    • Research
    • Commentary
      • Ohio Education Gadfly Biweekly
      • Ohio Gadfly Daily
  • Charter Authorizing
    • Application
    • Sponsored Schools
    • Resources
  • About
    • Mission
    • Board
    • Staff
    • Career
Home
Home
Advancing Educational Excellence

Main Navigation

  • National
  • Ohio
  • Charter Authorizing
  • About

Ohio Menu

  • Topics
    • Accountability & Testing
    • Advanced Education
    • Career & Technical Education
    • Charter Schools
    • Curriculum & Instruction
    • ESSA
    • Evidence-Based Learning
    • Governance
    • Personalized Learning
    • Private School Choice
    • School Finance
    • Standards
    • Teachers & School Leaders
  • Research
  • Policy
  • Commentary
    • Ohio Gadfly Newsletter
    • Ohio Gadfly Blog
    • Events

The Education Gadfly Weekly

Sign Up to Receive Fordham Updates

We'll send you quality research, commentary, analysis, and news on the education issues you care about.
Thank you for signing up!
Please check your email to confirm the subscription.

Ohio Gadfly Biweekly—Why are graduation rates soaring?

Volume 14, Number 20
10.5.2020
10.5.2020

Ohio Gadfly Biweekly—Why are graduation rates soaring?

Volume 14, Number 20
view
Rising grad rates blog
Standards & Accountability

Why are graduation rates soaring?

In the least-anticipated release on record, Ohio published its annual school report cards in mid-September. Due to the cancellation of last spring’s state tests, there’s not much there, though the state did release graduation rates and data about students’ readiness for college and career.

Aaron Churchill 10.5.2020
OhioOhio Gadfly Daily

Why are graduation rates soaring?

Aaron Churchill
10.5.2020
Ohio Gadfly Daily

To deal with coronavirus fallout, diagnostic and state assessments are vital

Jessica Poiner
10.5.2020
Ohio Gadfly Daily

Schools need talented teachers. Here’s how to find them in these challenging times.

Jessica Poiner
9.30.2020
Ohio Gadfly Daily

Forecasting the long-run costs of coronavirus

Jeff Murray
9.30.2020
Flypaper
view
We need state tests blog image

To deal with coronavirus fallout, diagnostic and state assessments are vital

Jessica Poiner 10.5.2020
Ohio Gadfly Daily
view
How to get teachers blog image

Schools need talented teachers. Here’s how to find them in these challenging times.

Jessica Poiner 9.30.2020
Ohio Gadfly Daily
view

Forecasting the long-run costs of coronavirus

Jeff Murray 9.30.2020
Flypaper
view
Rising grad rates blog

Why are graduation rates soaring?

Aaron Churchill
10.5.2020
Ohio Gadfly Daily

In the least-anticipated release on record, Ohio published its annual school report cards in mid-September. Due to the cancellation of last spring’s state tests, there’s not much there, though the state did release graduation rates and data about students’ readiness for college and career. Those data reflect the classes of 2018 and 2019, whose high school experiences were unaffected by the health crisis.

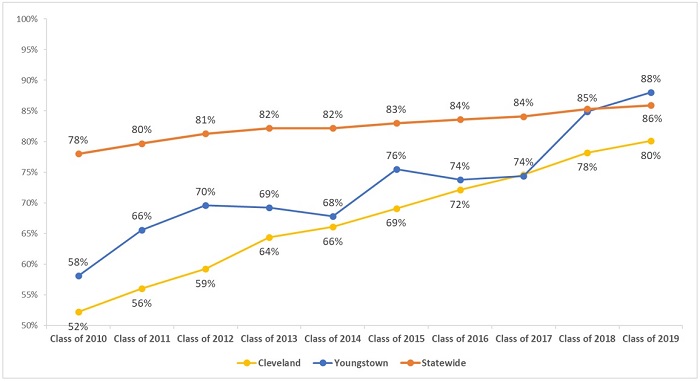
With less information available, the news coverage was fairly mundane. (Only “livened up” by another sad statement from the Ohio Education Association implying that poor students can’t learn.) But the sky-high graduation rates of a few districts did catch my eye. Youngstown media, for example, reported that its hometown district posted an impressive 88 percent graduation rate, up from the 85 percent rate of the prior year. Over in Cleveland, CEO Eric Gordon pointed to his district’s 80 percent graduation rate (compared to just 52 percent in 2011) as a sign of rapid improvement.

As figure 1 indicates, the four-year graduation rates in Cleveland and Youngstown—and statewide, too—have indeed been on a tear over the past decade. Given the years of work needed to make a dent in the achievement gap, it’s astonishing to see the disparities between these districts’ graduation rates and the statewide average disappear in the educational equivalent of overnight.

Figure 1. Four-year graduation rates, classes of 2010 to 2019, for Cleveland, Youngstown, and statewide
Rising grad rates chart 1​

Note: The graduation requirements for the classes of 2010–17 included passage of the Ohio Graduation Tests, the state’s former high school assessments. The requirements for the classes of 2018–19 included achieving one of the following: passing Ohio’s current end-of-course exams, earning remediation-free scores on college entrance exams, meeting career-technical requirements, or meeting alternative requirements based on attendance, volunteer/internships, GPAs, or several other options. Throughout the entire period, students have had to meet state course credit requirements.

But are these rising graduation rates signs of real progress—improvements related to increased achievement and readiness for college and career? Or is something else going on? Pinning down a clear answer isn’t easy with the data on hand, but let’s consider four possibilities.

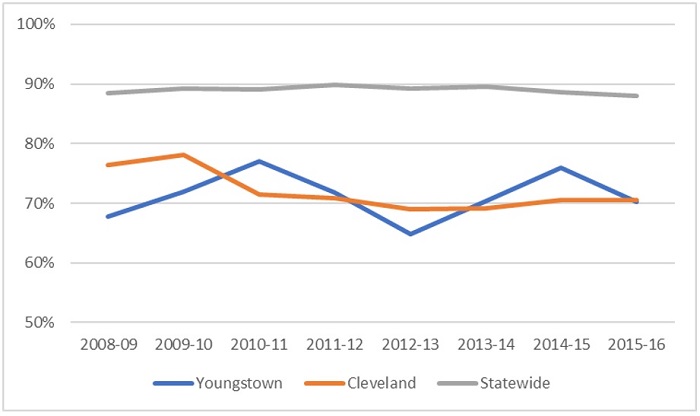
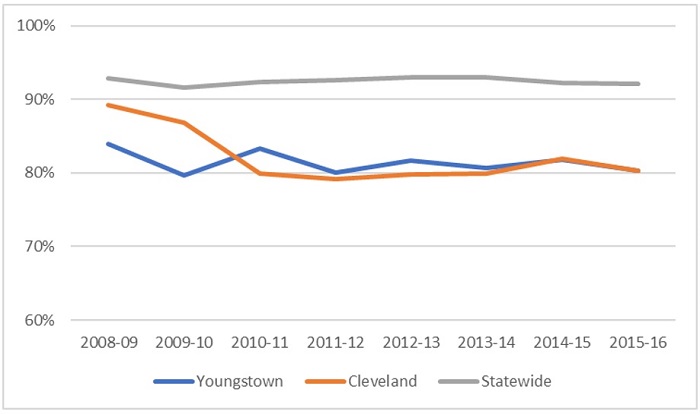
Possibility 1: It’s higher student achievement. The most straightforward—and hopeful—answer is that the rise in graduation rates reflects higher student proficiency in Cleveland and Youngstown. The results from the Ohio Graduation Tests (OGTs) cast some doubt on this theory. As figures 2 and 3 below indicate, proficiency on the math and reading sections of the OGT did not improve noticeably in either district. Though not displayed below, data from the 2014–15 and 2015–16 end-of-course exams (EOCs)—the years in which most students in the classes of 2018–19 would have been taking these exams—show that proficiency rates in Youngstown and Cleveland continued to fall below the state average.

Figure 2. Proficiency rate on the Ohio Graduation Test in math, 2009–16, for Cleveland, Youngstown, and statewide
Rising grad rates chart 2​

Figure 3. Proficiency rate on the Ohio Graduation Test in reading, 2009–16, for Cleveland, Youngstown, and statewide
Rising grad rates chart 3​

Note: This chart displays cumulative proficiency rates on the OGTs by the end of students’ junior year (students typically took the OGTs for the first time as sophomores). Hence, the 2008–09 proficiency rates generally reflect the results of the class of 2010, while the 2015–16 rates reflect the scores of the class of 2017.

Perhaps the flat high school proficiency rates reflect fewer dropouts. This would be a good thing for students, but it could put downward pressure on proficiency rates, as students who would otherwise dropout stay in school. It’s worth a look, then, at eighth grade proficiency rates: More prepared middle school students might translate into higher graduation rates.

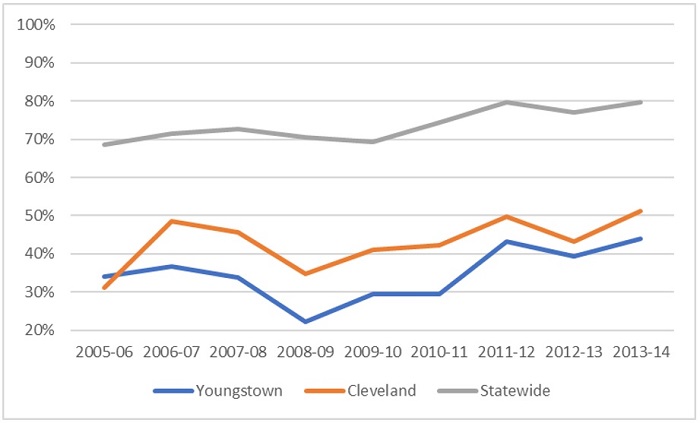
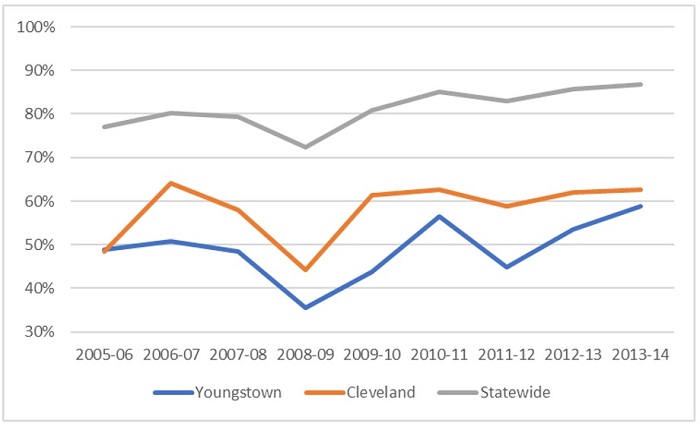
Here, we see some interesting patterns, as shown by figures 4 and 5. First, both districts generally experienced declines in proficiency between 2006–07 to 2008–09, but we see an increase in graduation rates for the corresponding graduating classes (2011 to 2013). Not what you’d expect. Second, after 2008–09, both districts mostly register increasing eighth grade proficiency rates (more so in math), an encouraging pattern that better fits the graduation trend. Third, neither district narrowed the achievement gap relative to the state average in nearly the same way as the graduation gap. By the end of the timeframe shown below (2013–14), eighth grade proficiency rates fell 24 to 36 percentage points below the state average, depending on district and subject, while graduation rates for the class of 2018 matched the state average in Youngstown and fell 7 percentage points below the state average in Cleveland.

Overall, taking the OGT and eighth grade data together, it’s hard to be certain that rising achievement is the predominant factor in the rapid increase in graduation rates.

Figure 4. Eighth grade proficiency rate in math on Ohio end-of-course exams, 2006–14, for Cleveland, Youngstown, and statewide
Rising grad rates chart 4​

Figure 5. Eighth grade proficiency rate in reading on Ohio end-of-course exams, 2006–14, for Cleveland, Youngstown, and statewide
Rising grad rates chart 5​

Note: Eighth graders in 2005–06 would have been in the class of 2010 and eighth graders in 2013–14 would have been in the class of 2018. Due to mobility, some eighth graders would not have been in the district’s actual graduating class.

Possibility 2: Students are receiving diplomas based on lower-level alternatives. The most recent jump in graduation rates—particularly noticeable in Youngstown—might reflect the weakened graduation requirements for the classes of 2018 and 2019. Recall that they were allowed to bypass standard requirements and receive diplomas based on less rigorous criteria, such as capstone projects, school attendance, and GPAs. Data from the class of 2018 indicates that the use of alternative routes was prevalent in both Youngstown and Cleveland: 48 and 32 percent of their respective classes received diplomas by virtue of the softer alternatives (detailed data for 2019 are not yet available). While alternatives likely explain much of the jump in graduation rates for the classes of 2018–19, they probably don’t explain the increases for the classes of 2010–17. During that time, the alternative route to graduation was fairly strict.

Possibility 3: Low-achieving students are exiting districts to attend dropout recovery or online charter schools. Another potential factor in the rising graduation rates in Youngstown and Cleveland might be an increasing number of students leaving the district to enroll in dropout-recovery or online schools. If this were happening, districts would see a boost in graduation rates, as they are no longer accountable for the on-time graduation of students who are likely to be credit deficient and academically behind. Both districts are home to a number of dropout-recovery schools and hundreds of students have opted to attend online schools. Both have also experienced larger enrollment declines in high school than other grades. These transfers may have contributed to the rising graduation rates, but it’s hard to gauge their effects without more detailed data.

Possibility 4: Questionable practices that push students to the finish line. The rise in graduation rates might be the result of sketchy credit recovery programs or exemptions for special-education students. The former practice refers to “makeup” courses that are typically offered to students who have previously failed a course. While not necessarily a bad thing, many have questioned the rigor of credit recovery courses. In a 2011 audit of Columbus City Schools, for example, one school employee told auditors that students were covering a year’s worth of material in just a couple days. Other stories from around the nation uncover similar concerns. Although there’s been no evidence of abuse, the civil rights data collection indicates that, as of 2015, roughly 10 to 15 percent of Youngstown and Cleveland high school students participate in credit recovery. As for students with disabilities, Ohio has permitted schools to waive test-score requirements for graduation, even though most special education students have mild disabilities that shouldn’t close the door on their ability to achieve proficiency. Statewide data from 2015–16 show that a sizeable number students with disabilities are indeed excused from meeting standard requirements. Unfortunately, the state doesn’t report data by district on how many special education students are excused.

***

Without more detailed data, we’re left mostly speculating about what rising graduation rates really mean. To help clear things up moving forward, the state should consider greater transparency about high school graduation. Here’s a four ways:

1. Report the percentage of a district’s students who graduate based on each “pathway.” Thankfully, Ohio removed the low-level alternatives given to the classes of 2018 and 2019. Instead, starting with the class of 2023, the state will offer four routes to graduation: 1) achieve competency scores on the algebra I and English II EOCs; 2) earn credit for one math and English dual-enrollment course; 3) meet career-technical requirements; or 4) meet military readiness requirements. Breaking down the data by pathway will allow for a clearer understanding of whether increasing graduation rates are closely tied to improved competency in math and English, or the use of other pathways.

2. Report a modified graduation rate that splits responsibility for transfer students’ graduation based on their time enrolled in each school. The current approach to calculating graduation rates holds a student’s “final” school accountable for graduation (or not). For most students who attend the same high school from freshman to senior year, this calculation works just fine. But this method is problematic when at-risk students transfer, particularly to dropout-recovery or online charter schools. It lets the previous “sending” district off the hook by effectively ignoring any faults that may have led the student to disenroll and seek another option in the first place. It also unfairly penalizes a “receiving” school for failing to remediate years of academic neglect in a short amount of time.

3. Report the percentage of a district’s special-education students who graduate based on an exemption from test-score requirements. Ohio should be more transparent about how special education students receive their diplomas.

4. Report the number of credit-recovery courses students take, and the percentage of required credits that are fulfilled via credit recovery. Including this information would allow policymakers and analysts to flag districts or high schools that rely heavily on credit recovery and look into possible abuses of these programs.

What’s clear right now is that graduation rates are setting records. Far murkier is what’s behind these soaring rates. With more sunlight, we’ll all have a better idea of whether they represent real progress for Ohio students—or are mere illusions.


view
We need state tests blog image

To deal with coronavirus fallout, diagnostic and state assessments are vital

Jessica Poiner
10.5.2020
Ohio Gadfly Daily

Over the last several weeks, Ohio lawmakers have been debating Senate Bill 358. The legislation would, among other things, eliminate state testing for the 2020–21 school year, provided the state receives a federal waiver.

Earlier this month, co-sponsor Senator Teresa Fedor told the Columbus Dispatch why she believes canceling state testing is the right move. “Any pressure we can relieve so that the focus is on teaching and learning, rather than testing and evaluating, will help our students succeed in the long-term.” She added, “We need to rely on tools that the schools use for diagnostic reasons and purposes so they know how to address (student) needs…we need to trust the teachers; we need to trust the educators and we need to give them as much flexibility as possible because we don’t know what conditions every school district is going to have.”

Senator Fedor is not the first to argue that local tests are better than those administered by the state. The idea behind this argument is that nobody knows students better than educators, so they are the best people to determine what students need. To do their jobs well, teachers need information as quickly as possible—and locally administered tests provide data much faster than state tests, which don’t deliver results for months.  

It’s a logical argument. But it doesn’t mean local tests are better. They are better at fulfilling the specific purpose they were designed for: immediate feedback about what students know so teachers can plan and teach accordingly. State tests, meanwhile, are better at fulfilling their specific purpose: providing big picture measurements of student achievement and growth that allow leaders and researchers to identify patterns and trendlines and make policy changes as a result. Both tests can tell teachers and parents how much individual students have learned. But the scale of the two types of tests are vastly different.

Think of it this way: When you aren’t feeling well, the doctor uses several tools to evaluate your symptoms and determine what’s ailing you and how to fix it. Thermometers and blood tests are critical tools, but they serve two different purposes and communicate two different sets of information. A doctor could treat you based on the feedback from only one tool. But providing the best care often means utilizing both, especially if he or she is planning to refer you to a specialist. State and local assessments are the same. They provide different types of information to different groups of people and, when used in tandem, provide a much fuller picture of academic health.  

It’s also important to remember that diagnostic assessments are just that—diagnostic. They diagnose where students are so that schools know where to start and what to do. State tests, on the other hand, are summative. They are designed to measure where students are at the end of a year and whether they learned the state standards for their grade level. Senator Fedor is right that diagnostics are critical. But they cannot and do not fulfill the goal of a summative test. To get a full picture of student learning, we need both.

The senator also makes a valid point when she argues that we don’t know the “conditions” every school is facing in terms of learning loss or student needs. But relying solely on local assessments causes more problems than solutions. We can’t know the true “condition” of Ohio’s schools if they’re all using different measurements and data points. And if we can’t compare schools, we can’t ensure equity. Experts have noted that low-income and minority students have been hit especially hard by school closures. To determine the extent of the damage in Ohio, we need to measure all of the state’s students against the same standards and compare those results to previous years. To track growth, we need to set an accurate baseline as soon as possible. And to ensure that students in underserved communities aren’t falling through the cracks, we need a single measurement that’s comparable and reliable across schools, subgroups, and geographic regions. The only way to accomplish all this is to administer state tests. Local assessments aren’t going to cut it.

Senator Fedor is correct that schools are under a considerable amount of pressure right now. But state assessments don’t need to be sacrificed to lessen that pressure. Lawmakers have it in their power to eliminate state-created, test-based consequences for the 2020–21 school year, just as they did last year. That approach would preserve the much-needed information gained through state assessments, while relieving much of the anxiety.  

view
How to get teachers blog image

Schools need talented teachers. Here’s how to find them in these challenging times.

Jessica Poiner
9.30.2020
Ohio Gadfly Daily

There are no silver bullets when it comes to closing achievement gaps. But there are inputs and interventions with solid evidence bases, and the impact of a good teacher is one of them. In fact, research suggests that when it comes to student achievement and growth, teachers matter most among school-related factors.

That’s not exactly groundbreaking news. Even without research to prove it, we’ve always known that teachers matter. But as schools struggle to deal with the learning loss caused by pandemic-related closures, good teachers have become even more important—especially in underserved communities.

Unfortunately, finding and hiring talented teachers is easier said than done. Part of the problem is that fewer young people seem to view education as an attractive career option. Back in 2018, ACT published a brief entitled “Encouraging More High School Students to Consider Teaching.” Using data collected by pre-test questionnaires given from 2007 to 2017, researchers examined the responses of students who were “very” or “fairly” sure about their college major. During that ten-year time span, high school students’ interest in teaching decreased significantly. Education was third among the top ten intended majors in 2008, but by 2012 it had dropped to eighth place, and it’s remained there since. In 2017, majors such as health sciences, business, engineering, and the social sciences were far more popular. 

To better understand how students’ perceptions of the profession might impact their interest, ACT surveyed a sample of students during the 2017–18 school year. They discovered that the primary reason students weren’t interested in teaching was financial. Among students who reported being uninterested, nearly two-thirds cited initial salary as one of their top three reasons. Salary concerns were also mentioned by students who were “potentially” interested, a term used to identify those who reported being “moderately” or “somewhat” intrigued by the classroom.

The ACT brief also points out that young people with higher test scores tend to express less interest in teaching. Students who were potentially interested in teaching averaged a composite score of 23 on the ACT—approximately 1.5 points higher than the composite score of students who were “definitely” interested in teaching. There was a similar gap in their attainment of ACT College Readiness Benchmarks, which are the minimum scores identified by ACT as those needed for students to have a “reasonable” chance of success in first-year, credit-bearing college courses. Across the board, uninterested and potentially interested students had higher rates of benchmark attainment than students who were definitely interested in teaching. For instance, in math, 56 percent of students who were not at all interested in teaching met the benchmark, compared to 52 percent who were potentially interested and just 42 percent who were definitely interested. There are similar gaps in English, reading, and science. The authors of the ACT brief are clear that they are not suggesting that all students planning to become teachers are academically unprepared. But the numbers do suggest that better prepared students are either uninterested or on the fence about teaching—and many of them seem to feel that way, at least in part, because of low salaries.

There is a sliver of good news. According to a recent study, economic downturns seem to make the teaching profession—regardless of its associated salary—more appealing to talented jobseekers. The study found that teachers who started their careers during a recession were more effective at raising student test scores. The recession impact appears over time and doesn’t reflect a difference in observed teacher characteristics or teaching assignments, which suggests that recessions temporarily change the new teacher pipeline. In short, talented students who previously would not have considered a career in the classroom are more likely to do so during a recession, likely because of the relative stability of teaching compared to the private sector. 

That’s encouraging, considering the nation is in the midst of a pretty serious economic downturn. But the expected migration of talented jobseekers is unlikely to be sufficient to mitigate the massive learning losses experienced over the last six months. To accomplish that feat, state and local leaders will need to make some significant changes to improve teacher recruitment efforts in ways that will attract prospective teachers who can have the biggest impact in the classroom.

Fortunately, the ACT brief offers a few solid ideas. The first and most obvious suggestion is to increase the starting salary for new teachers. Based on the ACT survey results, 72 percent of potentially interested students said that better pay would increase their interest in teaching. Furthermore, 39 percent of students who reported being uninterested in teaching said they would consider it if starting salaries were raised to the $50,000 to $59,000 range. Obviously, such a move would have several implications, not the least of which would be a question of what it does to current salary schedules. But if concerns over low starting salaries are keeping talented students out of the profession, then increasing them remains the clearest solution.

Another financially-related recommendation is to give college students more information about teachers’ total compensation. The ACT brief notes that the students they studied were “focused primarily on the starting salary of teachers and were not familiar with other financial benefits of teaching.” Emphasizing the total benefits package to prospective teachers, rather than just starting salary, could help nudge students toward teaching. NCTQ took a good first step in their recently published book Start Here to Become a Teacher, which included a user-friendly overview of how salary schedules work and how benefits for a typical public school teacher compare to those of a professional in the private sector. These types of details aren’t typically offered to college students, but they should be.

The final recommendation would be to create targeted career pathways and “grow-your-own” programs which give potentially interested students a closer look at the teaching profession. This matters because it wasn’t just compensation packages that students were unfamiliar with—many of them were also unfamiliar with key aspects of teaching in general. Providing more information and an opportunity to explore the profession firsthand could inspire more students to make the leap.

With the pandemic, schools already have plenty on their plates. Addressing teacher talent issues is probably not top of mind for leaders. But it should be. School closures—this spring and this fall—have widened achievement gaps, and learning losses are hitting underserved communities particularly hard. To mitigate them, we need to invest in talented teachers.

view

Forecasting the long-run costs of coronavirus

Jeff Murray
9.30.2020
Flypaper

Modeling the effects of a global pandemic while it’s ongoing seems like a prime example of “inexact science.” It’s also sure to depress. But it’s happening. A group of German and American economists recently added to the bleak parade with a working paper that looks at the consequences of Covid-19-mitigation school closures on current students’ human capital over time.

The analysts built a “heterogeneous agent partial equilibrium” model with a human capital production function at its core. The model’s inputs are time and monetary investments into education made by parents via several avenues (everything from academic enrichment to home purchases to college savings accounts) and by governments through the provision of schooling. They estimate that current closures are equivalent to six fewer months of schooling. Parents respond by adjusting their own investments in their children, thereby potentially mitigating the effects of school closures. In the model, parental time inputs rise by 4.3 percent and monetary inputs by 5 percent, but the global recession is also at work on parental resources.

The model’s outputs are children’s human capital as they progress through high school and college choice, subsequent earnings, and, ultimately, welfare as adults. In short: their futures.

Other recent research predicted that so-called “school shock” will reduce average lifetime earnings at the individual level by almost $10,000. This new prediction is in the same range. On average (across children aged four to fourteen when the shock occurs), the new model implies a 3.8 percent reduction in high school graduations and a 2.7 percent reduction in college degrees. Eighty-seven percent of those losses are directly attributed to the school closures, the rest to parents’ reduced capacity to mitigate the school shock.

Negative effects will be felt most keenly by the youngest children (ages six to ten at the time of the school shock). Older children have already accumulated more of their human capital and thus, the shock is less severe. Low-income families suffer more, both because a greater percentage of their educational inputs come from the government and because their parents have more constraints on how much time and money they can realistically muster to cover the loss.

All of this may sound abstract, but similar alarm bells are ringing among professionals in education, the private sector, psychology, and others in the research community. It is still early, however, and the direst predictions here are based on a total loss of six months’ worth of education. Yet the 2020–21 school year has dawned with many schools, districts, and families looking to kickstart learning and change the equation for their kids. For them, the “Covid slide” may prove remediable. Those who do not break free of their own form of “school shock” to focus on student achievement and growth will see their students end up being weighed down by grim inevitability of the math.

SOURCE: Nicola Fuchs-Schündeln, Dirk Krueger, Alexander Ludwig, and Irina Popova, “The Long-Term Distributional and Welfare Effects of Covid-19 School Closures,” NBER Working Papers (September 2020).

Fordham Logo

© 2026 The Thomas B. Fordham Institute
Privacy Policy
Usage Agreement

National

P.O. Box 110
Burke, VA 22009

202.223.5452

[email protected]

Ohio

P.O. Box 82291
Columbus, OH 43202

614.223.1580

[email protected]

Sponsorship

130 West Second Street, Suite 410
Dayton, Ohio 45402

937.227.3368

[email protected]