
Standards & Accountability
State Board of Education is on the right track with report card implementation
Last June, Governor DeWine and the General Assembly enacted important reforms to Ohio’s school report cards in House Bill 82 (HB 82).
Last June, Governor DeWine and the General Assembly enacted important reforms to Ohio’s school report cards in House Bill 82 (HB 82).

Last June, Governor DeWine and the General Assembly enacted important reforms to Ohio’s school report cards in House Bill 82 (HB 82). The revamped framework makes a number of improvements such as reducing the number of ratings in the overall system and streamlining unnecessarily complex components. To their credit, lawmakers made these changes while maintaining the state’s longstanding focus on student academic outcomes and its commitment to transparency for such results.
While the legislature did much of the heavy lifting, it also tasked the State Board of Education to iron out some of the finer details. Most notably, the board must set the “grading scales”—i.e., the performance standards that districts and schools must achieve in order to receive certain ratings. With the new report card rolling out this fall, a State Board committee recently dug into options for setting those standards.
Much like Goldilocks and the “just right” bowl of porridge, policymakers need to implement grading standards that don’t set the bars absurdly high or abysmally low. Fortunately, key members of the board—across the political spectrum—recognized the importance of such a balance by articulating principles that recognize our high aspirations for Ohio schools and students, while also seeking fair and achievable targets.
Now that the board committee’s proposal is out for public review, how did it do? In short, its plan for school grading is on the right track. Let’s take a closer look at its proposals for the five report card components.[1]
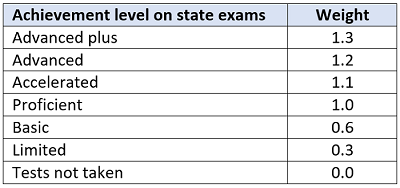 The board committee discussed the possibility of altering these weights, but it commendably resisted the urge to fiddle. Importantly, the “asymmetric” weighting ensures that the extra credit for high achievers doesn’t mask the struggles of other learners in a school. Moreover, maintaining the index’s design is essential to tracking achievement trends over time. In terms of the grading scale, the board committee proposed to keep the one used in the old system, a decision that upholds the state’s historically rigorous standards for its achievement component.
* * *
To their credit, Ohio lawmakers rolled up their sleeves and made careful revisions to the state’s school report card framework. The full State Board of Education—if it follows the direction being charted by its Performance and Impact Committee—is now poised to follow in the legislature’s footsteps by thoughtfully implementing the technical details. In the end, the school report card is as much art as science, and with any luck, Ohio will soon have a clear, fair, and honest portrait of educational performance across the state.
[1] These five components will appear with ratings in fall 2022. An overall rating that combines the five components will appear in fall 2023, and a sixth component based on college, career, and military readiness data may be added in fall 2025. The board committee, due to the significant revisions in the components’ design and some limitations in the current data, has proposed to reevaluate the grading scales within the next two years to ensure their continuing rigor and fairness.
[2] For instance, a school with a 95 percent promotion rate, an 80 percent proficiency rate, and 70 percent of its off-track readers moving to on track would have a weighted early literacy average of 83 percent. According to statute, the off-/on-track rate receives 25 percent of the component weight; promotion, 35 percent; and proficiency 40 percent.
[3] For instance, a school with an 85 percent four-year and 90 percent five-year rate would have a weighted graduation rate of 87 percent. According to statute, the four-year rate receives 60 percent of the weight and the five-year rate, 40 percent.

After a two-year break—one when state assessments were cancelled entirely, and a second when testing was reinstated but accountability was paused—Ohio’s education system will soon return to business as usual regarding federally-required school accountability and identification policies.
In December, the U.S. Department of Education released draft guidance that outlines what’s expected of states as they restart their accountability systems for the 2021–22 school year. There are some clear non-negotiables. For example, states are required to administer annual assessments, and the 95 percent participation requirement will be in effect. But the department also permits states to make certain adjustments to the ESSA plans required under federal law. For changes that impact only the 2021–22 school year, states must submit a plan addendum. But if they wish to make broader changes that will last beyond next year or will go into effect starting in 2022, they must submit a plan amendment. States can submit both an addendum and an amendment if they’re making short- and long-term modifications.
Recent legislative changes to Ohio’s report card system make an amendment necessary. But the state will also need to use the addendum process to seek short-term adjustments for Covid-related issues. Here’s an overview of the four major areas that will require adjustments.
Long-term goals and measurements
ESSA requires states to set long-term goals and interim progress targets for each subgroup of students in three areas: academic achievement, graduation rate, and English language proficiency. Ohio’s initial ESSA plan used 2016 data as a baseline and set improvement goals for ten years in the future. For example, the 2015–16 baseline for all students in math proficiency was 58 percent, while the long-term goal for the 2025–26 school year was 80 percent. When Ohio applied for and was granted a Covid-19 waiver during the 2020–21 school year, the timeline for measuring interim progress was shifted forward one year, effectively skipping the missing year of data.
Thanks to the recent draft guidance, state leaders now have two new options to consider. Under the addendum option, Ohio could shift its timeline forward again for up to two years. The amendment option offers a different approach, as it allows Ohio to revise its long-term goals and interim measurements based on test scores from the 2021–22 school year. Current goals and measurements would remain in place until Ohio proposes revisions, and an amendment that identifies the new baseline as well as updated goals would need to be submitted once updated testing data are available.
Ohio leaders could make a solid case for choosing either option. But if the purpose of long-term goals and measurements is to transparently track progress, then it’s important to have an accurate baseline. The baseline and targets in the current plan were set prior to a generation-defining pandemic that left an indelible impact on millions of students. Pretending that these impacts don’t exist and maintaining pre-Covid expectations isn’t the best path forward. Instead, Ohio should set a new baseline that acknowledges where kids are now and sets us up to transparently and accurately track progress over the coming years.
Accountability indicators
Federal law requires each state’s accountability system to include at least five indicators: a measure of student achievement; a second achievement measure for elementary and middle schools; graduation rates for high schools; progress for English language learners; and at least one measure of school quality and student success. It was left up to states to choose specific measurements.
Ohio recently made several changes to the six components included in its original ESSA state plan, including renaming two, and these changes are significant enough to warrant an amendment. But the state will also need to submit an addendum for some short-term changes. For example, the draft guidance permits Ohio to temporarily modify its methodology for calculating various indicators. Such modifications will be necessary for measures like progress, which relies on multiple years of data and is therefore affected by the absence of test results from the 2019–20 school year. (Ohio already made such modifications for the 2020–21 school year thanks to its Covid-19 waiver.)
Identification of schools
ESSA requires states to identify at least two categories of schools: comprehensive support, for the lowest-performing schools in the state, and targeted support, for schools struggling with certain subgroups of students. In its ESSA plan, Ohio opted to carry over the three categories it used as part of its federal waiver under NCLB/ESEA. As a result, schools identified as needing comprehensive support are called priority schools, and those identified as needing targeted support are called focus schools. Schools in the third, Ohio-specific category are known as watch schools.
Identification began during the 2017–18 school year, with updates slated for 2020–21. But under the Covid-19 waiver granted to Ohio by the U.S. Department of Education last year, all identified schools were frozen in their status. Ohio promised to restart identifications in the fall of 2022 using data from the 2021–22 school year. The draft federal guidance doesn’t alter that expectation, but it does offer an opportunity to temporarily modify the methodology for identifying schools or to permanently modify how schools are differentiated. Given that Ohio currently lacks an education leader—the search for a state superintendent is still ongoing—it’s wise to avoid committing to permanent changes. Instead, Ohio should focus on only making modifications that are required due to the pandemic.
Exit criteria for school identification
ESSA requires states to establish statewide exit criteria for identified schools. Ohio’s ESSA plan bases this on report card indicators, including the Gap Closing measure, which contains achievement, progress, and graduation rate data for all subgroups. Priority schools are measured against their own achievement level from when they were first identified, whereas focus schools must improve based on fixed state requirements.
Recent legislative changes to the state report card system have made certain aspects of Ohio’s approved exit criteria inapplicable. For example, to exit improvement status, focus schools must earn an overall grade of C or better. But under the new report cards, Ohio will use a star rating system rather than letter grades. This is a relatively simple adjustment to the state plan, but it will require an amendment.
***
Federal school accountability and identification provisions are complex on a good day. Add in missing test data from 2019–20, learning loss, and state legislative changes, and things are even more complicated. One thing is certain, though: Federal requirements for annual testing and school identification are back and here to stay. That makes Ohio’s next steps fairly clear. Submit an amendment to account for report card changes, and use the addendum process to make temporary, Covid-related adjustments.

Over the past two decades, student enrollment has gradually declined across Ohio, reflecting demographic changes and out-migration that have reduced the overall childhood population in the state. But with the pandemic wreaking havoc on education, public school enrollment fell more sharply between the 2019–20 and 2020–21 school years. Taken together, Ohio district and charter schools’ K–12 enrollments declined by about 30,000 students last year. That represented a 2 percent loss, slightly less than the national decline of 3 percent in public school enrollment. Analysts have pointed to a number of explanations for the dip, including more parents choosing to “redshirt” their kindergarteners, increases in homeschooling and private school enrollments, and perhaps higher numbers of dropouts.
This year has been marred by fewer disruptions, but does that mean enrollments are bouncing back? A first look at the 2021–22 data indicates that they remain depressed. Figure 1 displays the statewide numbers—traditional districts and public charters schools combined—showing that enrollments are flat compared to last year.
Figure 1: Public school enrollment, Ohio school districts and charters, FY 2017 to 2022
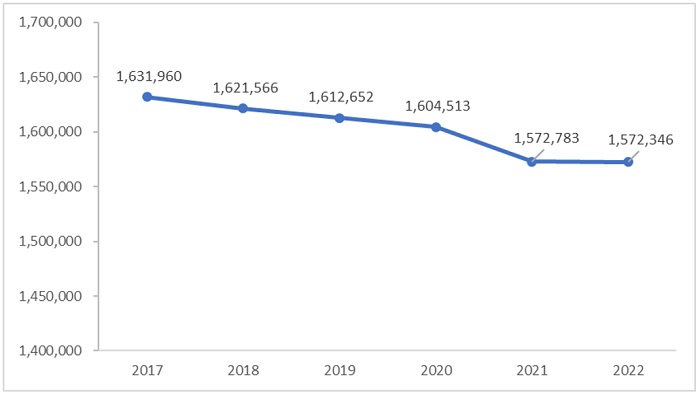
Source: Ohio Department of Education (ODE). Traditional district enrollments for FYs 2017–21 were calculated based ODE’s FY 21 Final #2 Payment file and the FY 22 district enrollment was pulled from the February 4, 2022 payment information in its Foundation Payment Reports. Charter school enrollments for FYs 2017–21 were calculated based on ODE’s Community School Annual Report (Table 2) and the FY 22 charter school enrollments were calculated based on its FY 22 December Payment file.
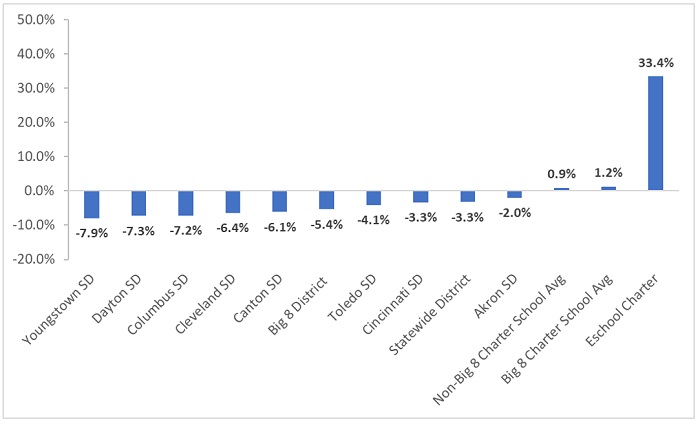
Analyses of last year’s data found that Ohio’s major urban districts suffered the greatest enrollment losses. That pattern has continued into this year. Figure 2 shows that Dayton and Cincinnati’s FY 22 headcounts are more than 2 percent below last year. On average, Big Eight district enrollment declined 1.1 percent year over year, even as district enrollment statewide inched upward by 0.1 percent.
Figure 2 also reveals a couple interesting patterns in charter school enrollments. First, continuing a pattern seen last year, headcounts across Ohio’s urban brick-and-mortar charters once again remain more stable than their urban district counterparts. This year, charters located in the Big Eight cities report enrollments that are just 0.2 percent lower versus the 1.1 percent slide for urban districts. Second, we notice that e-school charter enrollments fell rather substantially, declining by 6.5 percent compared to last year. This suggests that some of last year’s spike in e-school enrollment was transitory, i.e., parents using e-schools as a temporary alternative to brick-and-mortar options during the earlier days of the pandemic.
Figure 2: One-year percentage change in public school enrollment, FY 2021 to 2022
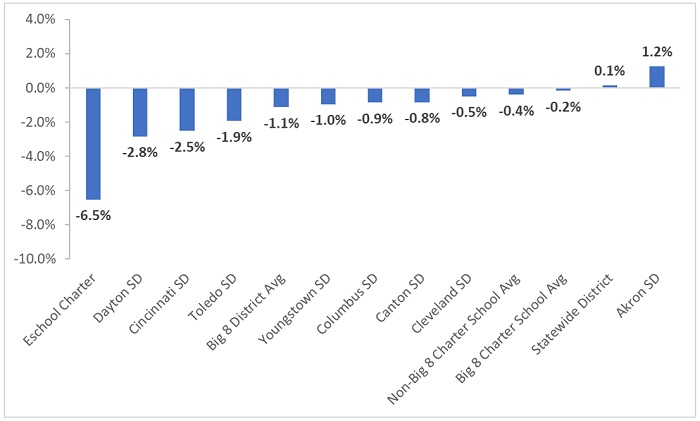
Figure 3 looks at changes in enrollment from the pre-pandemic year of 2018–19 to the current school year. Here, the enrollment declines in the Big Eight districts are more marked, particularly in districts like Youngstown, Dayton, and Columbus. In contrast, we see brick-and-mortar charter enrollments slightly increasing, despite the disruptions of the pandemic, rising by 1.2 percent over this period. Even with this year’s enrollment loss, as was shown in Figure 2, e-school enrollment rose significantly during these years.
Figure 3: Three-year percentage change in public school enrollment, FY 2019 to 2022
* * *
We don’t know all the reasons behind these trends, nor can we predict with certainty whether lower enrollment levels will be a permanent “new normal.” That being said, these patterns do have policy implications, two of which deserve brief mention.
The pandemic has altered life in many ways, some fleeting but others more permanent. In K–12 education, it’s led to some notable shifts in where students attend school. Moving ahead, policymakers need to work to ensure that Ohio’s education policies line up with this new reality.

Since the 1980s, parents in London, England, have been guaranteed the right to choose a state-funded school for their children, with capacity being the only barrier. Since 1996, school performance tables have been made publicly available to aid them in sorting through what can be a wide array of options. While the ideal randomized school choice experiment is not possible in this environment, a recent working paper from Queen Mary University Ph.D. candidate Marco Ovidi approximates random variation in school selection by utilizing the tie-breaking mechanism of the centralized assignment process. Turns out that parents seem to know best for their children, even when their choices go against the publicly available school information.
For primary school in England (ages five to eleven), parents are required to rank up to six schools at the time of application, in order of preference. Those preferences are informed by publicly available information including standardized test scores, value-added measures, and the student composition of the schools. Local authorities (LA) overseeing schools are required to provide a seat to local applicants—those living in closest proximity—and to assign all applicants to the highest preference school available. Institutions with excellent test scores are typically sought after and usually become oversubscribed before seats are assigned. In these cases, distance to the school is used as a tiebreaker between applicants with equal priority, generating catchment areas that vary year by year. This divide allows Ovidi to identify applicants living at a similar distance from a given school—thus, having the same chance of admission—and compare those who got a seat in their most-preferred school and those who did not.
Ovidi’s data include administrative and demographic information on 199,220 applicants to London primary schools and the value-added scores of those schools in 2014 and 2015. The average parent ranked three or four options upon application. London students are more likely to have a disadvantaged background, with a higher proportion of students eligible for free lunch or with special education needs as compared to students in the rest of the UK. London schools, however, typically outperform the national average in terms of test scores. As befits the density of a major European capital city, catchment areas around London primaries average just 600 meters (just over one-third of a mile) and can be as close as 300 meters (less than one-fourth of a mile). One caveat Ovidi notes is that schools are allowed certain admission priorities—such as siblings of currently-enrolled students—that override the centralized assignment system, although he does his best to identify and correct for these relatively-few outliers.
Not surprisingly, parents overall show strong preference for primary schools with higher test scores and for institutions located closer to their homes, regardless of socioeconomic status, although parents in higher-income areas of London have access to more high-performing schools nearer to them. However, any given school can be ranked very differently by different parents without observable characteristics to explain the variation. Ovidi suggests parents are making personal, child-specific judgments about schools with information gathered from sources as yet unknown. Even more interesting, it seems these gut decisions ultimately create better school matches. While higher-performing schools will, in general, produce higher student achievement than will lower-performing schools, Ovidi finds that students who land in their parents’ first-choice school perform even better than expected based on test scores and value-added data. Enrollment in a preferred school increases achievement in mathematics by 0.09 standard deviations above what would be expected based on school quality compared to a similarly effective institution with lower parental preference. To state it another way, a student will actually do worse academically if the tie-breaking algorithm sends him to a less-preferred school, even if it is statistically identical to the school that his parent ranked first.
A specific example of positive parental preference effects explored in the paper also shows the complex interactions at play. Ovidi looked at male students who entered primary school with relatively low achievement levels. Parents of these students, unusually, tended to prefer schools with lower overall performance ratings than other options near them. Those boys did better in their parents’ preferred institution than did their peers in higher-performing schools. And since the match effects observed in his sample are largest in schools in the bottom quartile of the peer quality distribution, he also suspects that such seemingly paradoxical preferences are driving the positive outcomes. Ovidi hypothesizes that these parents preferred to place their lower ability students with peers at or near the same level rather than with children who are more advanced. While he cites other research showing that males react “less productively” than females to new environments with higher-ability peers, the data do not go far enough to prove this conclusively.
The bottom line appears to be that parental choices, while informed by school quality and proximity, are child-specific and based on other factors beyond the obvious. But that is not to say that they are arbitrary or focused on non-academic considerations. Quite the contrary, it seems. Parents can not only spot a good school generally, but can also home in on the school that is the best fit for their child. We must respect these abilities when designing school choice programs. As EdChoice’s Mike McShane puts it in his brief analysis of Ovidi’s work, “By understanding the skills that parents have in navigating their choices and the differential quality within the options...we can better understand how to improve them. That improvement falls to policymakers, so understanding the factors that lead to the adoption and expansion of programs is all the more important.”
SOURCE: Marco Ovidi, “Parents know better: Primary school choice and student achievement in London,” Working Paper No. 919, Queen Mary University of London, School of Economics and Finance, London (December 2021).

Just like the term “virtual schooling,” the moniker “hybrid learning”—which came to the fore at the start of Covid disruptions—does not denote one educational model. At its most basic, a hybrid system means that sets of students in any given school or classroom are experiencing their education in different ways. Variations beyond these basics, however, are numerous. A new brief analyzing teacher survey results digs into the variations from the educator’s perspective.
Researcher Lora Bartlett of the University of California, Santa Cruz surveyed seventy-five teachers from nine states in November 2020 and conducted two semi-structured interviews with thirty-six of them in mid- and late-2020. The full set of respondents represents a close match to the demographics of the U.S. teacher labor force as reported by the National Center for Education Statistics’ Schools and Staffing Survey for the 2017–18 school year, but we do not know the demographic breakdown of the thirty-six teachers interviewed.
Twenty-two teachers reported teaching in one of the following hybrid learning modes in the first stages of the pandemic:
A parallel hybrid, in which students participate either fully remotely or fully in person. The teachers interviewed indicated their schools sorted students via parental opt-in, although quarantine requirements would also certainly have involuntarily affected the population of each group. The six teacher respondents in this category indicated they taught in one mode or the other consistently.
An alternating hybrid, in which students are split into two groups (A and B) and participate in a portion of the school week in person and a portion remotely so that buildings and classrooms are at approximately half capacity at any given time. This model has variations, with some schools splitting the day between groups A and B, some schools splitting the week, and still others alternating groups weekly. The four teacher respondents in this category indicated teaching both in-person and remote students, but not at the same time.
A blended hybrid model, in which students are participating in any given class simultaneously both in person and remotely. The seven teacher respondents in this category were required to teach both groups synchronously (what some have referred to as Zoomers and Roomers).
Five additional teacher respondents reported some fluctuation of models during their pandemic teaching.
The point of this survey and the resulting report was to document teachers’ working conditions during the early pandemic and to open the black box of the classroom in all of its revised forms. While respondents shared that in-person teaching was, in general, more difficult than in pre-Covid times due to masking, Plexiglas barriers, distancing, and more, they also expressed a preference for sticking as close as possible to what they knew. The subset of teachers who discussed hybrid learning in detail were less vexed when teaching in only one mode at a time, although any amount of remote teaching, they reported, resulted in technological headaches, absent or unengaged students, and an increased workload. Special ire resulted from having to teach in-person and online students simultaneously. Class time devolved into “chaos” for various reasons, with either in-person students or virtual students or both getting the short end of the stick—as the teachers described it.
The onset of the pandemic unleashed a hodgepodge of rapid and unplanned changes in work environments. Teachers, like many others, were forced to adapt. The sample here is small, and all those surveyed worked in traditional districts where change is almost always a dirty word, but their reported experiences are likely similar to others’ across the country. Bartlett is part of the Suddenly Distant research group, from which more reports on teachers’ working conditions during Covid should be forthcoming. Hopefully some brighter news will result from additional research into the later stages of pandemic-era teaching.
SOURCE: Lora Bartlett, “Specifying Hybrid Models of Teachers’ Work During COVID-19,” Educational Researcher (January 2022).