A slew of news stories from around the nation have reported declining K–12 public school enrollments amid the pandemic. Given the disruptions and uncertainties, this slippage isn’t surprising. More parents may be choosing homeschooling, private, or full-time online schools over their assigned district option. Various reports cite lower kindergarten enrollments, as parents “redshirt” their children this year. The slide might also reflect more students disengaging from their education and dropping out.
Have enrollment patterns in Ohio followed the national trajectory? While a few stories have appeared in Ohio media on kindergarten, e-school, and local patterns, no one has yet to offer a more complete picture of enrollment for the 2020–21 school year. To fill the void, this piece takes a look at the year-to-year enrollment changes across Ohio’s 600-plus school districts and roughly 300 public charter schools. The analysis that follows examines four key questions about enrollment this year and concludes with some thoughts on policy implications.
Question 1: Have traditional school district enrollments fallen this year?
Based on headcounts reported via the Ohio Department of Education’s (ODE) school finance datasets, district enrollment is down by 2.8 percent this year versus the year prior. In December 2020, the state reported 1,501,647 students in traditional districts; one year later, that number has fallen to 1,459,901 students—a decrease of 41,746. District enrollments had been on the decline before Covid-19—falling by an average of 0.4 percent per year from 2016–17 to 2018–19. But the 2.8 percent loss is higher than usual, suggesting the dip is mostly linked to pandemic-related issues, some of which we’ll discuss below.
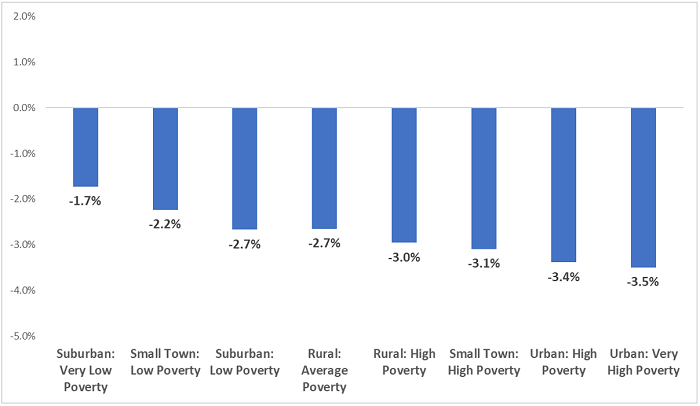
Figure 1 displays the enrollment data by district typology, a method of grouping districts with similar geographic and socioeconomic characteristics. The higher poverty typologies—whether rural, small town, or urban—experienced declines of more than 3 percent, while the lower-poverty typologies registered smaller losses. We don’t know for sure why poverty would matter, but potential explanations include fewer school reopenings in high-poverty areas (especially big cities), lower rates of kindergarten enrollment, or more students that have gone missing.
Figure 1: Change in enrollment by district typology, December 2019 versus December 2020

Source: Ohio Department of Education, District Payment Reports (FY 2021, December #2 Payment File) and District Typology.
The enrollment changes vary widely across Ohio districts. Eighty-two systems, in fact, reported increased enrollments this year—the biggest gainer being College Corner, an unusual jurisdiction that spans Indiana and Ohio (up 18 percent). The steepest decline was observed in Oberlin (down 15 percent). To view data from all Ohio districts, click on the map here or displayed at the bottom of the webpage.
Question 2: Are enrollment declines associated with reopening decisions?
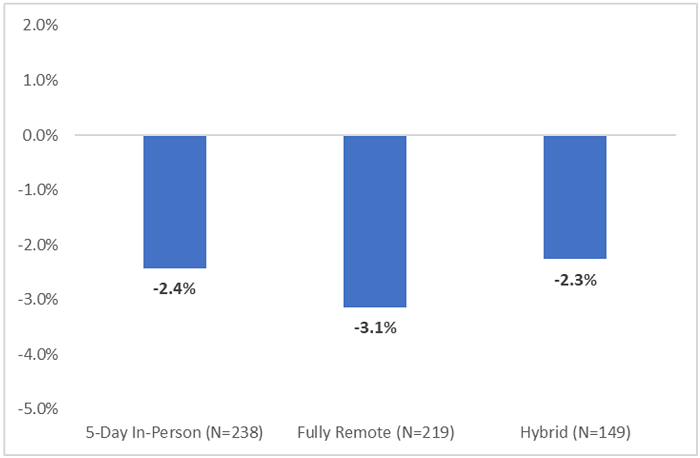
The chart below indicates that remote-only districts have experienced somewhat larger dips compared to those that offered an in-person option. The average year-to-year loss among fully-remote districts was 3.1 percent versus 2.4 and 2.3 percent for in-person and hybrid districts, respectively. The larger declines might be due to more parents seeking other alternatives when their district announced a remote-only policy, or perhaps higher rates of redshirting or dropout when online learning is the only educational option.
Figure 2: Change in district enrollment by instructional model, December 2019 versus December 2020

Source: ODE, Educational Delivery Model for 2020-21 (week of January 4, 2021). ODE regularly updates reopening information; thus, data from the start of the 2020–21 school year are not presently available.
Question 3: Are lower kindergarten enrollments contributing to losses?
Lower kindergarten headcounts are almost surely factoring into the declines, but it’s hard to determine the extent to which they’re contributing. There is no straightforward way of calculating statewide enrollments by grade level via the school finance datasets. However, a look at a few district’s funding data does show a dip in kindergarten enrollment. Table 1 shows the pattern using several Franklin County districts of various demographics selected for illustration. Four of the five districts experienced rather large decreases in kindergarten enrollment, with just one district (Dublin) posting a slight uptick.
Table 1: Kindergarten enrollment in selected Ohio districts, December 2019 versus December 2020

Question 4: Are public charter school enrollments also falling?
As table 2 reveals, charter enrollments—e-school and brick-and-mortar combined—rose by 10 percent relative to 2019–20 headcounts. The growth is almost entirely due to online charters whose enrollments are up by more than 10,000 students this year, surely reflecting a growing interest in online options among Ohio parents. Interestingly, brick-and-mortar charters—most of which are high-poverty, urban schools—are faring better than their district counterparts in terms of maintaining enrollments. It’s not clear why that is, but perhaps they are better satisfying parents and engaging students amid the pandemic.
Table 2: Public charter school enrollment, December 2019 versus December 2020

Source: ODE, Community School Payment Reports (FY 2020 and 2021 December Payment File)
***
Will these K–12 enrollment trends persist or are they fleeting? Like all things pandemic related, no one knows what’ll happen next. Despite the uncertainties, policymakers should consider two implications of these data:
Return to state funding policies that base allocations on current-year enrollments. In July 2019, long before Covid-19 had emerged, legislators suspended the formula used to allocate state funds to traditional districts, choosing instead to fund districts based on FY 2019 headcounts. (Legislators were debating the formula at the time but couldn’t agree on a new one.) Though obviously not related to the crisis that followed, this policy has to some extent shielded districts from funding reductions associated with pandemic-driven enrollment declines. However, given the possibility of further enrollment shifts moving forward, it’s especially important for the state to return to a policy of funding districts based on current-year enrollments, as it had done before the freeze.
Such a “funds follow students” model is fair to children, helping to ensure that they receive appropriate resources for their education. It’s also fair to the schools that bear the responsibility of serving them and it represents good stewardship of state dollars, refusing to fund “phantom students” who are no longer enrolled in a particular district or school. Last, in the context of school reopenings, funding based on current enrollments could discourage the continuing use of remote learning—a model that parents are less satisfied with and isn’t ideal for most students—in the fall of 2021, as it would put districts’ funds at risk if students opt for in-person alternatives.
Get ready for larger kindergarten classes next year. With lower numbers this year, state and local leaders should begin preparing for larger kindergarten class sizes in 2021–22. At a state level, policymakers may need to consider regulatory flexibilities that allow schools to address larger-than-usual kindergarten cohorts. At a local level, it might mean strategically reconfiguring space, redeploying staff, increasing learning time, or even adding a grade level to address student needs in the coming years.
These enrollment data only offer a glimpse of K–12 education during the pandemic. They don’t tell us about whether enrolled students are participating in learning opportunities (“in attendance”), mastering academic content, or feeling physically and emotionally well. What they do indicate is that things have changed, at least temporarily—and perhaps more permanently into the future.


