Mobile Navigation

  • National
    • Policy
      • High Expectations
      • Quality Choices
      • Personalized Pathways
    • Research
    • Commentary
      • Gadfly Newsletter
      • Flypaper Blog
    • Events
    • Scholars Program
  • Ohio
    • Policy
      • Priorities
      • Media & Testimony
    • Research
    • Commentary
      • Ohio Education Gadfly Biweekly
      • Ohio Gadfly Daily
  • Charter Authorizing
    • Application
    • Sponsored Schools
    • Resources
  • About
    • Mission
    • Board
    • Staff
    • Career
Home
Home
Advancing Educational Excellence

Main Navigation

  • National
  • Ohio
  • Charter Authorizing
  • About

National Menu

  • Topics
    • Accountability & Testing
    • Advanced Education
    • Career & Technical Education
    • Charter Schools
    • Curriculum & Instruction
    • ESSA
    • Evidence-Based Learning
    • Facilities
    • Governance
    • Personalized Learning
    • Private School Choice
    • School Finance
    • Standards
    • Teachers & School Leaders
    • Think Again
  • Research
  • Commentary
    • Gadfly Newsletter
    • Flypaper Blog
    • Gadfly Podcast
  • Events
  • Scholars Program

The Education Gadfly Weekly

Sign Up to Receive Fordham Updates

We'll send you quality research, commentary, analysis, and news on the education issues you care about.
Thank you for signing up!
Please check your email to confirm the subscription.

The Education Gadfly Weekly: What's at stake for schools in next week's elections?

Volume 18, Number 43
10.31.2018
10.31.2018

The Education Gadfly Weekly: What's at stake for schools in next week's elections?

Volume 18, Number 43
view

What's at stake for schools in next week's elections

There’s been a lot of talk about “blue waves” and “red walls,” but what will November 6 mean for federal and state education policies? Days away from the crescendo, the answer may depend in part on where you get your news.

Dale Chu 10.31.2018
NationalFlypaper

What's at stake for schools in next week's elections

Dale Chu
10.31.2018
Flypaper

School choice is not at odds with community-building

Brandon L. Wright
10.31.2018
Flypaper

We measure what matters, which is why subgroups in ESSA accountability systems are important

10.31.2018
Flypaper

The next British Invasion: ResearchEd comes to the U.S.

Robert Pondiscio
10.31.2018
Flypaper

Changes in teacher practices throughout the Common Core era

Sophie Sussman
10.31.2018
Flypaper

The Education Gadfly Show: An #Eduween riddle: How is pre-school research like a skunk?

10.31.2018
Podcast
view

School choice is not at odds with community-building

Brandon L. Wright 10.31.2018
Flypaper
view

We measure what matters, which is why subgroups in ESSA accountability systems are important

Anne Hyslop 10.31.2018
Flypaper
view

The next British Invasion: ResearchEd comes to the U.S.

Robert Pondiscio 10.31.2018
Flypaper
view

Changes in teacher practices throughout the Common Core era

Sophie Sussman 10.31.2018
Flypaper
view

The Education Gadfly Show: An #Eduween riddle: How is pre-school research like a skunk?

Michael J. Petrilli, David Griffith, Ph.D., Amber M. Northern, Ph.D. 10.31.2018
Podcast
view

What's at stake for schools in next week's elections

Dale Chu
10.31.2018
Flypaper

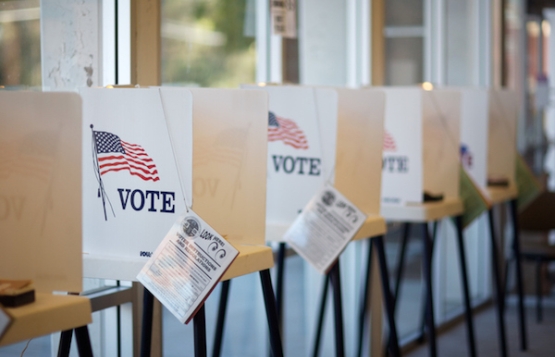
There’s been a lot of talk about “blue waves” and “red walls,” but what will November 6 mean for federal and state education policies? Days away from the crescendo, the answer may depend in part on where you get your news. Some argue that education will be a top-tier issue; others are decidedly less sanguine. The media hype and enthusiasm at the national level belies its importance in some states more than others.

In no small measure, the upcoming midterms will be a referendum on the current administration; uniquely so given the president’s willingness to flaunt previously held conventions. Education’s place has been largely limited to the usual suspects (e.g., Arizona, Oklahoma) as key players in red-state teacher unrest. This has led to a record number of teachers running for state office in those states, but based on the campaign mailers I’ve received here in my home state of Colorado, office seekers don't believe education will drive voters to the polls.

My locally elected representatives have killed trees and spilled ink to highlight their local roots and attention to other bread-and-butter issues like taxes and health care. I’ve also seen one-sentence slogans about restoring civility to government, though nothing approaching the importance of civics education or ensuring the citizenry possess rudimentary knowledge of U.S. history. But there are three areas where the outcome of the election could have a big impact on education, and they aren’t what (or how) you might expect.

State and local funding-related ballot questions are the first place to look. In some states, the political winds have brought an increased appetite for more spending on education. Here in Colorado, there is a tax-based constitutional amendment on the ballot that—if approved—would carry significant implications for state education funding. It’s the largest of fifteen funding-related ballot measures that could allot at least $2.6 billion to education in eleven different states. In addition, two of Colorado’s largest districts are asking for nearly $900 million for teacher pay raises, capital improvements, and technology upgrades. While both measures face an uphill battle, local educators should quickly notice the difference if they’re passed.

Second, there are a few policy-related ballot measures that will be worth watching. Notably among them is a contentious and confounding veto referendum in Arizona that aims to expand eligibility for education savings accounts (ESA). Proponents often refer to ESAs as the “purest form” of school choice. In South Carolina, voters there will decide if the state superintendent becomes an appointed position rather than an elected one. The Palmetto State is one of a dwindling number of states that still elects its state chief, but whether they’re elected or appointed, these offices feel less consequential than they did a decade ago.

That’s because state education agencies and their overseers have historically been administrative entities that act as pass-throughs for federal dollars. It was only with the elevation of the role under former U.S. Secretary of Education Arne Duncan—by his using the bully pulpit to encourage state chiefs to be bold—that we began to view these folks as change agents. The current administration’s laissez-faire approach, coupled with a host of other issues, has in my estimation largely returned these positions back to where they once were.

As a result, I’ve been more interested in the thirty-six gubernatorial races, which is the third and final area that promises to have an outsized effect on education. At first glance, the forces of resistance and repeal look to have the upper hand. For example, both candidates in New Mexico appear ready to do a complete one-eighty on the state’s nationally recognized teacher evaluation system. In Wisconsin, birthplace of the nation’s first voucher program, the state superintendent—who is leading in most polls—has promised to roll back the state’s varied school choice offerings. Here in Colorado, the airwaves have been blanketed by ads that focus more on fearmongering and deception rather than substantive education issues.

But these contests carry broad implications for the implementation of state ESSA plans, which for better or for worse are the education roadmaps for states for the foreseeable future. These are the routes states plan on taking to support struggling schools. I recently examined state school improvement plans as part of an independent peer review. Later this month, a final report will share our findings and hopefully provide this new crop of governors—as well as other key stakeholders—useful insights and recommendations to consider as they invariably place their own mark on education policy.

Taken together, education may be flying under-the-radar in this year’s election cycle, but there are a few areas of nontrivial significance. With so many ballot initiatives related to education funding, there could be additional dollars available for a variety of outlays, including teacher pay raises. Policy changes could be on the horizon, both on the ballot and at the hands of a new cohort of state executives. But without some serious work—requiring serious leadership—any progress could be short lived. No one is looking to Washington anymore when it comes to education policy, but it remains to be seen which states will take the lead. What’s for certain is that there will be a lot of new faces influencing our issue come January.

view

School choice is not at odds with community-building

Brandon L. Wright
10.31.2018
Flypaper

A recent Atlantic article by Amy Lueck critical of school choice rightly celebrates the civic purpose of the traditional American public high school, “not only as an academic training ground, but also as a center for community and activity in American cities.” Shared experiences like school dances, football games, pep rallies, and protests, as well as the uniting of families from different backgrounds, can be beneficial for those involved, and high schools facilitate them better than most civic and social institutions.

But she’s wrong in believing that working to give children and parents more options “reflects a distrust of education as a communal goal, not just an individual one.” Lueck erred in accusing school choice of “dismantling” this model. Proponents are not “leaving the public high school for greener pastures,” and the realization of our goals would not be an “abandonment of the American high school” or “the democratic project of the ‘common school’ that helped shape the American city.”

That is because the “common school” that Lueck idealizes—a single public high school for every teenager in a given community—ceased generations ago for many families, and is not a necessary condition for the communal benefits she espouses. Worse, as she acknowledges but downplays, it has long perpetuated inequality, failed to serve families who want or need something different, and produced poor academic outcomes for disadvantaged families.

Most urban districts moved away from neighborhood high schools decades ago. In Washington, D.C., for example, even before charter schools emerged in 1996, a huge percentage of kids were going to high schools outside of their neighborhoods. In New York City, too, where there are some 300 traditional public high schools, eighth graders submit an application listing as many as twelve programs in order of preference. And in the last two decades, Chicago nearly doubled the number of public high schools available to residents. “Major reforms…focused on increasing the number of high-quality public school options, by splitting up large high schools, creating new small high schools by design…[and opening] more selective-enrollment high schools and special programs within high schools,” write Lisa Barrow and Lauren Sartain, a senior economic at the Federal Reserve Bank of Chicago and a Senior Research Analyst at the University of Chicago, respectively.

Although it’s true that most suburbs and small towns still do have neighborhood high schools, Lueck overstates their value. Yes, they can build a sense of local community for the families and students that are actively involved: kids who play sports or are in the marching band, families who also see each other at church or the neighborhood swimming pool. But those schools, which tend to be big and impersonal, fail to serve a lot of kids and families who are alienated from all of that. This is why so many people look back on their high school years with disgust. And this is exacerbated by the racial and economic segregation inherent in neighborhood assignments—a major impetus for doing away with them in urban areas.

Nor does Lueck’s preferred version of the traditional public high school have a monopoly on the sort of community building that matters. Research has shown, for example, that some schools of choice develop stronger civic values than traditional public schools do. Earlier this year, my colleague Robert Pondiscio wrote about the positive effects of Democracy Prep, a charter school network in New York City that educates more than 5,000 students. A study conducted by Mathemathica found that “Democracy Prep increases the voter registration rates of its students by about 16 percentage points and increases the voting rates of its students by about 12 percentage points.” And it accomplishes this by having its kids participate in annual voter registration campaigns, requiring graduates to pass the U.S. citizenship test, and encouraging students to volunteer, do food drives, and learn through service. Research also shows that schools choice produces students who hold more progressive views on diversity and are less likely to commit crimes. In communities without assigned neighborhood schools, students still form fond memories of school dances, they still attend pep rallies, and fans and participants of the athletic programs still bond over big wins and hard losses. They also still mourn together in times of tragedy, share enthusiasm for social causes, and celebrate as one in times of triumph and elation.

Despite Lueck’s lamentations, charter schools and vouchers are compatible with all of this. They do not, in other words, have the downside she claims they do. And their upside—the reason why proponents push for them—is that they stand to solve many of the inherent problems of the traditional public high school model.

That model is broken. And its flaws manifest in ugly, harmful ways. Schools regularly grant diplomas to students who aren’t ready for college, career, or adulthood. Teachers and administrators encourage everyone to apply to and attend college, even those who aren’t ready and end up wasting time and money chasing a degree they never earn. Districts ignore promising career and technical education programs that help young people find gainful, secure vocations. And education professionals everywhere go on pretending that a single kind of school can effectively serve the varied needs of each and every child.

Those most hurt by all of this are our most vulnerable: poor and minority children, English language learners, and those from all walks of life for whom the traditional school model isn’t a good fit. Consider, for example, that nationally almost 38 percent of twelfth graders are below the basic level of achievement in math on the National Assessment of Education Progress, as of 2015, the most recent year for which data are available. And basic is a low bar; proficient is the one they’re supposed to clear. For those eligible for free or reduced priced lunch, the number is 54 percent. For black and Hispanic students, it’s 64 and 53 percent, respectively. The trends in reading are comparable.

Then, after they leave high school, just 40 percent of black enrollees at four-year public universities graduate within six years—a figure that is 21 percentage points below their white peers, and 18 percentage points below the nationwide average. It’s even worse for students who must take remedial courses because they aren’t prepared for college classes when they arrive on campus. Fifty percent never complete their remedial education, and less than 25 percent who attend community college earn a degree within eight years. These are not the results of a successful system.

Perhaps these dismal academic outcomes are why some choice opponents have pivoted to other supposed benefits of the traditional high school. Maybe that's what all this talk about its ostensible unique and exclusive communal advantages is about. But there’s nothing singularly special about that model. Instead, it’s like any other design: It works well for some students, and fails others. So instead of being the only public option, young Americans would be better served if it were one among many—at least in places big enough to support meaningful choice. Those high schoolers would still have the quintessential teenage experiences, and communities would benefit. The big difference would be that more children would be getting the education they want and deserve.

view

We measure what matters, which is why subgroups in ESSA accountability systems are important

10.31.2018
Flypaper

Recently, Mike Petrilli wrote about the Alliance for Excellent Education’s analysis of state ESSA plans in which we found that twelve states do not ensure subgroups are universally included in school ratings. While acknowledging that this could be an issue, Mike, with an assist from Aaron Churchill, used Ohio data to make the case that we were (mostly) crying wolf: Including subgroups in school ratings doesn’t matter because subgroup performance is almost always reflected in schoolwide averages, at least when using value-added measures. Specifically, Mike and Aaron showed how school-level growth data for “all students” in Ohio tends to be strongly correlated with school-level growth data for “Black” and “low-income” students. Very few schools would have received both an “A” or “B” grade for “all students” growth and a “D” or ”F” for the specific subgroup’s growth. Mike concluded that we “should stop fretting about this particular aspect of state accountability systems” and move on.

I agree that there are other aspects of accountability that should be investigated, and All4Ed has plans to do so as ESSA implementation continues. And I agree that I’m an uber-wonk (thanks, I think?). But I disagree that All4Ed and other advocates for historically underserved students should stop worrying about the inclusion, or lack thereof, of subgroups in school ratings.

Statistics aren’t the only consideration when building an accountability system. By Mike’s logic, if school-level math and reading proficiency data tend to be highly related, we could eliminate math achievement from school ratings and rely on reading alone as a good-enough proxy. No one is arguing for that, however, because student mastery of both subjects is important and including both in accountability systems is one of the clearest signals states can send that a high-quality school means teaching students well in both areas. Isn’t it just as true that a school should not be considered a high-quality learning environment if it fails to teach subgroups of students effectively? And what does it say about a state’s values if subgroups are missing from school ratings?

To boot, it turns out “all students” data isn’t always such a great proxy for subgroup data, even when you’re looking at growth (which is less likely to be correlated with student demographics). Here are two examples, also using school-level growth data[i] from Ohio:

Students with disabilities: Nearly half of schools getting an “A” for “all students” growth receive a “C” or worse for students with disabilities’ growth—information that would be lost if only the “all students” data were considered. In total, this affects about 450 schools, or 17 percent of all Ohio schools with both “all students” and students with disabilities growth data.

School-Level Growth for Students with Disabilities

School-Level Growth for “All Students”


A

B

C

D

F

A

422

181

314

65

70

B

19

21

63

26

20

C

29

44

134

65

71

D

9

19

58

34

27

F

18

33

196

159

610

Low-performing students: Likewise, about one-third of all schools with an “A” for “all students” growth receive a “C” or lower grade for the growth of the lowest-performing students (i.e., students whose past achievement was in the bottom twentieth percentile statewide). That’s about 330 schools, or 12 percent of all Ohio schools with growth data for both “all students” and the low-performing subgroup.

School-Level Growth for Students in Bottom 20th Percentile Statewide

School-Level Growth for “All Students”


A

B

C

D

F

A

505

183

281

36

13

B

30

34

72

8

8

C

41

61

181

52

24

D

10

14

81

35

14

F

12

31

252

187

608

Maybe that’s why Ohio doesn’t rely on “all students” data alone. The state chose to include growth for these two subgroups—plus “all students” growth and growth for gifted students—in the “Progress” component of its A–F school grades. Further, schools can’t get an “A” on the Progress component if they receive a “C” (or lower) for growth of any of the three subgroups; the schools highlighted above can do no better than a “B.” In addition, Ohio uses disaggregated data in the “Gap Closing” component, which examines achievement and graduation rates for students of color, low-income students, English learners, and students with disabilities, along with English language proficiency. For these reasons, Ohio is not among the states we flagged for concern.

Even better, Ohio makes these disaggregated indicators matter. Over one-third of a school’s grade can be based on subgroup performance.[ii] As a result, not a single “A” school overall received a “C” or worse on Gap Closing. In fact, 99 percent of “A” schools in Ohio also received an “A” for Gap Closing. There are also safeguards to ensure that the Gap Closing component grade is lowered in schools where any individual subgroup demonstrates very low achievement or graduation rates.

School “Gap Closing” Component Grade

Overall School Building Grade


A

B

C

D

F

A

238

3

0

0

0

B

690

255

31

4

0

C

263

413

121

96

68

D

2

105

123

141

349

F

0

0

1

5

272

And that’s how it should be. Building an accountability system isn’t merely a statistical exercise states go through to meet the technical requirements of federal law. It’s one of the most effective tools states have to signal what they value. For example, states added new measures under ESSA—like college and career readiness, chronic absenteeism, and suspension rates—to better align accountability systems to critical policy goals. Is improved performance for subgroups of students not a critical policy goal?

State leaders and organizations representing them have spent the last two years touting how states will use ESSA to advance equity for historically underserved students. But the signal states send when their rating systems only examine “all students” data is precisely the opposite.

Fortunately, the mismatch between states’ values and accountability policies has an easy solution. Yes, states could legislate or regulate a new system that includes a significant weight for subgroups on key indicators—like the one used in Ohio. Given that ESSA plans were just approved, however, that’s unlikely to be an appealing option. Instead, states could adopt a business rule to ensure ratings reflect subgroup performance. Seven states in our analysis (Illinois, Kentucky, Louisiana, Maine, Massachusetts, Nevada, and Rhode Island) deploy these rules already, and they can work with any kind of rating—whether five-star reviews, A–F grades, or a descriptive label. In some states, a school cannot receive the highest or second-highest rating if it has a consistently underperforming subgroup (e.g., a school cannot simultaneously be identified for targeted support and be among the highest-rated in the state). In others, the rating is lowered one level if the school has a low-performing subgroup (i.e., a “B” school could become a “C”). Either way, these rules build coherence between school ratings and school identification, are easy to implement and understand, and reinforce the value that a high-quality school must serve subgroups of students well.

Mike is right on another point: We don’t yet know how many schools will receive high overall ratings under ESSA despite having a low-performing subgroup. But we do know that states can take simple steps to make sure the number is zero and reinforce their commitment to equity at the same time. Until they do, I reserve the right to keep worrying.

Anne Hyslop is the Assistant Director, Policy Development & Government Relations at Alliance for Excellent Education


[i] The Progress component of Ohio’s A–F grading system is based on a weighted average of four sub-measures: growth in math and reading for all students (55%), students with disabilities (15%), the lowest-performing students (15%), and gifted students (15%). The data used here are from the 2017-2018 School Report Cards Data Spreadsheets, which include a school’s overall grade, its Gap Closing component grade, its Progress component grade, and grades for each of the four groups of students examined within the Progress component.

[ii] Ohio awards school grades to both districts and schools based on six components. Because not every component is applicable to each school, the precise percentage of the overall grade based on subgroup data varies based on the grade levels the school serves.

view

The next British Invasion: ResearchEd comes to the U.S.

Robert Pondiscio
10.31.2018
Flypaper

Last Saturday was cold, grey, and dismal in Philadelphia. I spent the day warming my soul inside a Jesuit high school among a disparate group of teachers, researchers, academics, and school leaders at a ResearchED conference, the fourth one held in the United States. If you’re not familiar with ResearchEd—and I’d wager you’re not—allow me to introduce you. It’s the best education initiative you’ve never heard of. It’s big in England and deserves to be as big here in the colonies.

ResearchEd started five years ago almost on a lark, the brainchild of an engaging and gregarious English high school teacher named Tom Bennett. Frustrated by the relative rarity of evidence-based practice in education in the U.K., Bennett took to Twitter (he almost makes it respectable) and asked if anyone would get involved if he ran a conference on it. Enough hands went up that ResearchEd was launched—a zero capital, break-even inaugural event staffed entirely by volunteers. Five years later there have been ResearchEd events in thirteen countries with 22,000 unique attendees, according to Bennett, who says the last U.K. event drew 1,350 with half again that number on a waiting list to purchase a ticket. I’ve written previously that for the U.S. education reform movement to live up to its promise and ideals, and to move the needle for kids, it needs to evolve from a movement whose center of gravity is education policy to one with practice at its core. The aims and values researchED promotes—raising the research literacy of teachers; creating a community of educators dedicated to evidence-based practice—hits this spot-on, as they say on the other side of the pond.

Even stateside, ResearchEd has a British accent. In addition to Bennett, keynote speaker Dylan William and Daisy Christodoulou were among the day’s big draws. Efrat Furst, a Harvard-based cognitive neuroscientist spoke to a packed, standing room only classroom. ResearchEd is for those whose Twitter feed includes such names along with those of other presenters such as Pedro de Bruyckere, Tom Sherrington, and Kathy Hirsh-Pasek. The man behind the U.S. version of ResearchED is an energetic veteran Minnesota educator, Eric Kalenze, who in keeping with ResearchED’s grassroots, DIY vibe, recruited all speakers and got them to waive any fees they might normally charge, as an in-kind contribution. It’s not unusual for any of these notables who were on hand in Philly to give Ted Talks or speak at conferences in front of hundreds of educators, particularly in their home countries. At ResearchEd, they held forth in high school classrooms in front of a few dozen fellow educators then took up seats in the class for the next rotation of speakers. This gives the conference an invigorating bootstraps feel, like what it must feel like to go to a pub to see a band that’s huge in England, then hang out for a drink after their set. Likewise, I cannot recall being in many rooms with a more diverse set of interests: charter school executives and researchers; teachers from public, private, and parochial schools; school district supes and parent advocates, united more by an interest in classroom practice and an evidence-oriented mindset than their professional roles. Count me as a disciple. I had a minor role in a panel discussion on parent advocacy, but spent most of the day as an eager conferee, soaking up all that I could. 

For the uninitiated ResearchEd has launched a quarterly magazine; you can sign up to receive it for free at the organization’s website. It says a lot about the initiative that University of Virginia cognitive scientist Dan Willingham was on the cover of the first issue. If Willingham’s peerless writing on the intersection of research and practice tops your professional reading, then ResearchEd is your tribe. 

This year’s event was discernibly tighter, more coherent, and richer than past ResearchEd U.S. events, and there was palpable enthusiasm for more among the attendees. Bennett tells me he’s already had several offers from school leaders who attended to host next year’s conference in their schools. Here’s hoping that it becomes big in the states. It’s the movement and mindset American education needs.  

view

Changes in teacher practices throughout the Common Core era

Sophie Sussman
10.31.2018
Flypaper

A recent RAND report examines how math and English language arts teachers’ use of instructional materials and knowledge of state standards and standards-aligned practices have changed during the Common Core era.

Researchers Julia H. Kaufman, V. Darleen Opfer, Michelle Bongard, and Joseph D. Pane used the results of surveys administered in 2015, 2016, and 2017 to the American Teacher Panel (ATP), a randomly-selected, nationally-representative group of full-time K–12 public school teachers. Responses from different years were aggregated, and then disaggregated, based on whether a teacher’s state referenced Common Core in its standards and/or used standards-aligned resources, as well as by students’ “vulnerability” (determined by the percentage who received free or reduced-price lunch, were English language learners, or had individualized education plans). The authors also controlled for teacher characteristics such as gender and professional experience, as well as school characteristics such as size and the student population’s overall socioeconomic status.

In many ways, the RAND report is similar to Fordham’s own: Reading and Writing Instruction in America’s Schools. In particular, both used the American Teacher Panel (though not the exact same teachers). And both sought to capture changes in teachers’ attitudes and practices, though the timelines differed, since we compared teachers 2017 responses to their baseline responses from 2012. Unlike Fordham, however, RAND surveyed math teachers in addition to ELA teachers.

In both math and ELA, Kaufman and team found that teachers reported few changes in the textbooks they used between 2015 and 2017. However, they did find an increase in math and ELA teachers’ use of online materials. Encouragingly, although un-vetted sites like Pinterest and Teacherspayteachers.com remained popular over the three years, educators also reported increased use of websites featuring Common Core–aligned or content-specific materials, such as CoreStandards.org, NewsELA.org, and AchievetheCore.org, especially in states that stuck with the standards.

At the same time, teachers also reported using many options that weren’t aligned with the Common Core. For example, there was a significant increase in reliance on leveled-reading materials by ELA educators, from 17 percent in 2015 to 31 percent in 2017. This is consistent with the findings of Fordham’s report. Even though the ELA standards emphasize teaching with grade-level texts rather than materials that vary based on an individuals’ reading level, only a quarter of the teachers in the RAND survey correctly identified “assigning complex texts that all students in a class are required to read” as a teaching technique aligned with their standards.

Teachers also reported an overall decrease in their use of math Common Core standards-based practices, such as, “Choose and use appropriate tools when solving a problem,” though these changes were not major. These decreases were only significant when comparing low-vulnerability students to their high-vulnerability peers. High-vulnerability teachers only reported decreased use of one of the standards-based practices—perhaps due to the greater emphasis on accountability in those schools.

Because the authors adjusted the survey after its initial implementation in 2015, teachers’ responses to some questions could only be observed for 2016 and 2017—making trends difficult to establish. Yet despite this caveat, the report offers additional insight into how the Common Core era has been implemented across the country. The results are decidedly mixed.

Source: Julia H. Kaufman, V. Darleen Opfer, Michelle Bongard, and Joseph D. Pane, “Changes in What Teachers Know and Do in the Common Core Era: American Teacher Panel Findings from 2015 to 2017,” RAND Corporation (2018).

view

The Education Gadfly Show: An #Eduween riddle: How is pre-school research like a skunk?

10.31.2018
Podcast
 

On this week’s podcast, Russ Whitehurst, a senior fellow at the Brookings Institution, and founding director of the Institute of Education Sciences, joins Mike Petrilli and David Griffith to discuss early childhood education and whether we expect too much from it. On the Research Minute, Amber Northern examines an alternative approach to remedial education in Tennessee.

Amber’s Research Minute

Thomas J. Kane et al., “Remedial Math Goes to High School: An Evaluation of the Tennessee SAILS Program,” Center for Education Policy Research, Harvard University (October 2018).

Fordham Logo

© 2026 The Thomas B. Fordham Institute
Privacy Policy
Usage Agreement

National

P.O. Box 110
Burke, VA 22009

202.223.5452

[email protected]

Ohio

P.O. Box 82291
Columbus, OH 43202

614.223.1580

[email protected]

Sponsorship

130 West Second Street, Suite 410
Dayton, Ohio 45402

937.227.3368

[email protected]