

Poverty cannot explain America's mediocre test scores
That excuse turns out to be a crutch that’s unsupported by the evidence. Michael J. Petrilli and Brandon L. Wright
That excuse turns out to be a crutch that’s unsupported by the evidence. Michael J. Petrilli and Brandon L. Wright

At a time when the national conversation is focused on lagging upward mobility and yawning income inequality, it is no surprise that many educators point to poverty as the explanation for American students’ mediocre test scores compared to their peers in other countries. If teachers in struggling U.S. schools taught in Finland, says Finnish educator Pasi Sahlberg, they would flourish—in part because of “support from homes unchallenged by poverty.” Michael Rebell and Jessica Wolff at Columbia University’s Teachers College argue that middling test scores reflect a “poverty crisis” in the United States, not an “education crisis.” Adding union muscle to the argument, American Federation of Teachers president Randi Weingarten calls poverty “the elephant in the room” that accounts for poor student performance.
But does this explanation hold water?
It’s an important question. If critics of education reform are correct that our schools are doing as well as can be expected given the economic challenges that their students face, they could also be right in saying that school reform is beside the point, misguided, or even doing more harm than good.
So what does the evidence show? To prove that poverty is the major factor driving America’s meager academic achievement, at least one of these claims need to be established:
Let’s examine each in turn.
Do U.S. students from low-income families underperform their peers overseas?
Low-income students everywhere do worse on tests of academic achievement than their more affluent peers. That’s as true in the United States as it is in every other country ever studied, and it’s been true for as long as scholars have collected achievement data.
The question isn’t whether America’s low-income students do worse than our upper-middle-class kids. (They do.) It’s whether our poor students are particularly low-scoring compared to other countries’ poor students. Is that what’s dragging down our averages?
To explore this question, we’re obliged to wrestle with measurement issues. The problem is complicated because no international data set contains both good measures of family income and good measures of student test score performance.
The best available data are collected by the Program for International Student Assessment (PISA), which is sponsored by the Organization for Economic Co-Operation and Development (OECD). For its own analyses, PISA uses an index of economic, social, and cultural status (ESCS) that considers parental occupation and education, family wealth, home educational resources, and family possessions related to “classical” culture. PISA analysts use the index to stratify each country’s student population into quartiles.
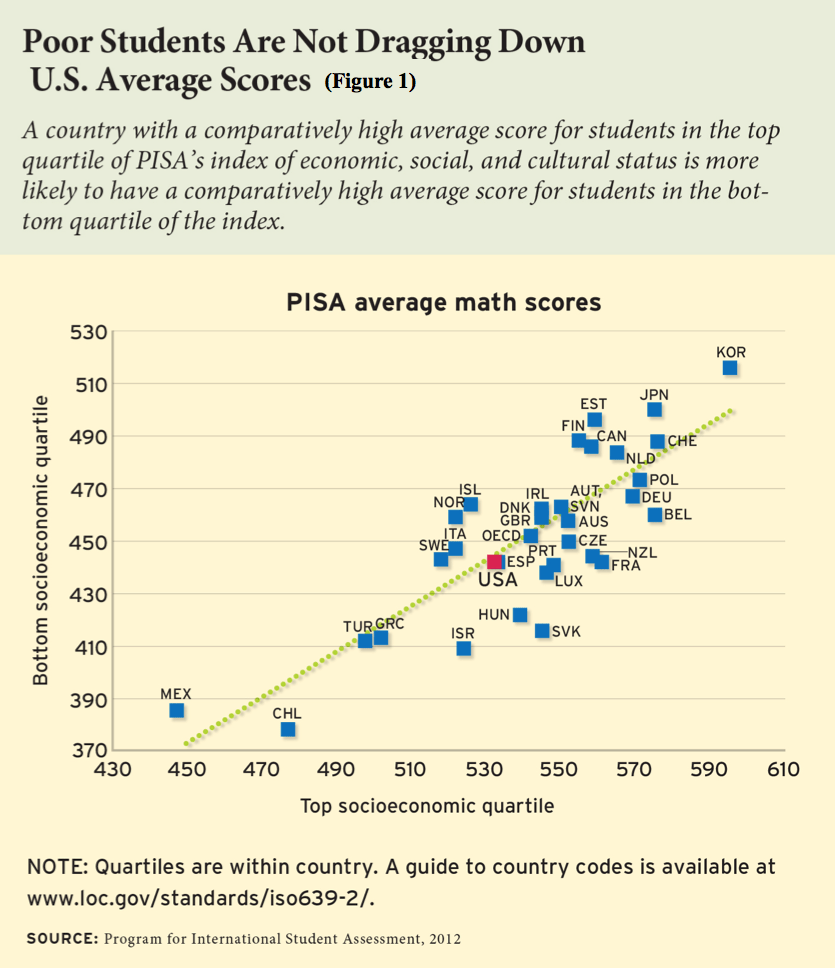
Not everyone will agree with the way the ESCS index is constructed, but the data presented in Figure 1 are nonetheless instructive. The test scores of students in the bottom quartile of the ESCS index are plotted against those of students in the top quartile. If students in these two quartiles did equally well in each country (as compared to similarly situated students in other countries), then the dotted regression line displayed in green would have a steeper slope, and every dot would fall exactly on that line. As you can see, the actual pattern is not that perfect: Countries like Belgium and France are relatively better at teaching their higher-status students, while other countries like Canada and Finland do relatively better at instructing students from lower-status families. But notice that the United States falls almost exactly on the regression line. It does equally well (or equally poorly, if you prefer) at teaching the least well-off as those coming from families in the top quartile of the ESCS index.
If we look at a different marker of socioeconomic status—parental education levels—we find a similar pattern. In the United States, parents without a high school diploma are much more likely to be in poverty than their better-educated peers, and their children are much more likely than their peers to be low-performing and to drop out of school themselves.
In a study that examined whether some countries are particularly effective at teaching students from disadvantaged backgrounds, Eric A. Hanushek, Paul E. Peterson, and Ludger Woessmann found something interesting: It makes little difference whether countries are ranked by the performance of students whose parents had a college education or by the performance of students whose parents had no more than a high school diploma. If a country is comparatively effective at teaching the first group, it tends to be no less effective (compared to others) at teaching the second. The United States performs as expected, proving to be not especially effective at teaching students from the best-educated or the least-educated families. The authors write,
Overall, the U.S. proficiency rate in math places the country at the 27th rank among the 34 OECD countries that participated in the Program for International Student Assessment (PISA). That ranking is somewhat lower for students from advantaged backgrounds (28th) than for those from disadvantaged ones (20th).
There is no evidence that disadvantaged students in the United States are underperforming other countries’ disadvantaged students. If anything, it’s the “advantaged” American students (those whose parents have a high level of education) who are falling short in international comparisons.
Is America’s child poverty high compared to rates elsewhere?
So far, we’ve demonstrated that disadvantaged students in the United States are performing as expected, given the performance of better-situated U.S. students.
But if more students are poor in this country than in others, it is still possible that students from low-income families are dragging down our national averages. If that is true, poverty could still be the explanation for our mediocre test scores.
In case that concept isn’t intuitive, consider an analogy. Imagine we are comparing two colleges’ athletic programs. Both schools field the same teams, and each team is perfectly matched when it comes to height, on average. The basketball teams are similarly tall; the gymnastics teams are similarly short. But what if School A has twice as many basketball players on its team, and School B has twice as many gymnasts? Those extra gymnasts will drag down the average height of School B’s program.
So we have to decipher what’s going on here. Do we have a larger number of low-income students compared to other countries? Do we have more gymnasts on our team?
For those educators quoted at the beginning of this essay, the answer is yes. They assert that the United States has a sky-high child poverty rate compared to other developed countries.
To support their claim, they use a “relative poverty” measure stipulating that all families with less than half the median income in the country are, by definition, “poor.” By that measure, we do indeed have a lot more children living in poverty than most other advanced economies.
Relying on measures of relative poverty is appealing for its simplicity, but it is a highly misleading approach because it’s more a measure of income inequality than of poverty. That’s a particular problem for countries (like the United States) with high median income and lots of income inequality.
To see how relative poverty rates can be misleading, let’s look at how they compare to absolute poverty rates for the general population in the American states. In Figure 2, we report the proportion of people living in households earning less than half of their states’ median incomes (basing state median incomes on the 2013 Census Current Population Survey). We also show each state’s absolute poverty rate as it is traditionally defined: the percentage of all people in the state living in households below the federal poverty line, which is currently set at $24,250 for a family of four.
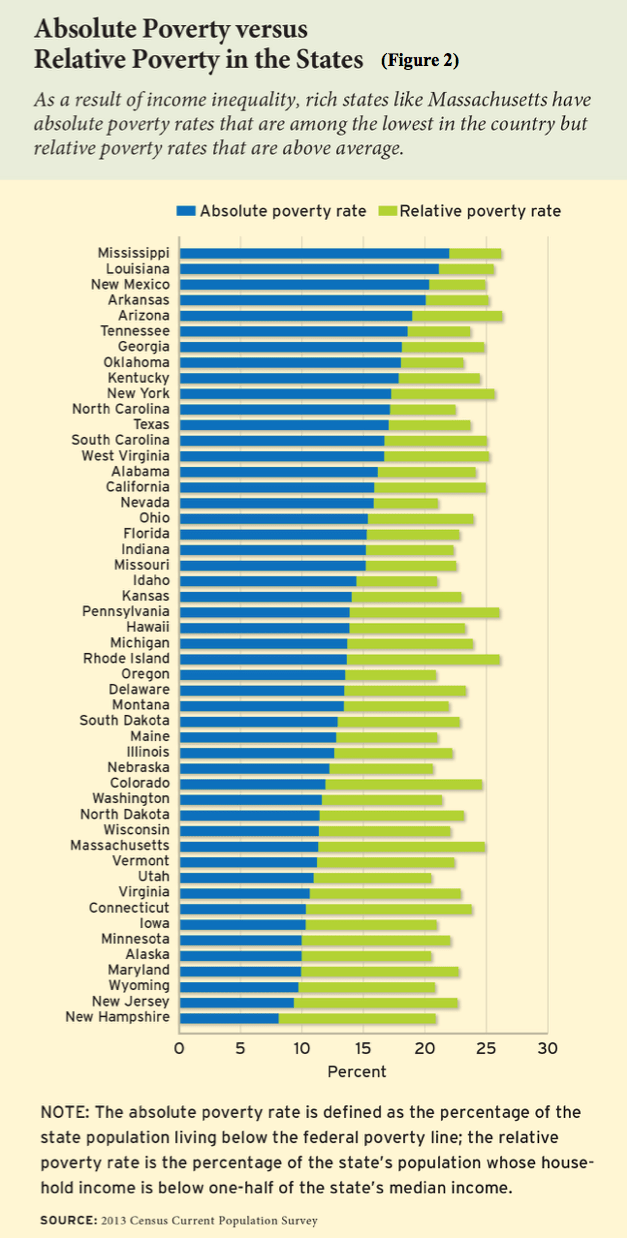
For some states, looking at either relative poverty or at absolute poverty makes little difference. Arizona, Mississippi, and Louisiana have a lot of poor people no matter how you slice the data.
But notice where wealthier states like Massachusetts and Connecticut appear on the graph. Their absolute poverty rates are among the lowest in the country. But their relative poverty rates are above average, and notably higher than states like Texas, Tennessee, and Oklahoma. Massachusetts has a higher relative poverty rate than Georgia, Kentucky, and Alabama.
Of course, Massachusetts doesn’t really have more poverty than Alabama—but it does have more income inequality. Nobody argues that Massachusetts’s “large number of poor students” drags down its state test score averages, because it doesn’t actually have a large number of poor students as compared to other states. Yet that’s what you would think if you relied on relative poverty measures.
The same dynamic plays out when we use relative poverty rates to compare countries.
In Figure 3, using 2010 data from the Luxembourg Income Study, we approximated absolute poverty using a methodology that takes into account all forms of income, including social welfare benefits (see here for a full explanation of our methodology). By this measure, the absolute poverty rate in the United States is lower than the that of the United Kingdom, virtually the same as Germany’s, and just barely higher than Finland’s. To be sure, we still have too much poverty. But once social welfare benefits are included and we look at absolute rather than relative poverty, America is hardly an outlier. That’s because many of the U.S. households counted as poor on a relative measure would be considered middle class on an absolute measure.
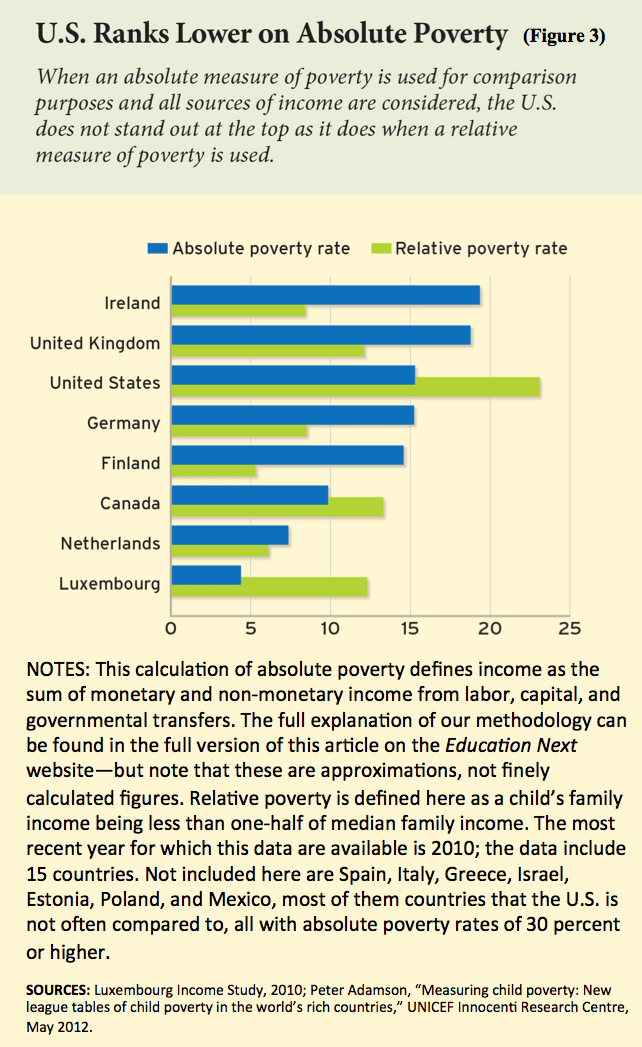
The United States doesn’t really have more poverty than, say, Germany. It simply has more income inequality. As with Massachusetts, we can’t blame America’s “large number of poor students” for dragging down our average test scores because, compared to other countries, we don’t have an unusually large number of poor students.
Conclusion
Critics of education reform are certainly correct when they say that poverty is a major factor in lackluster academic performance.
Still, poverty is an issue for virtually every nation on the planet. Where reform critics get it wrong is when they claim that America’s average scores are dragged down by the particularly poor performance of low-income students—or that the advantaged kids are doing just fine. That is objectively untrue. And its scores are not dragged down by an unusually high proportion of poor students, as measures of absolute poverty find the United States not to be an outlier at all.
America’s mediocre performance is remarkably consistent. Yes, our affluent students outperform our poor students. But they don’t outperform their peers overseas.
This doesn’t imply that reform, as currently formulated, is on the right track. The enigma of our mediocre student performance is a topic worthy of study and debate, as is the challenge of helping students at all points on the economic spectrum perform better.
What it does show is that poverty can’t explain away America’s lackluster academic performance. That excuse, however soothing it may be to educators, politicians, and social critics, turns out to be a crutch that is unfounded in evidence. We need to stop using it and start getting serious about improving the achievement of all the nation’s students.
Editor’s Note: This article originally appeared in a longer and different form in Education Next—and was that publication’s most-read article of 2015.

Perhaps it’s because, as a nation, we’ve come around on teacher quality. Or perhaps it’s because so many of the policy prescriptions that contribute to improving the teacher corps are so dry, technical, and largely beneath the hurly-burly of public debate. Either way, NCTQ’s 2015 Policy Yearbook is notable for the substantial amount of positive change it documents, with states “continuing down a reform path focused on teacher effectiveness” and “fewer states out of step with the prevailing trend each passing year.” What the report fails to note is that NCTQ itself can claim substantial credit for creating this tipping point, amassing a substantial record of effectiveness in a very short amount of time.
Getting religion on teacher quality is one thing. Ending our sinful ways is a very different matter. The average state teacher policy grade for 2015 is a C-minus, a mark that is “still far too low to ensure teacher effectiveness nationwide,” NCTQ notes. Yet just six years ago, in the 2009 yearbook, the average was a D. The pews are beginning to fill up.
Better evidence of improvement can be seen state-by-state. In 2015, thirteen states earned grades between B-minus and B-plus (six years ago, no state scored better than a C). Today, twenty-four states set a high academic bar for admission into teacher preparation programs; in 2009, thirty-six didn’t require even a basic skills test. Twenty-two states now require elementary school teachers to demonstrate content knowledge in core subjects they teach; twenty-six now measure their knowledge of math. And perhaps the biggest conversion of all: In 2009, not one state tied evidence of teacher effectiveness to employment decisions of any consequence. A mere six years later, nearly half (twenty-three) do. Can I get an “Amen”?
Lest complacency set in, the yearbook still offers ample cause for outrage. It is fine and laudable, for example, that a slim majority of states now require middle school teachers to pass a test in the core subject that they teach. But it’s mind-numbingly stupid that states everywhere didn’t long ago make this the very first criterion for teaching middle school. (What could possibly be more important? Ensuring that prospective teachers aren’t on the FBI’s Most Wanted list?) It’s also alarming that, for all the attention given to early childhood education, NCTQ cannot identify even a single state as a “best practice state”—or even one meeting the goal of delivering well-prepared early childhood teachers.
Florida is still atop the leader board with an overall grade of B-plus (the nation still awaits its first A-rated state). New Mexico wins “most improved” with a jump from D-plus to C on the strength of gains in its teacher preparation program accountability, alternative certification programs, and teacher effectiveness policies. Indiana and New York this year join Louisiana and Tennessee with overall B grades. NCTQ singles out the Empire State for particular praise in improving policies for certifying special education teachers. Fordham’s home state of Ohio rates a B-minus; however, the yearbook gives Ohio the highest marks in the nation for expanding the pool of teachers with “flexible yet rigorous pathways” into the profession.
“The teacher policy glass is starting to look half full on many fronts,” the report notes. That is indeed encouraging. Under the leadership of Kate Walsh, NCTQ has good reason to be proud of its work writing the hymnal from which an ever-increasing number of state policy makers are singing.
SOURCE: “2015 State Teacher Policy Yearbook,” National Council on Teacher Quality (December 2015).
The effort to improve educational outcomes for African American students can fairly be described as the animating impulse behind the education reform movement broadly. Hence, it’s downright depressing to repeat some of the figures in this report: “On the 2015 NAEP, only 18 percent of African American fourth graders were found to be proficient in reading, and only 19 percent scored proficient in math,” the authors note. “The eighth-grade numbers were even worse, with only 16 percent of African American students rated proficient in reading and only 13 percent rated proficient in math.” College and career readiness? Not so much. Quick: In how many states did more than 5 percent of African American students graduate having passed at least one AP exam in a STEM subject? (Three: Colorado, Massachusetts, and Hawaii.) How many states with five hundred or more African American ACT test-takers had 17 percent or more score as college-ready on all four tested subjects? Not one.
Depressed yet?
Still there are some examples of significant progress: Twenty-five years ago, only 1 percent of Washington, D.C.’s eighth-grade African American students were proficient in math; today it’s 13 percent. High school graduation rates for black students are on the rise—as high as 84 percent in Texas, the national leader (Nevada and Oregon are the laggards, graduating only 57 percent of African American students). “But college preparedness rates that equal only one-tenth of the graduation rate seem extreme,” the authors note, with understatement.
While nothing if not clear-eyed about the challenges and results, this report ventures out where far too many publications in this sad genre fear to tread. It features hopeful news of programs large and small that have had a demonstrable positive impact on outcomes for African American kids (many of which, I confess, I was almost wholly unfamiliar with). There’s “Advancement via Individualized Determination” (A.V.I.D.), a program for C students with college ambitions. AVID reaches hundreds of thousands of kids annually and has made college entrance gaps between black and white students in the program “statistically nonexistent.” Even more promising, those gains seem to stick: “After four years, the gap between white and black AVID students making it to the senior year of college was only 3 percent.” Another option, the National Math and Science Initiatives (NMSI), has made “great strides in closing the STEM achievement gap, dramatically increasing participation and success in AP STEM courses among traditionally underserved populations.” The Ten Boys Initiative, a Boston Public Schools project, likewise shows promising gains in language proficiency, with concomitant reductions in absences and suspensions.
The highlighted initiatives “prove it is effective to identify a strategy, integrate it into everyday work, and make it a long-lasting priority rather than a fleeting program.” The authors (principally Michael Q. McShane, late of AEI and now director of education policy of Missouri’s Show-Me Institute), conclude with several “common themes” that have emerged from their research into these promising programs: small things matter, like creating environments conducive to learning; community support is also imperative; without the public’s and parents’ support, efforts can be short lived. And of course, measurement matters. “The most promising of programs highlighted are able to connect success stories to real data that are moving the needle on improving student performance.”
SOURCE: Michael Q. McShane, “The Path Forward: Improving Opportunities for African-American Students,” U.S. Chamber of Commerce Foundation (December 2015).