
College preparedness over the years, according to NAEP
The benefit of different post-diploma paths. Michael J. Petrilli and Chester E. Finn, Jr.
The benefit of different post-diploma paths. Michael J. Petrilli and Chester E. Finn, Jr.

For almost a decade, the National Assessment Governing Board, which oversees the National Assessment of Educational Progress, studied whether and how NAEP could “plausibly estimate” the percentage of U.S. students who “possess the knowledge, skills, and abilities in reading and mathematics that would make them academically prepared for college.”
After much analysis and deliberation, the board settled on cut scores on NAEP’s twelfth-grade assessments that indicated that students were truly prepared—163 for math (on a three-hundred-point scale) and 302 for reading (on a five-hundred-point point scale). The math cut scores fell between NAEP’s basic (141) and proficient (176) achievement levels; for reading, NAGB set the preparedness bar right at proficient (302).
When the 2013 test results came out last year, NAGB reported the results against these benchmarks for the first time, finding that 39 percent of students in the twelfth-grade assessment sample met the preparedness standard for math and 38 percent did so for reading.
These preparedness levels remain controversial. (Among other concerns is the fact that the NAEP is a zero-stakes test for students, so there’s reason to wonder how many high school seniors do their best on it.) But NAEP might in fact be our best measure of college preparedness because, unlike the ACT, SAT ACCUPLACER, or Compass, it is given to a representative sample of high school students (at least those who make it to the twelfth grade). That doesn’t make it perfect, but it’s more revealing than the alternatives with regard to the population as a whole.
That was 2013. But what about over the long haul? We decided to use NAEP to track college preparedness over the past two decades. This was easy for reading, since the “prepared” level is set at the same point as “proficient”—and it’s a breeze to find the percentage of students at or above proficient since 1992. Math was harder both because its cut score fell between “basic” and “proficient” and because a new test and scale were introduced in 2005. We owe special thanks to the National Center for Education Statistics, which calculated the results for math that are displayed below using restricted NAEP data.
Here’s what we found—the trends for “college preparedness” over time—since 1992 for reading and since 2005 for math:
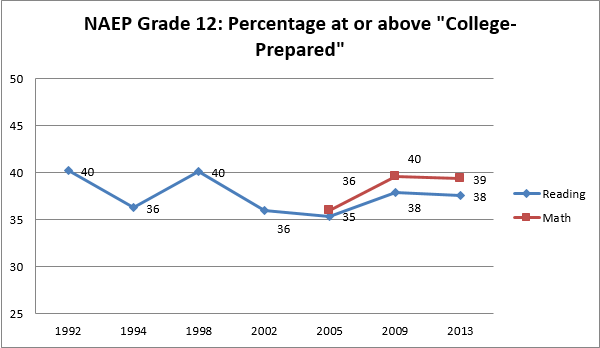
The main storyline is consistency. The rates have bounced between 35 and 40 percent; they are currently up a bit since a low point in 2005. Considering that U.S. high school graduation rates are also up significantly over this period—and thus a greater portion of students are reaching the twelfth grade—these are mildly encouraging trends, despite the overall flatness of the lines.
Furthermore, the (mostly) flat lines are not due to “Simpson’s Paradox.” In education, that phenomenon explains why some aggregate trend lines look flat or worse, even though every student subgroup is improving, because of the changing demographic composition of the total student population (e.g., lower-scoring Latino students are gradually replacing higher-scoring white students). In this case, though, each of the three main subgroups shows basically the same flat trends:
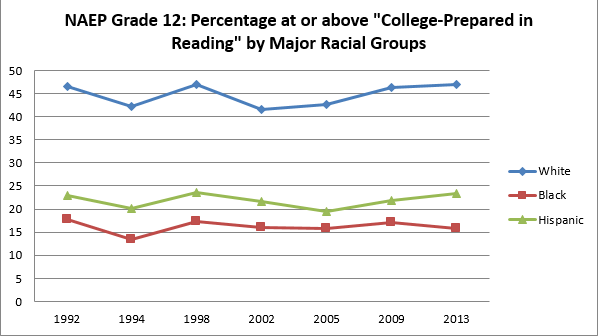
Nobody should celebrate the fact that fewer than 40 percent of high school seniors are academically prepared for college-level work. (ACT shows similar “readiness” proportions for those who take its high-stakes test.) But why do we have the sense that this problem has worsened over time?
That’s because the proportion of recent high school graduates attending college is far higher than the proportion of twelfth graders who are prepared for college—and that gap has worsened over time. It started at 21 percentage points in 1992, grew to 33 points in 2005, and stood at 28 points as of 2013. (These numbers are for reading.)
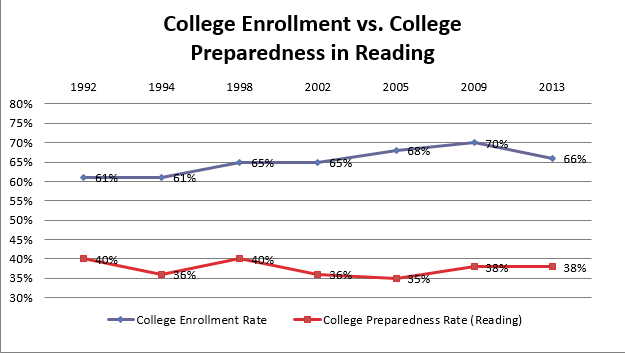
(Note: The college enrollment numbers come from Census Bureau table 276 - College Enrollment of Recent High School Completers, defined as: “persons 16 to 24 years old who graduated from high school in the preceding 12 months. Includes persons receiving GEDs.”)
To repeat: The “college preparation gap” is larger now than in 1992 even though the college preparedness rate has remained relatively flat, due to the fact that the proportion of recent high school graduates enrolling in college rose sharply between 1994 and 2009—from 61 percent to 70 percent—before easing back down to 66 percent in 2013.
Combine those two trends—college enrollment and college preparedness—and we can make a rough estimate of the number of students who arrived on campus prepared. The next chart takes the proportion of twelfth graders testing at the college-prepared level in reading and divides it by the proportion of that class of students immediately enrolling in college. (To be sure, we have to make a significant assumption that virtually all students who reached the “college-prepared” level on NAEP enrolled in college. That is a stretch, but probably not too much of a stretch to make this exercise useful.)
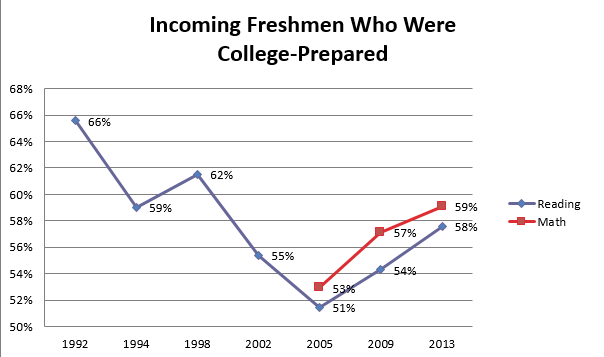
(Note: For each year, we divided the proportion of students who were college-prepared by the proportion that enrolled in college. For 1992, for example, 40% were college prepared and 61% enrolled in college. 40%/61% = 66%.)
No wonder that, around 2005, the country felt an acute sense of crisis about so many students arriving on campus unready for college-level work. Barely a majority of freshman were “college-prepared,” versus two-thirds of students a dozen years earlier.
But there’s a tiny bit of good news, which is that the preparedness rates of incoming college students are on the rise. That’s partly because of slight improvements in student achievement at the twelfth-grade level, but mostly because of declining college enrollment rates.
***
What to make of all this? To our eyes, these pictures help explain why America’s college matriculation rate is up but its college completion rate is not: We’ve succeeded at motivating more young people to enroll, but we haven’t prepared more of them to succeed at it. All of the higher education reforms in the world—“fixing” remedial education, providing additional supports to students, easing the debt burden, making community colleges “free”—won’t add up to a hill of beans unless our K–12 system gets a lot better at producing young people with the academic skills to succeed once they arrive on campus. (The alternative is to make college easier, which would only diminish the value of completing it.)
Beefing up the effectiveness of the K–12 enterprise is, of course, the aim of ambitious efforts like no-excuses charter schools, the Common Core State Standards, and endeavors to boost teacher effectiveness—all of which deserve support. But it's hard to picture anything on the horizon boosting the college preparedness rate of American twelfth graders above, say, 50 percent any time soon. (Keep in mind that for more than two decades now, it's never been above 40 percent.)
So think about it differently. Another way to make sure that more freshmen are ready for college is to encourage young people who aren’t ready for college to head in different directions. As Charles Murray recently wrote in the Wall Street Journal, “What we need is an educational system that brings children with all combinations of assets and deficits to adulthood having identified things they enjoy doing and having learned how to do them well.” That means taking the “career” half of “college- and career-ready” much more seriously, especially when designing options for high school students.
You may not agree. So what do you make of these data yourself? Let the conversation begin.
Choice and fairness are sometimes cast as values in opposition. This arises from the view that it is unfair to allow some parents to choose their child’s school when others won’t (or can’t). Ultimately, however, choice is the highest form of fairness because it rewards positive behavior and aligns the interests of parents, children, and schools.
This week, I’ll examine the issue from a societal perspective. Next week, I will look at choice from the vantage of the individual family.
Some families can afford private school tuition—often more than $40,000 in New York, and close to that figure in several other major cities. Others move to a suburban district with high property taxes that signify (supposedly) good schools. Some apply to gifted and talented programs. In Brooklyn, we even have a few un-zoned district schools that admit students via lottery. When parents exercise these choices, they are not denounced for acting ‘unfairly.’ The admissions processes of these schools are seldom criticized.
But critics say charter schools that admit kids via lotteries, such as the one my school conducted last week, aren’t fair: We don’t attract enough needy kids, our needy kids aren't needy enough, we don't serve enough special education children, and so on.
As the school’s founder, I spent two years asking parents from across Brooklyn to consider the International Charter School for their kids; I am pleased that many did.
In the week before registration closed, two parents attended our meetings. One mom, who emigrated from Mexico, is unemployed and going through a divorce. Unwilling to send her child to her local elementary school, where just one-quarter of students read at grade level, she applied to seven private schools. Her child was not accepted at any of them. “I’m not poor enough,” she guessed. Luckily, her daughter drew a low number in our lottery and will have the chance to enroll.
Another mom works at a community college and lives in public housing. Her son attends kindergarten at a zoned elementary school in our district. The school’s reputation is improving, yet only 16 percent of the kids currently read at grade level. Her son has a lot of energy; the school says he has ADHD. “But I don't want to medicate him,” she told me. “And I wish his teacher didn't yell at him.” We’ll be able to accept this child, too.
Despite the challenges they and their families face, these parents and 461 others managed to choose ICS. In fact, parents only had to complete a short application that was available on our website twenty-four hours a day; meetings were optional. Parents like these moms invested at least a little time in finding out more and making a choice.
Of course, many others did not. Some might not have agreed with our philosophy and approach. And others, surely, did not get the message—despite fifty meetings in public libraries, bars, hair salons, and community centers. Despite flyers, newspaper ads, Facebook posts, email newsletters, and word of mouth. Despite a city-published school directory and post cards that we mailed to their homes, they did not hear about our free, public school.
Is it unfair that the children of these parents won't have the chance to benefit from our approach? Sure.
To address this challenge, one mom I know proposed that the New York City Department of Education should randomly assign kids to public schools—district and charter—so no one would have to compete for slots. “I want to protect the kids whose parents don’t know they need to act,” she said. That’s a fine and selfless impulse—one that would put paid to the oft-repeated lie that charters cream kids, while addressing the segregation in district schools that is a legacy of real-estate redlining and political gerrymandering.
But is her approach fair? Or fairer?
There’s a human instinct to want to protect people, especially children, from making bad choices. But for choice ultimately to have any value, it must encompass the possibility of making a bad choice—and therefore encouraging us to make good ones.
If large urban districts like New York City had a track record of making excellent educational choices on behalf of their less-advantaged citizens, one might plausibly contend that the government knows best. But as even the most casual reader of education news knows, this is not the case.
Society has a clear interest in producing capable, competent citizens who can perfect our far-too-imperfect democracy. To that end, we collect taxes and mandate that children be educated. Yet evidence increasingly shows that families can’t do worse than bureaucrats in selecting the form and locus of that education.
To students and parents like ours, the inextricable connection of choice and fairness could not be clearer. If parents can move, participate in selective programs, and choose private schools (so long as they first pay their property taxes), then I do not see how we can deny them the right to also choose a charter school. Or not.
Matthew Levey is the executive director of the International Charter School, a Brooklyn elementary school opening this fall. His three children attend New York City public schools.
A core assumption of the education-reform movement is that excellent schools can be engines of upward mobility. But what kind of schools? And to what end?
In tandem with the release of several papers, this path-breaking conference will consider thorny questions, including: Is “college for all” the right goal? (And what do we mean by “college”?) Do young people mostly need a strong foundation in academics? What can schools do to develop so-called “non-cognitive” skills? Should technical education be a central part of the reform agenda? How about apprenticeships? What can we learn from the military’s success in working with disadvantaged youth?
Keynote Address: Hugh Price, Senior Fellow, Brookings Institution “What the Military Can Teach Us About How Young People Learn and Grow”
Here’s a fascinating data point: Did you know that the entire weight of Finnish superiority on international reading tests rests on the shoulders of that country’s girls? The reading scores of Finnish boys on PISA tests is not statistically different than those of American boys, or even the average U.S. student of either sex—that’s how wide the gender gap is in Finland. “Finnish superiority in reading only exists in females,” writes Brookings Institution Senior Fellow Tom Loveless in what is surely the most eyebrow-raising finding in the 2015 Brown Center Report on American Education. “If Finland were only a nation of young men,” he observes, “its PISA ranking would be mediocre.”
That girls outscore boys on reading tests is not news. What is surprising is just how profound and persistent are the gaps. Boys lag girls in every country in the world and at every age, and they have for quite some time. But the gender gap on the 2012 PISA in Finland, the global education superstar, is the widest in the world and twice that of the United States. The sober and precise Loveless can barely restrain himself. “Think of all the commentators who cite Finland to promote particular policies, whether the policies address teacher recruitment, amount of homework, curriculum standards, the role of play in children’s learning, school accountability, or high stakes assessments,” he writes. “Have you ever read a warning that even if those policies contribute to Finland’s high PISA scores…the policies also may be having a negative effect on the 50 percent of Finland’s school population that happens to be male?” Now that you mention it, Tom, no. No I haven’t.
That’s not the only shibboleth the report dismantles. Everybody knows that the best way to improve reading scores is to ensure that kids love to read. Except the data say that’s not true. Loveless’s analysis of PISA results shows no correlation between countries that have raised boys’ reading enjoyment from 2000 to 2009 and those that have raised boys’ reading achievement over the same period of time. So what is the cause of the global gender gap? Is it biology? School practices? Cultural influences? Whatever it is, it appears not to be immutable, since the gap has been shrinking on U.S. NAEP tests. At age nine, it’s less than half of what it was forty years ago. “Biology doesn’t change that fast,” Loveless dryly notes.
And a final mystery, perhaps the most confounding of all: Whatever the cause of the global gender gap in reading in school-aged children, it seems to vanish entirely among adults. After the age of thirty-five, men have statistically higher reading scores; by age 55, men remain stronger readers, even though adult women are nearly twice as likely to be avid readers.
SOURCE: Tom Loveless, “2015 Brown Center Report on American Education: How Well Are American Students Learning?: Part I: Girls, Boys, and Reading,” the Brookings Institution (March 2015).
Part II of the latest Brown Center report is called “Measuring Effects of the Common Core.” Loveless creates two indexes of Common Core State Standards implementation by using data from two surveys of state education agencies. The 2011 index is based on a survey from that year, which reports how many activities—such as conducting professional development or adopting new instructional materials—states had undertaken while implementing the CCSS. “Strong” states are those that pursued at least three implementation strategies. The 2013 index uses survey data asking state officials when they plan to complete CCSS implementation. In this case, “strong” indicates full implementation by 2012–2013.
Analyzing the relationship between survey results and fourth-grade NAEP data for reading, Loveless finds little difference between “strong” states and the four states that never adopted Common Core. According to the 2011 index, strong implementers outscored the four states that didn’t adopt the Common Core by a little more than a scale point between 2009 and 13 (yet the small comparison group makes for less reliable findings). Strong states did a bit better relative to the 2013 index, but still outdid non-implementers by less than two NAEP points.
More interesting than these preliminary correlation studies, however, is a finding about how often reading teachers utilize fictional texts in fourth-grade classrooms. In 2013, fourth-grade teachers in strong implementation states who say they use fiction “to a great extent” exceed the portion who say the same about nonfiction by 12 percentage points—yet that is down from 23 percentage points in 2009, mostly due to an increased use of nonfiction. Even non-adoption states showed a decline of 9.8 percentage points during that time. One might take from this that the Common Core standards, with their emphasis on increased nonfiction reading, are having an instructional impact regardless of whether states have officially adopted them or not.
Loveless rightly notes that studying the impact of CCSS at the state level will continue to be challenging as politics, finances, and other concerns alter the status of implementation. As with so many things, one’s interpretation of these results likely depends on one’s view of CCSS, meaning that folks can look at these data and say, “That’s a promising step”—or, “That’s really disappointing.”
SOURCE: Tom Loveless, “2015 Brown Center Report on American Education: How Well Are American Students Learning?: Part II: Measuring Effects of the Common Core,” the Brookings Institution (March 2015).
Brown Center reports on the state of American education are characteristically lucid and informative as well as scrupulously research-based—and they sometimes venture into unfamiliar but rewarding territory. That's certainly the case with the third section of the latest report, which addresses "the intensity with which students apply themselves to learning in school."
Drawing on PISA data (i.e., fifteen year olds), this is an exceptionally timely probe into one of the key temperamental, attitudinal, behavioral, or characterological traits (take your pick of which category it fits best) that may influence both short-term school performance and long-term success. Many people—perhaps taken with the recent attention that's been lavished on student attributes like "grit"—would say, “Of course there's a powerful influence. Why is the matter even worth restating?” But Loveless shows us why, beginning by noting the highly uncertain link between engagement and achievement, at least as both are gauged by PISA, and demonstrating that some countries that best the United States in achievement lag behind us in engagement.
He explains the importance of the "unit of analysis" in all such studies, then goes on to pull PISA's four-part measure of "intrinsic motivation" into its constituent parts and closely examine each of these. And as we accompany him deeper into the issue, it becomes ever clearer that one ought not assume that a higher rating on "intrinsic motivation," at least when applied at the national level, correlates with a country's academic showing.
"Taken together," Loveless writes, “the analyses lead to the conclusion that PISA provides, at best, weak evidence that raising student motivation is associated with achievement gains." Indeed, it may "even produce declines." But the real target of Loveless's findings is the simplistic view that "programs designed to boost student engagement," however worthy they may be for other reasons, can be counted upon to raise achievement. Since they cannot, they do not deserve to be promoted as universal policy nostrums for achievement-hungry lands. Most definitely something to ponder.
SOURCE: Tom Loveless, “2015 Brown Center Report on American Education: How Well Are American Students Learning?: Part III: Student Engagement,” the Brookings Institution (March 2015).