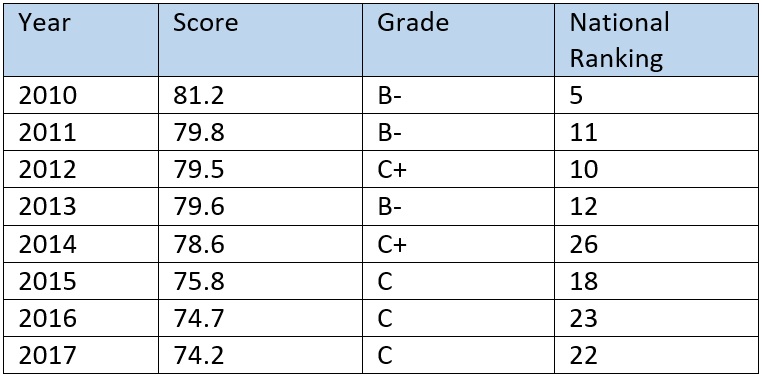
Education Week just issued its twenty-first “Quality Counts” report card for states. Ohio’s grades are so-so—and nearly identical to last year’s. Yet with a “C” overall and ranking twenty-second nationally, the Buckeye State’s standing relative to other states has fallen dramatically since 2010 when it stood proud at number five.
Ohio’s slide in EdWeek’s Quality Counts ranking has become easy fodder for those wishing to criticize the state’s education policies. Those on the receiving end of blame for Ohio’s fall have included: Governor Kasich (and the lawmakers who upended former Governor Strickland’s “evidence-based” school funding system), Ohio’s charter schools (never mind that nothing whatsoever in the EdWeek score cards takes them into consideration!), and even President Obama (specifically for his 2009 Race to the Top program). I’ve lost track of the number of times I’ve heard or read that Ohio’s plummeting ranking is incontrovertible evidence of things gone awry.
An almost-twenty slot drop in rankings sounds terrible, but my guess is that many people who lament it don’t know what the ratings comprise or that EdWeek’s indicators have changed over time. Let’s take a look at the overall rankings, and then take a deeper dive into changes to Ed Week’s report card to help explain Ohio’s decline.
Table 1 shows Ohio’s performance on the Quality Counts assessment from 2010 to 2017. Ohio’s national ranking and points earned have slipped since 2010 (used here as a starting point as it represents the high-water mark for the state on this particular report card), even while its grade continues to hover in the B-minus to C range.
Table 1: Ohio scores on Education Week’s Quality Counts report card

The 2017 report card is based on three sub-categories.
- Chance for Success—a measure that includes educational inputs and outputs across the life span, such as family income, parent educational levels, preschool and kindergarten enrollment, fourth- and eighth-grade NAEP scores, and adult educational attainment.
- K-12 Achievement—looks at student performance on the National Assessment of Educational Progress (NAEP), graduation rates, and percent of students scoring 3 or above on AP exams, as well as gaps in NAEP proficiency between poor and non-poor students.
- School Finance—a measure that includes state funding systems’ reliance on local property wealth as well as other measures of equity, per pupil expenditures, and share of taxable resources spent on K-12 education.
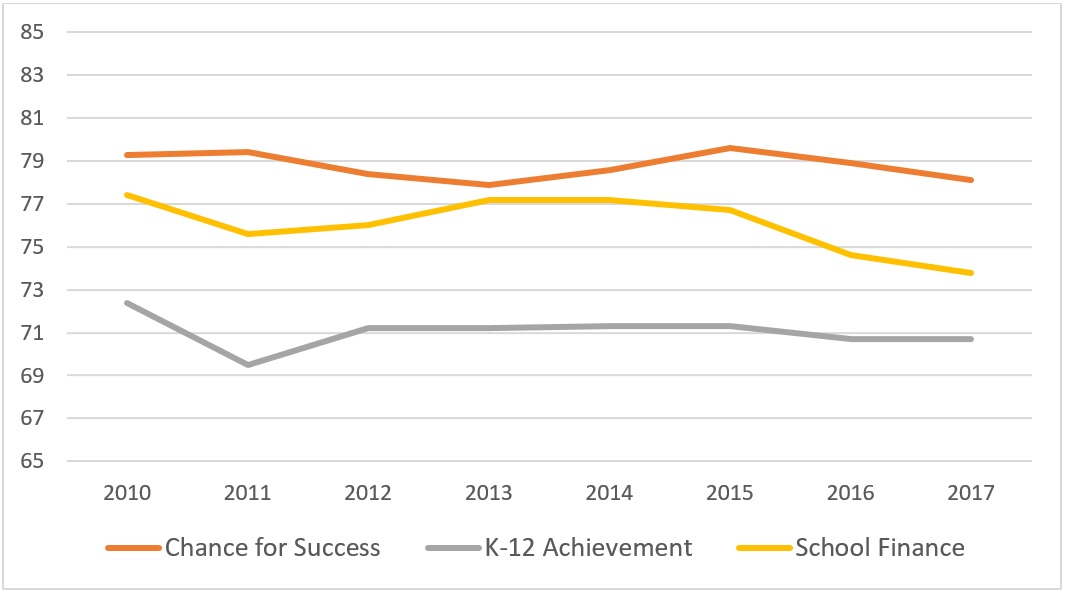
Graph 1: Ohio’s Quality Counts sub-scores, 2010-2017 (three categories)

As Graph 1 depicts, Ohio’s sub-scores are largely flat. Chance for Success dropped by one point in the last eight years; K-12 Achievement fell by less than two points; and School Finance three and a half points. So why has Ohio’s overall rank suffered so greatly?
There are at least two reasons behind Ohio’s fall from fifth that have nothing to do with its actual performance. The first is the change in composition of the report cards and the other has to do with national context.
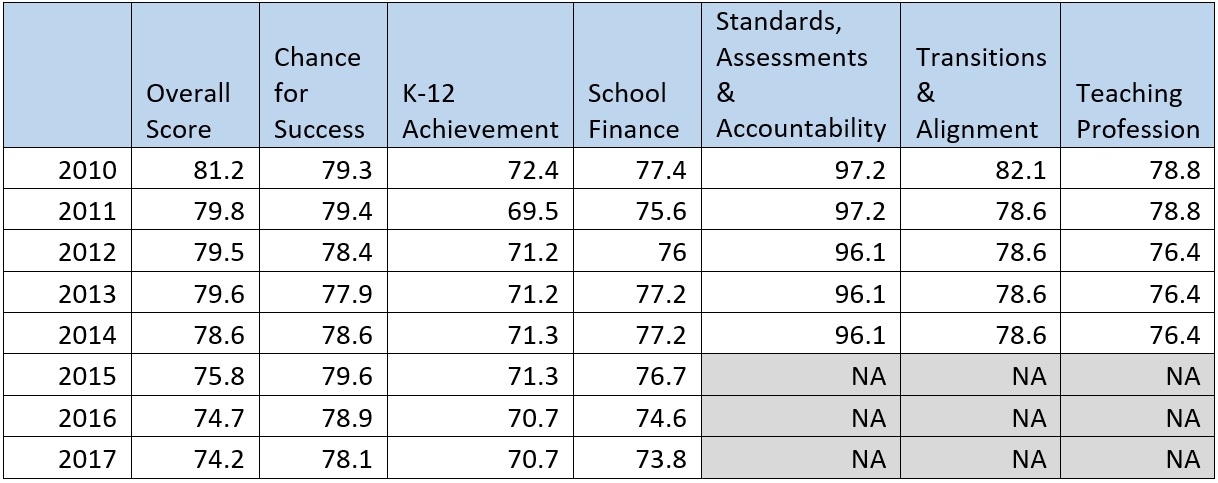
Prior to 2014, Education Week graded states in six categories instead of three. Two of these—“Standards, Assessments, and Accountability” and “Transitions and Alignment”—were among Ohio’s top-rated categories, with Standards the only category in which Ohio ever received an A. Table 2 below makes clear that the shift to just three categories in 2015 essentially knocked out Ohio’s highest-rated components, causing an overall decline in its score. Indeed, the largest single-year drop occurred between 2014 and 2015 when Quality Counts was downsized.
Table 2: Ohio’s sub-scores on Education Week’s Quality Counts report card (0-100)

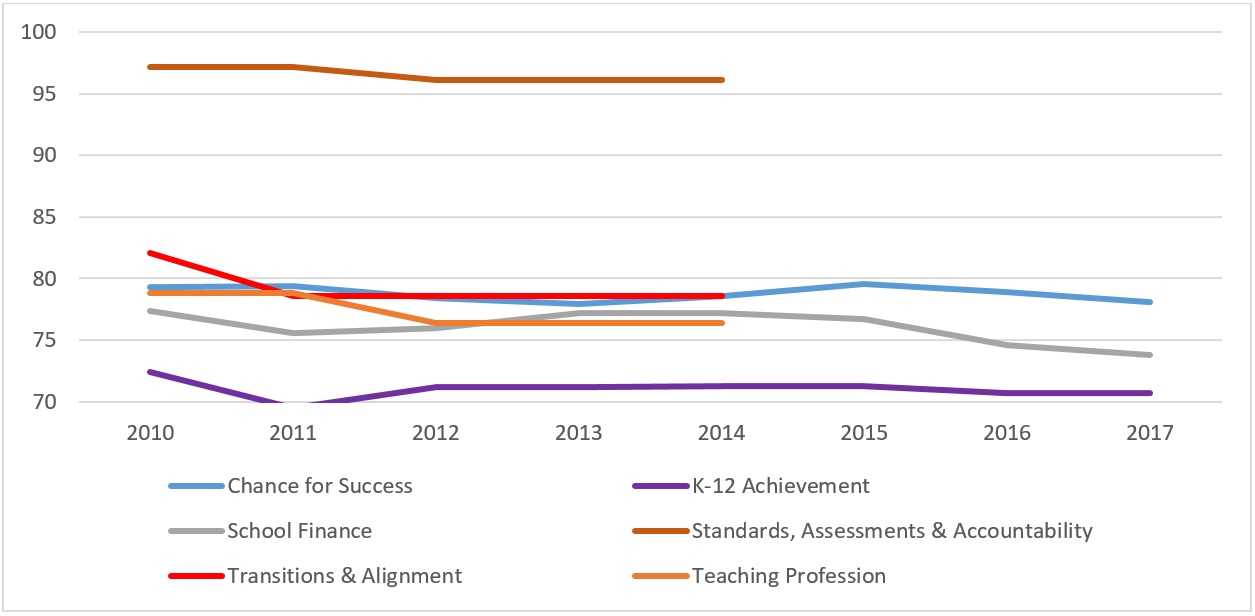
Graph 2 includes all of Ohio’s sub-scores over time, including the three that were removed from the report card (shown in red and oranges below).
Graph 2: Ohio’s Quality Counts sub-scores, 2010-2017 (six categories)

The change in EdWeek’s report card at least partially explains Ohio’s decline in score as well as rank over the decade. Still, readers might wonder why Ohio dropped so suddenly from twelfth to twenty-sixth in 2014—a year before Standards, Assessments, and Accountability (and the other metrics) were removed. That brings us to the second reason for Ohio’s change in relative rankings, which likely had less to do with what Ohio did or didn’t do, and more to do with what happened in other states. The Buckeye State was an early adopter of Common Core state standards and aligned assessments, voting to adopt them in 2010. And as a Race to the Top winner the same year, it was ahead of the pack in adopting new statewide teacher evaluation systems (a component of the old “Teaching Profession” category). It is unsurprising that Ohio as an early adopter of reform earned high marks on these measures.
Ohio’s fourteen-slot fall between 2013 and 2014 very likely resulted from the changes rapidly occurring in other states that earned them extra points Ohio already had under its belt. Other states adopted and implemented the Common Core, tougher assessments, and teacher evaluation systems—all of which boosted their scores. Ohio’s actual score only dropped by a point the year its ranking plummeted. Conversely, its score fell three times as much the following year (2015) while its ranking rose by eight slots. The lesson here is that relative rankings are just that—relative.
Table 3: Ohio’s dramatic ranking shifts from 2013-2015

Resorting to broad generalizations about Ohio education based solely on the national Quality Counts report card is misinformed at best and intellectually dishonest at worst. Even so, much of the Quality Counts metrics are valuable and can help inform policy priorities. Ohio’s poor showing for NAEP achievement gaps by income; preschool and kindergarten enrollment; funding equity; and adult educational attainment should be especially concerning to us. Ohio leaders wanting the state to compete as a thriving place of opportunity for families should keep close tabs on these metrics, always pushing for ways to move the needle. What they shouldn’t do is pay attention to hyperbolic claims about the demise of our state—at least, not based on this particular report card.


