There are many fascinating pieces of information you can gleam from the Fordham Institute’s new Metro D.C. School Spending Explorer website, most especially estimates of per-pupil expenditures at each inside-the-Beltway public school. But did you know that you can also learn about the relative wealth of each school’s attendance zone? Once you get to the site, plug in the name of a school and click on “Household Income.” (See below for an explanation of our methodology.)
I was curious about the wealthiest attendance zones in the area; they are printed below. I just looked at elementary schools, since their zones are smaller. We were not able to do the analysis for the District of Columbia. (Maybe a handful of west-of-the-park D.C. schools would have made the list, but I doubt it, thanks to the preponderance of apartment buildings in their attendance zones.)
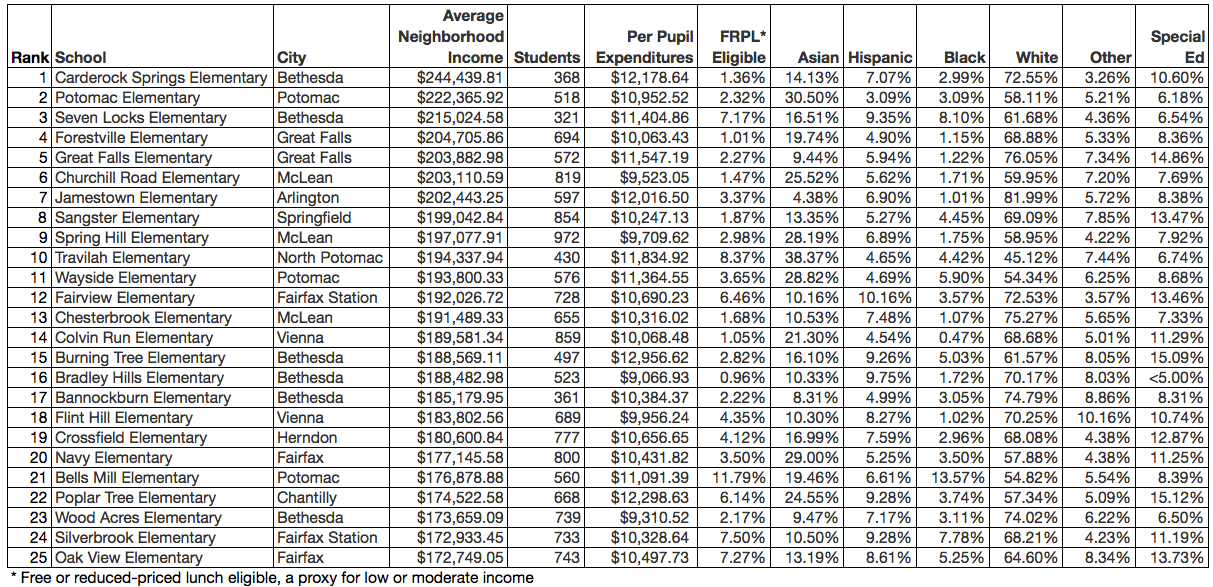
The twenty-five richest elementary schools in the Washington suburbs
(Click here for more information on each school)
School | City | Average Neighborhood Income | Students | Per Pupil Expenditures |
Carderock Springs Elementary | Bethesda | $244,439.81 | 368 | $12,178.64 |
Potomac Elementary | Potomac | $222,365.92 | 518 | $10,952.52 |
Seven Locks Elementary | Bethesda | $215,024.58 | 321 | $11,404.86 |
Forestville Elementary | Great Falls | $204,705.86 | 694 | $10,063.43 |
Great Falls Elementary | Great Falls | $203,882.98 | 572 | $11,547.19 |
Churchill Road Elementary | McLean | $203,110.59 | 819 | $9,523.05 |
Jamestown Elementary | Arlington | $202,443.25 | 597 | $12,016.5 |
Sangster Elementary | Springfield | $199,042.84 | 854 | $10,247.13 |
Spring Hill Elementary | McLean | $197,077.91 | 972 | $9,709.62 |
Travilah Elementary | North Potomac | $194,337.94 | 430 | $11,834.92 |
Wayside Elementary | Potomac | $193,800.33 | 576 | $11,364.55 |
Fairview Elementary | Fairfax Station | $192,026.72 | 728 | $10,690.23 |
Chesterbrook Elementary | McLean | $191,489.33 | 655 | $10,316.02 |
Colvin Run Elementary | Vienna | $189,581.34 | 859 | $10,068.48 |
Burning Tree Elementary | Bethesda | $188,569.11 | 497 | $12,956.62 |
Bradley Hills Elementary | Bethesda | $188,482.98 | 523 | $9,066.93 |
Bannockburn Elementary | Bethesda | $185,179.95 | 361 | $10,384.37 |
Flint Hill Elementary | Vienna | $183,802.56 | 689 | $9,956.24 |
Crossfield Elementary | Herndon | $180,600.84 | 777 | $10,656.65 |
Navy Elementary | Fairfax | $177,145.58 | 800 | $10,431.82 |
Bells Mill Elementary | Potomac | $176,878.88 | 560 | $11,091.39 |
Poplar Tree Elementary | Chantilly | $174,522.58 | 668 | $12,298.63 |
Wood Acres Elementary | Bethesda | $173,659.09 | 739 | $9,310.52 |
Silverbrook Elementary | Fairfax Station | $172,933.45 | 733 | $10,328.64 |
Oak View Elementary | Fairfax | $172,749.05 | 743 | $10,497.73 |
Nothing on this list should be terribly surprising—save for the eye-popping numbers on average household income. These schools are overwhelming populated by white and Asian middle-class and upper-middle-class students. Still, some of the variation is interesting, particularly when it comes to the percentage of students classified as special-education (from a low of 6 percent to a high of 15 percent). And a handful of the schools—such as Bells Mill in Potomac—at least have some degree of socio-economic diversity.
Several years ago, Janie Scull and I identified several thousand of what we called “private public schools”—public schools that serve virtually no poor students. This is another way at looking at that phenomenon—public schools that are “public” only for families who can buy extremely expensive real estate.
Take Carderock Springs Elementary in Bethesda. The average income of households in its attendance zone is almost $250,000 per year. Is this school really more “public” than an inner-city Catholic school serving poor minority children? The public spends $12,000 per child on the former and $0 per child on the latter. Tell me again why that’s fair?
Methods
Income data were calculated by Fordham’s Matt Richmond using 2010 U.S. Census Bureau data on household income and geographic data on school catchment areas (obtained from each district's central office). To estimate household income for each school, we calculated the overlap between the school's catchment area and each census tract. Household income data were then weighted based on the percentage of the catchment area covered by each tract and then averaged.
