
The competition for Race to the Top–District (RTTT-D) grants was fierce, with 372 applications representing 1,189 districts (of about 14,000 total in the U.S.). After whittling these down to sixty-one finalists, the U.S. Department of Education selected sixteen winners. Among these were two consortia of rural districts, three charter-management organizations, and just one large district (Miami-Dade). But when we took a closer look at the districts that opted to apply in the first place, a picture of union influence emerged.
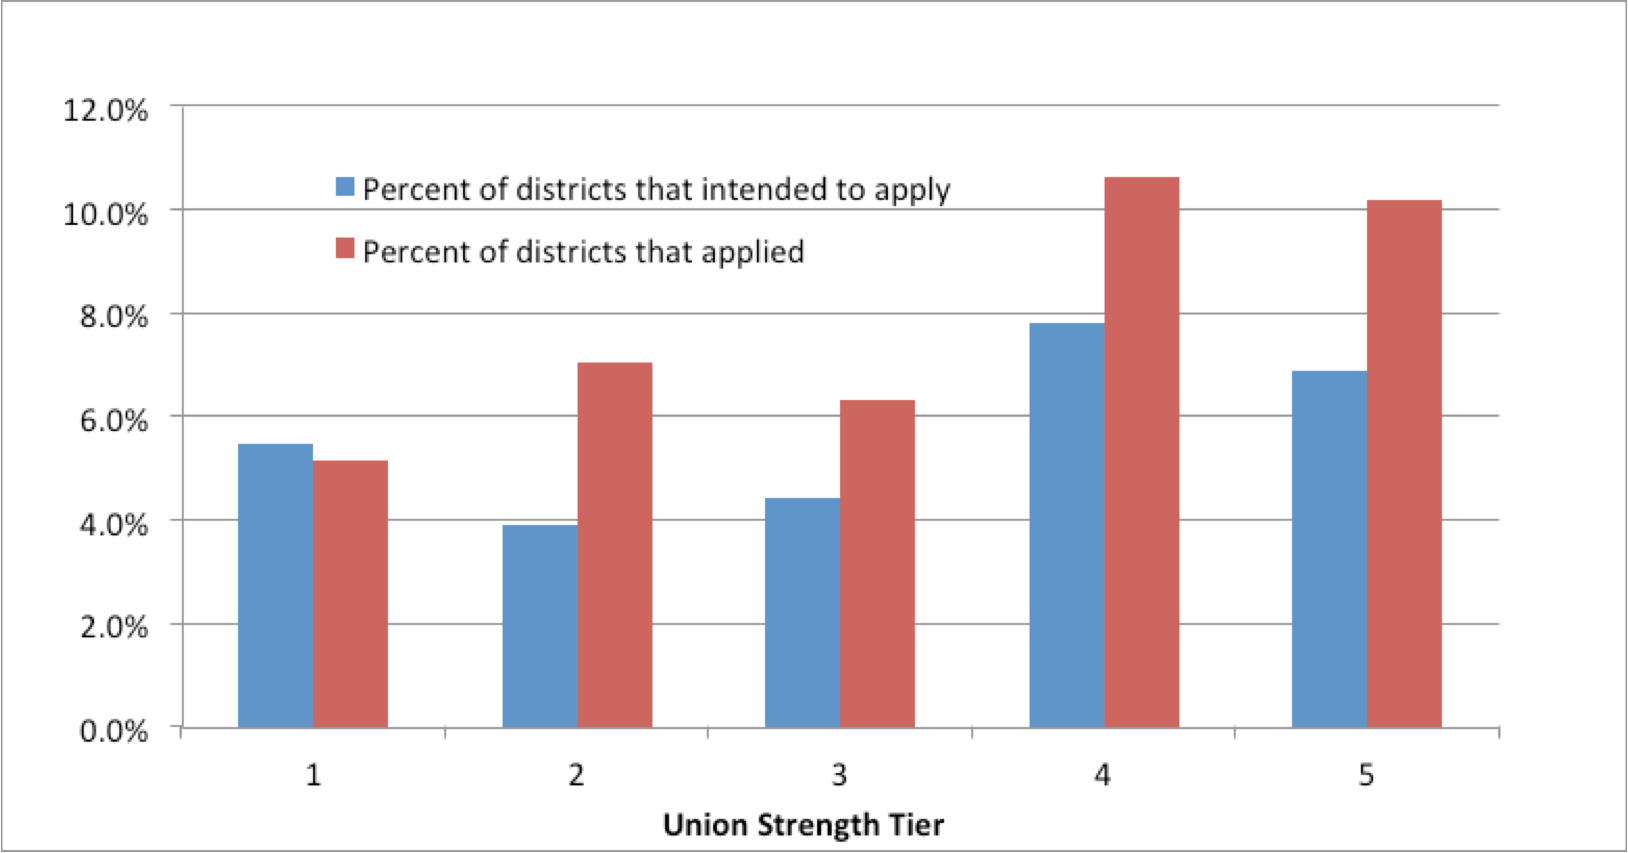
There were fewer applications from districts in states with stronger unions than from districts whose unions are weaker. While 10.2 percent of districts from states with the weakest unions applied to the program, only 5.2 percent of districts from states with the strongest ones did the same.* And though other factors (such as geographic location and the political leanings of the states) may explain some of the variation in application rates, it does seem like states with weaker unions had more opportunity to apply.
This opt-in bias stemmed from one condition of the 2012 RTTT-D competition: applicants must have union support in order to participate. And there are several examples of this stipulation deterring districts from applying. Other districts, such as Glendale Unified and L.A. Unified, each had their applications dismissed because they could not procure the required signature from a union official. Elsewhere, union leaders expressed concern that the RTTT grants would commit districts to use student performance data in teacher evaluations.
In addition to the link between states that applied and the power of their unions, there was also a strong correlation between union power and the percentage of districts that had indicated their “intent to apply” back in August. States with weak unions saw an application rate 48 percent higher than the portion of districts that had previously indicated their intent to apply. In states with the strongest unions, however, the eventual application rate was actually 5 percent lower than the portion of schools that had intended to apply. In short, districts from states with the strongest unions may have had a tougher time completing their RTTT applications.
 |
|
Still, it appears that union strength did not factor into every stage of the competition. Of districts that applied for RTTT-D, there seemed to be little correlation between union strength and selection of finalists: |
 |
For better or worse, the union sign-off requirement of Race To the Top appears to have disadvantaged districts in strong-union states. But are all districts with strong, resistant unions really incapable of change? In the end, it seems unproductive to mandate that all unions and district officials work together—to do so ignores the political reality that, despite effective district planning, many unions act inordinately in their own self-interest. Instead, the Department of Education ought to consider replacing the union-signature requirement with a letter allowing unions to give input on the application. Then, rather than providing carte blache veto power to unions, the DOE could consider union concerns with respect to each district’s unique political landscape. Ultimately, short of reducing the strength of unions, it might be better to succeed at promoting dialogue than to fail at forcing cooperation. |
* To check this hypothesis, I used union strength rankings from Fordham’s recent large-scale analysis How Strong are U.S. Teacher Unions? The October 2012 study used several factors to rank states’ union strength (including resources and membership, perceived influence, and involvement in politics) and grouped states into five “tiers,” with Tier One capturing the ten states with the strongest unions and Tier Five capturing the ten states with the weakest.
