

Mobile Navigation

  • National
    • Policy
      • High Expectations
      • Quality Choices
      • Personalized Pathways
    • Research
    • Commentary
      • Gadfly Newsletter
      • Flypaper Blog
    • Events
    • Scholars Program
  • Ohio
    • Policy
      • Priorities
      • Media & Testimony
    • Research
    • Commentary
      • Ohio Education Gadfly Biweekly
      • Ohio Gadfly Daily
  • Charter Authorizing
    • Application
    • Sponsored Schools
    • Resources
  • About
    • Mission
    • Board
    • Staff
    • Career
Home
Home
Advancing Educational Excellence

Main Navigation

  • National
  • Ohio
  • Charter Authorizing
  • About

National Menu

  • Topics
    • Accountability & Testing
    • Advanced Education
    • Career & Technical Education
    • Charter Schools
    • Curriculum & Instruction
    • ESSA
    • Evidence-Based Learning
    • Facilities
    • Governance
    • Personalized Learning
    • Private School Choice
    • School Finance
    • Standards
    • Teachers & School Leaders
    • Think Again
  • Research
  • Commentary
    • Gadfly Newsletter
    • Flypaper Blog
    • Gadfly Podcast
  • Events
  • Scholars Program
Flypaper

Six headlines from 2015 NAEP TUDA

Six headlines from 2015 NAEP TUDA
11.9.2015

I spent a few hours digging into the recently released 2015 NAEP TUDA data. The results didn’t get much media coverage. That’s a shame because these are the best assessments for understanding student performance in (and comparing the results of) America’s biggest urban districts.

It’s a treasure trove of information, and it tells hundreds of stories. I encourage you to get into the numbers and see what pops for you.

I tried to condense my big takeaways into six headlines and images.

1. We’ve been trying to improve urban districts for half a century. These are the results. No district is able to get even one in five black kids up to proficiency in eighth-grade math or reading.
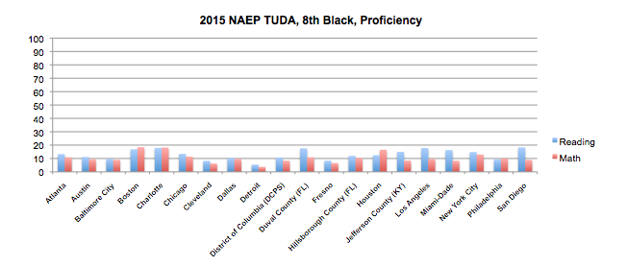
2015 NAEP TUDA, 8th Black, Proficiency

2. Across the participating districts, there has been meager progress in both subjects and both grades for more than a decade.
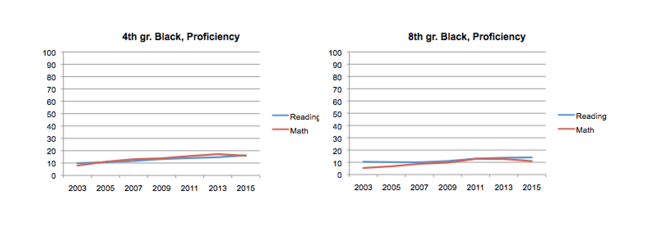
4th Grade Black, 8th grade Black, Proficiency

3. A few districts, however, have made gains over time, most notably Atlanta, Chicago, D.C., and Los Angeles. They deserve credit.
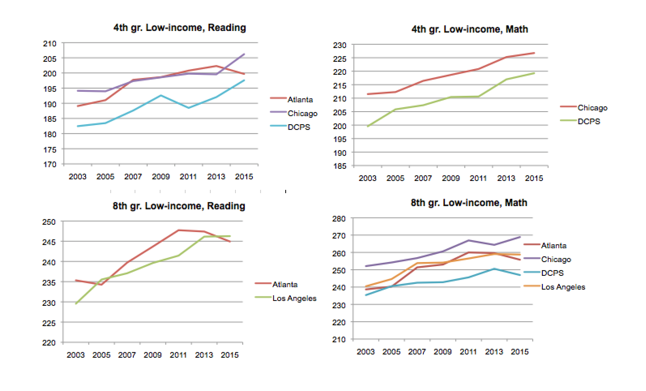
Atlanta, Chicago, DC and LA gains

4. Instances of progress deserve attention because progress is not guaranteed. For example, several districts have made virtually no headway in eighth-grade reading among low-income kids.
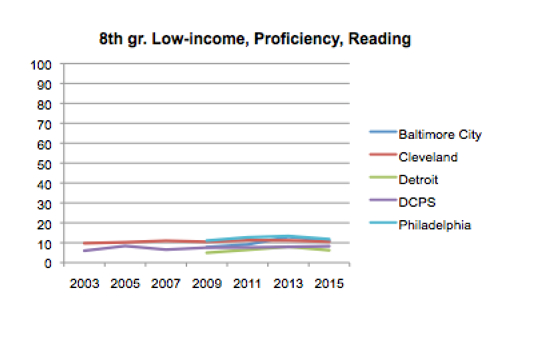
8th grade proficiency, Reading Low income

5. The districts that have made the most progress are the ones that started the farthest behind a decade ago. So despite consistent progress, Atlanta, Chicago, D.C., and Los Angeles are either at or still below the performance of the average large urban district. 
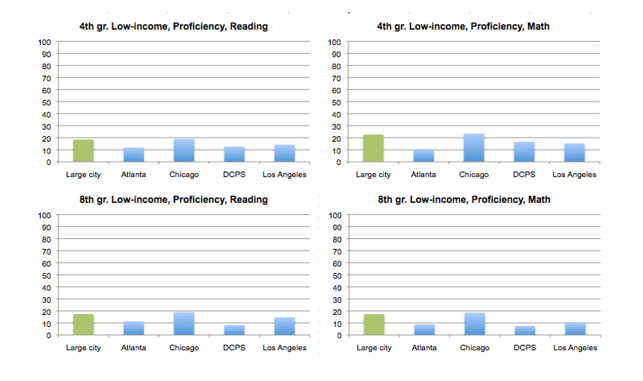
Atlanta, Chicago, DC and LA proficiency charts

6. It is essential when looking at NAEP TUDA data to always disaggregate the results (hence my focus above on black and low-income kids). The achievement gap in urban districts is larger than the achievement gap in the rest of the nation. White and non-poor students in urban districts are generally high-performing. Their results can skew citywide results.
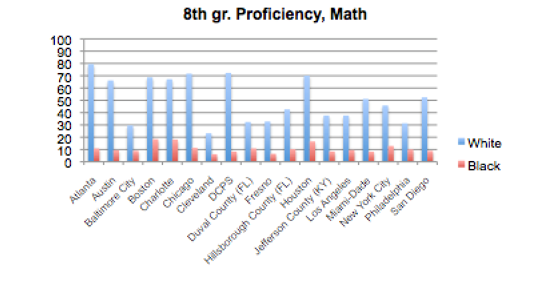
8th grade Proficiency Math

LuckyBusiness/iStock/Thinkstock

Tags: Atlanta Chicago National Assessment of Educational Progress
Fordham Logo

© 2026 The Thomas B. Fordham Institute
Privacy Policy
Usage Agreement

National

P.O. Box 110
Burke, VA 22009

202.223.5452

[email protected]

Ohio

P.O. Box 82291
Columbus, OH 43202

614.223.1580

[email protected]

Sponsorship

130 West Second Street, Suite 410
Dayton, Ohio 45402

937.227.3368

[email protected]