Today, the ratings bubble burst for Ohio’s schools and districts. With rising standards associated with the state’s New Learning Standards and next-generation assessments now fully in place, as expected, student proficiency rates fell throughout Ohio. Correspondingly, school ratings declined as well. This much-needed reset of academic expectations will better ensure that parents and the public have an honest gauge of how students and schools are performing.
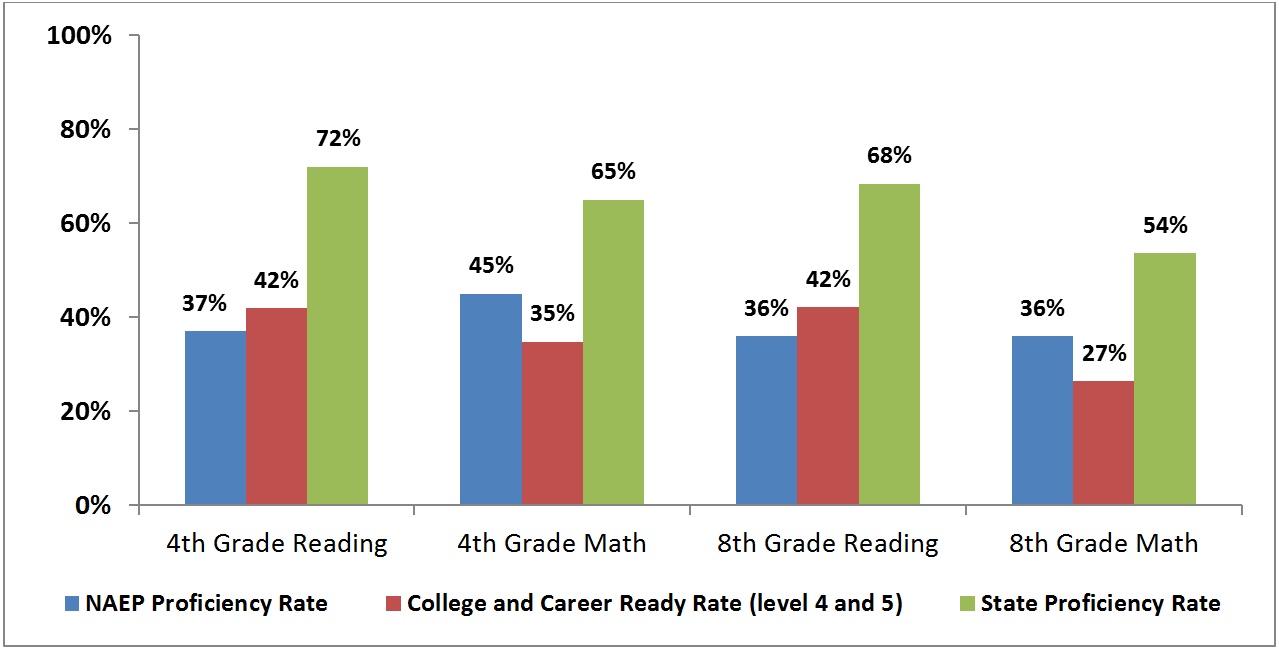
Still, state policymakers have work ahead to guarantee that parents and the public gain the clearest possible picture of students’ college and career readiness. Based on 2014-15 test results, roughly 55 and 70 percent of Ohio students were deemed “proficient” depending on the grade and subject. While these proficiency rates are indeed a more accurate gauge of achievement than in previous years—when Ohio regularly labeled more than 80 percent of students as proficient—the number of students meeting rigorous academic benchmarks continues to be overstated.
When utilizing a more demanding standard for achievement, state testing data indicate that between 30 and 45 percent of students statewide are on track for college and career success. These achievement rates—the percentage of students reaching Ohio’s advanced and accelerated levels—better match the Ohio’s proficiency results on NAEP, the best indicator of achievement nationally.
“Policymakers across the nation are ratcheting up academic expectations. To their credit, Ohio leaders have also implemented tougher standards and assessments,” said Aaron Churchill, Ohio Research Director for the Fordham Institute. “But policymakers are only halfway up the mountain. To help complete the job, they must raise the cut score for student proficiency, while ensuring a rating system that fairly portrays school performance.”
Chart: Statewide student achievement on 2015 NAEP and 2014-15 state exams

The well-documented achievement gap between historically disadvantaged pupils and their peers continues to persist. In Ohio’s distressed communities, an alarmingly low number of pupils met the college and career ready benchmarks in 2014-15—in some cases, lower than 25 percent. In both urban charter and district schools, student achievement tends to lag behind students statewide.
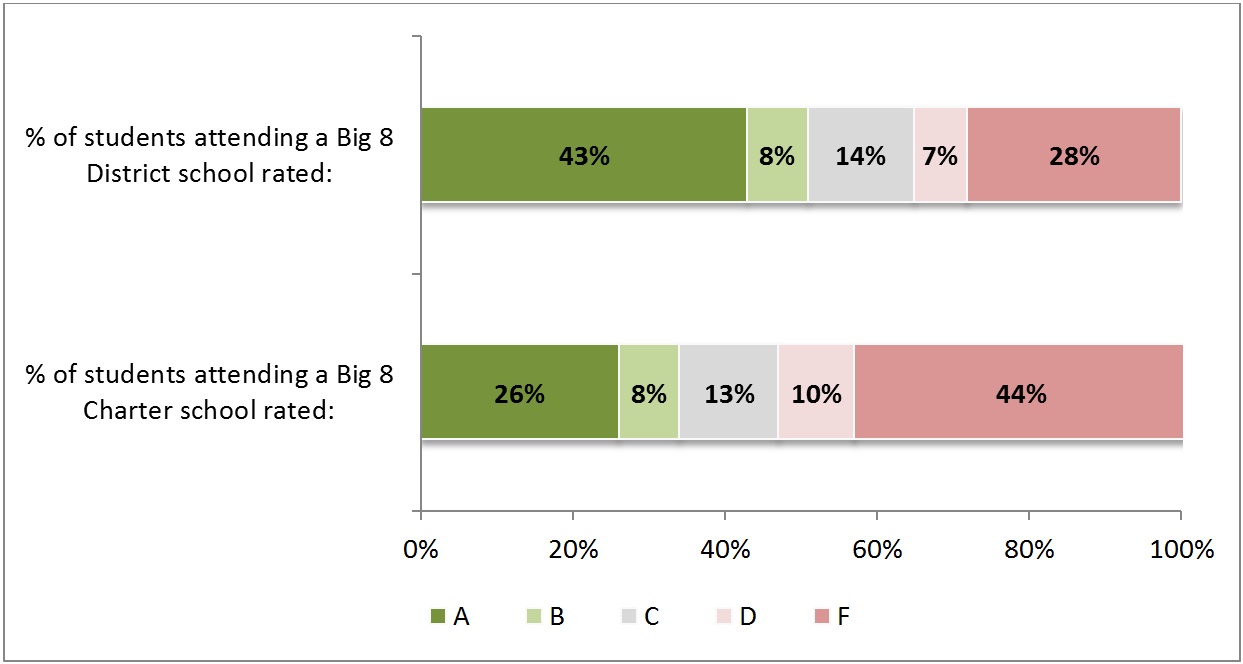
When examining Ohio’s value added results—an indicator of a school’s contribution to individual students’ growth, separate of non-school factors—we see roughly two in five students in the Big Eight area attend a school that earned an A on value added. While this does not suggest students in such schools are making large enough gains to close the gap immediately, it does indicates that a fair number of high-poverty schools are helping students make gains that, if accumulated over their grade-school career, would put them back on a surer academic track.
“State policymakers have rightly focused ample attention on low-performing urban schools, and decisive action must be taken when schools—district and charter alike—persistently fail to demonstrate acceptable results,” said Aaron Churchill. “But we shouldn’t overlook exemplary high-poverty schools. In the charter-school realm, Ohio’s recent win of a federal charter grant should help top-notch schools replicate to serve even more students in tremendous need of an excellent education.”
Chart: Students attending charter and district schools in the urban Big Eight, by value-added rating

Note: Only brick-and-mortar charters with value-added ratings and located in the county of a Big Eight city are included in this chart. E-schools were not included as they draw students from many districts statewide. The value-added results for Toledo school district were excluded, since its schools have not yet received a rating.
For ongoing analysis on the state’s report card results, please visit www.edexcellence.net/ohio-policy and stay tuned for a more comprehensive report to be published in early March.


