Mobile Navigation

  • National
    • Policy
      • High Expectations
      • Quality Choices
      • Personalized Pathways
    • Research
    • Commentary
      • Gadfly Newsletter
      • Flypaper Blog
    • Events
    • Scholars Program
  • Ohio
    • Policy
      • Priorities
      • Media & Testimony
    • Research
    • Commentary
      • Ohio Education Gadfly Biweekly
      • Ohio Gadfly Daily
  • Charter Authorizing
    • Application
    • Sponsored Schools
    • Resources
  • About
    • Mission
    • Board
    • Staff
    • Career
Home
Home
Advancing Educational Excellence

Main Navigation

  • National
  • Ohio
  • Charter Authorizing
  • About

Ohio Menu

  • Topics
    • Accountability & Testing
    • Advanced Education
    • Career & Technical Education
    • Charter Schools
    • Curriculum & Instruction
    • ESSA
    • Evidence-Based Learning
    • Governance
    • Personalized Learning
    • Private School Choice
    • School Finance
    • Standards
    • Teachers & School Leaders
  • Research
  • Policy
  • Commentary
    • Ohio Gadfly Newsletter
    • Ohio Gadfly Blog
    • Events

The Education Gadfly Weekly

Sign Up to Receive Fordham Updates

We'll send you quality research, commentary, analysis, and news on the education issues you care about.
Thank you for signing up!
Please check your email to confirm the subscription.

Ohio Gadfly—The truth about the “state share” of school funding

Volume 20, Number 17
8.25.2026
8.25.2026

Ohio Gadfly—The truth about the “state share” of school funding

Volume 20, Number 17
view
20 mill floor blog image
School Funding

The “state share” of school funding and the 20 mill property tax floor

Media coverage will have you believe that the state is “starving” Ohio school districts of money. That is far from the truth, which a proper understanding of the education funding system reveals.

Aaron Churchill 8.25.2026
OhioOhio Gadfly Daily

The “state share” of school funding and the 20 mill property tax floor

Aaron Churchill
8.25.2026
Ohio Gadfly Daily

Ohio takes its eye off the teacher shortage ball

Jessica Poiner
8.24.2026
Ohio Gadfly Daily

Ohio explores improvements to its statewide assessment

Jessica Poiner
8.19.2026
Ohio Gadfly Daily

Digging into the findings of The American Teenagers Survey

Jeff Murray
8.25.2026
Ohio Gadfly Daily

Expanded review process for determining school quality leads to minimal improvement

Jeff Murray
8.20.2026
Flypaper

The Next Chapter: Ohio’s implementation of the science of reading—and where to next

8.18.2026
Report
view
Teacher pipeline blog image

Ohio takes its eye off the teacher shortage ball

Jessica Poiner 8.24.2026
Ohio Gadfly Daily
view
SB 276 analysis blog image

Ohio explores improvements to its statewide assessment

Jessica Poiner 8.19.2026
Ohio Gadfly Daily
view
Teen survey data SR image

Digging into the findings of The American Teenagers Survey

Jeff Murray 8.25.2026
Ohio Gadfly Daily
view
Teacher observation

Expanded review process for determining school quality leads to minimal improvement

Jeff Murray 8.20.2026
Flypaper
view
Next Chapter SoR report image - Getty Images/ValerioGalli

The Next Chapter: Ohio’s implementation of the science of reading—and where to next

Aaron Churchill 8.18.2026
Report
view
20 mill floor blog image

The “state share” of school funding and the 20 mill property tax floor

Aaron Churchill
8.25.2026
Ohio Gadfly Daily

Ohio’s school districts receive and spend more money than ever before. Hard to believe, given headlines about “starving” public schools, but it’s true.

In fiscal year 2025, public schools spent on average $16,976 per student, or 17 percent above spending in 2013 (adjusted for inflation). In urban districts such as Columbus and Cleveland, spending exceeded $25,000 per pupil—amounts that we’re more accustomed to seeing in high-tax coastal states like New Jersey and New York. Even in some rural areas of Ohio, spending has passed the $20,000 mark: $20,449 per pupil in Zanesville, $20,479 in Lima, and $23,609 in Mansfield.

But none of this has stopped the public school establishment from clamoring for more money—billions more. In their bid for more funding, they have pushed a narrative of state “disinvestment” in public education. In one press release, picked up by a major news outlet, district officials claimed that the “state’s share of K–12 school funding has fallen to a historic low near 32 percent.”

The statistic is pure deception. As discussed in an earlier piece, the 32 percent “state share” refers to an obscure mechanism inside the funding formula, not the actual percentage of funding provided by the State of Ohio versus the amounts raised locally. When accounting for all state funds for school districts, the true “state share” was 44 percent in 2024–25, which is in line with historic norms.

But even this percentage (44 percent) understates the true role of state government in financing public education. One policy that often goes unacknowledged by critics is the state-required minimum local property tax. While not officially “state revenue,” these dollars are guaranteed under state law and remain an essential element of districts’ foundation funding. But what exactly is this indirect form of state aid and how much does it generate for districts?

Under Ohio law, school districts must maintain a property tax rate of at least 20 mills (or 2 percent) to receive state formula funding. In essence, the provision guarantees that all Ohio districts receive baseline local tax support, as districts can remind voters they must approve this minimum tax rate, lest they forfeit millions in state aid. Furthermore, state law establishes a millage floor at 20 mills to protect districts from having their tax rates reduced below this mark due to tax reduction factors—longstanding state policies that shield citizens from tax hikes due to property inflation.  

Taken together, these state laws establish a minimum local tax effort. In practice, every district today levies at least 20 mills of property tax, with many districts taxing at rates above the floor with voter approval. Because districts generate widely varying sums based on their property base, Ohio’s progressive funding formula sends more “direct” state aid to property-poorer districts (and less to wealthier ones).[1] Public charter schools and private schools receive zero local tax revenues,[2] so the state itself shoulders full responsibility for funding these options.

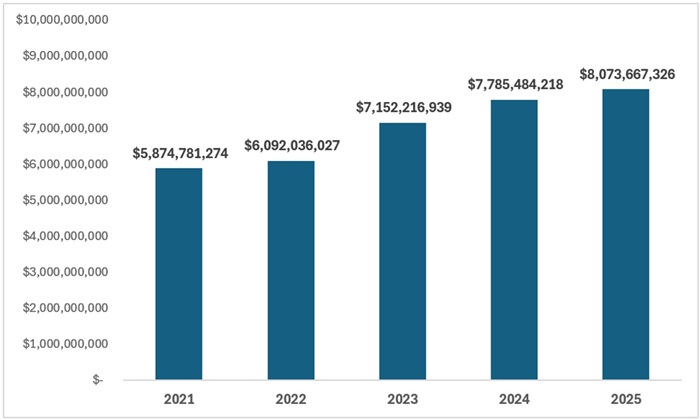
How do the 20 mills translate into dollars and cents? As Figure 1 shows, the minimum tax requirement generated $8.1 billion for school districts in 2025, or $5,514 per student. This is well above the $5.9 billion collected through the 20 mills in 2021—a reflection of rapidly increasing property values as well as property development.[3] In percentage terms, district revenues from the 20 mills rose by 37.4 percent from 2021 to 2025, more than doubling the general inflation rate (up 16.1 percent, as measured by CPI).

Figure 1: Funds received by Ohio school districts via state-required 20 mill property tax

20 mill floor blog figure 1
Source: Author calculations based on the Ohio Department of Taxation SD-1 reports for CY2021 to 2025. Notes: Dollars are not inflation-adjusted. Amounts include revenues generated on both class I (agricultural and residential) and class II (commercial, industrial, mineral, and railroad) property. Calculations exclude JVSD millage. The SD-1 files report “effective” property tax rates for current expenses (after tax reduction factors are applied).

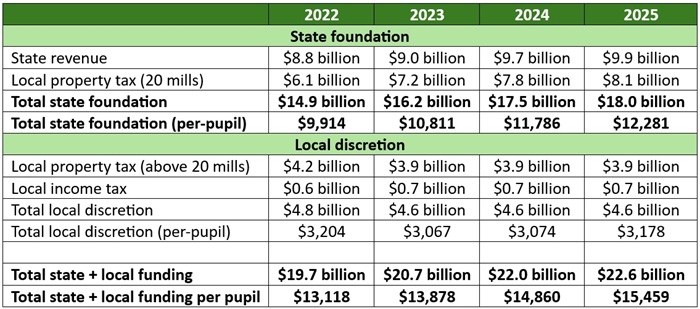
Direct state support combined with the 20 mill property tax provided Ohio school districts with $18.0 billion in total foundation funding in 2025—about $3.1 billion more than they received through these funding components in 2022. As noted earlier, districts can further supplement by asking voters to approve tax rates above the millage floor or a local income tax. During this period, these local “optional” dollars amounted to $4.6 billion to $4.8 billion dollars, boosting districts’ total state-and-local haul to $20 billion to $23 billion per year.

Table 1: Funding broken down by revenue source, Ohio traditional school districts

20 mill floor blog table 1
Source: State revenue, Ohio Department of Education and Workforce, Expenditure Rankings reports (FY2022 to FY2025); local income tax, Ohio Department of Taxation SD-2Q reports for FY2022 to FY2025; see note under Figure 1 for local property tax source. Notes: Dollars are not inflation-adjusted. Table excludes federal funds and non-tax revenues.

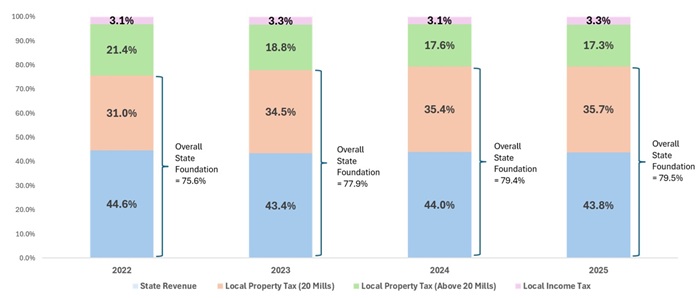
As Figure 2 indicates, the indirect state aid generated via 20 mills plus direct state revenues add up to 75 to 80 percent of district funding—a far cry from the 32 percent “state share” that critics have peddled. Only 20 to 25 percent of districts’ funding could be viewed as purely discretionary local funding.

Figure 2: Percentage of district funding generated by “direct” state revenue plus state-required local millage

20 mill floor blog figure 2

Claims that the State of Ohio “starves” or “underfunds” school districts unravel in light of a proper understanding of the overall funding system. State law effectively guarantees districts 20 mills of property taxes, a rate that generates billions to educate students. These dollars must not be forgotten or ignored in debates over the state’s overall investment in public education.


[1] As an example, Upper Arlington (wealthier) received $1,098 per pupil in state formula funding in 2026, while Whitehall (poorer) received $11,699 per pupil in state formula funding. Upper Arlington, however, generated $9,081 per pupil on the 20 mill property tax, while Whitehall generated $2,296 per pupil.

[2] The only exception is a handful of partnership charter schools located in Cleveland that receive a modest sum in local tax revenue.

[3] During this period, residential and agricultural values (class I property) rose from $233 to $331 billion statewide, while class II property (commercial, industrial, mineral, and railroad) values increased from $61 to 72 billion.

view
Teacher pipeline blog image

Ohio takes its eye off the teacher shortage ball

Jessica Poiner
8.24.2026
Ohio Gadfly Daily

A few years ago, teacher shortages were a hot topic in Ohio. In the wake of the pandemic, a perfect storm of issues—too few students enrolling in or graduating from teacher preparation programs, too many veteran educators retiring, teacher burnout, and low pay—coalesced to elevate a familiar, consistent concern into somewhat of a public panic. Seeking solutions, policymakers established two statewide initiatives aimed at strengthening Ohio’s teacher pipeline.

First, as part of the state budget in 2023, lawmakers established the Grow Your Own Teacher Scholarship Program. Grow Your Own (GYO) programs are so named because they focus teacher recruitment efforts on people living in local communities: paraprofessionals and substitute teachers who already work in schools, professionals who are looking to change careers, and high school students who are interested in education as a future career. As part of Ohio’s program, eligible high school seniors and school employees who committed to teaching in a qualifying school for at least four years after graduating from a teacher training program were awarded scholarships of up to $7,500 for up to four years.

Second, just a few weeks after Governor DeWine signed the aforementioned state budget into law, he unveiled a teacher apprenticeship initiative that added K–12 teaching to the state’s list of registered apprenticeship occupations. Apprenticeship programs offer workers job-related classroom training, on-the-job learning experience under the supervision of an experienced mentor, and pay for their work. Ohio’s teacher-based model allows postsecondary educator preparation programs to work alongside K–12 districts to establish apprenticeships for employees already working in schools—staff like teachers’ aides, librarians, and bus drivers. The goal is to provide a pathway into the classroom that’s flexible for those with various levels of experience and schooling and offers credit for prior experiences.

Together, these initiatives could boost the overall number of teachers in Ohio. They could also be used to target persistent shortage areas. GYO programs, for example, can be specifically designed to recruit and train educators in hard-to-staff subjects, grade levels, or communities (like rural areas). Apprenticeship programs, meanwhile, can make teaching a more financially accessible option, as apprentices are paid for their time and often avoid student debt.

Unfortunately, after establishing these options, state policymakers took their eye off the ball. Now, neither program is living up to its potential.

Ohio’s GYO scholarship program proved to be hugely popular. Two hundred applications were completed during the 2024–25 cycle. A whopping 639 were completed for 2025–26. Clearly, there was an appetite for this kind of opportunity. But lawmakers opted not to allocate additional funding in the state budget for FY 2026 and 2027. Without money to fund new scholarships, the program is no longer accepting new applications. If lawmakers continue to withhold funding in future budgets, the program will basically cease to exist once current scholarship recipients earn their degrees. If Ohio really is facing a teacher shortage, it’s a shame that an innovative program like this—one that could open doors for non-traditional teachers—has fallen by the wayside.

Teacher apprenticeships, meanwhile, are still technically an option. But just like with GYO programs, lawmakers opted not to set aside any dedicated funds to support them. Rumor has it that plenty of districts and higher education institutions were interested in collaborating to establish apprenticeship pathways. But without state funding to help cover the costs, very few opted to participate. As of this writing, the Ohio Department of Higher Education website directs prospective teachers to the Apprentice Ohio Dashboard, where it says they can find a current sponsor. But clicking the “Find an Apprenticeship Here!” button and using the drop-down menu to search for opportunities for “teachers and instructors” reveals only five sponsors.[1] Huge swaths of the state—especially the northern half—appear to have no opportunities available. 

To be clear, lawmakers didn’t maliciously abandon either of these initiatives. There doesn’t seem to have been any political pushback or concerns about quality or feasibility. It just came down to dollars and cents. Money doesn’t grow on trees, which means state budgets are all about tradeoffs. These two programs aren’t the only ones with considerable potential that ended up on the cutting room floor.

It’s also worth noting that part of the reason why these efforts fizzled is because Ohio has been flying blind. State and local leaders don’t have access to detailed and consistent data on teacher vacancies. Without this information, it’s hard to make the case that state investment is needed. If lawmakers had hard data clearly demonstrating that teacher shortages were an urgent problem in need of decisive action, they might be more likely to direct state dollars toward these programs.

We’ll soon find out if that’s the case. Starting in the fall of 2027, Ohio leaders will have access to detailed information about teacher vacancies. These data will allow them to identify the regions, districts, schools, subjects, and grade levels where shortages exist. The Department of Education and Workforce will also begin reporting enrollment and completion rates at the state’s educator preparation programs, which should give leaders a much clearer picture of the teacher pipeline.

It’s impossible to predict what these data will show. How lawmakers will respond to potential shortages is also an open question. But Ohio has already done the work to establish two statewide initiatives that could bolster the teacher pipeline. GYO programs and teacher apprenticeships both have a ton of potential. But to capitalize on that potential, policymakers will need to invest.


[1] There are additional options for preschool teachers, education administrators, and teaching assistants.

view
SB 276 analysis blog image

Ohio explores improvements to its statewide assessment

Jessica Poiner
8.19.2026
Ohio Gadfly Daily

All across Ohio, students, families, and teachers are gearing up for the start of a brand-new school year. The last thing on everyone’s mind as they shop for school supplies and decorate their classrooms is state testing, which largely won’t occur until the spring. But it’s important to know that earlier this summer, lawmakers tucked some interesting provisions into Senate Bill 276 that could make state tests a lot more useful to families and schools going forward.

The topline takeaway is that the bill requires the Department of Education and Workforce (DEW) to examine how Ohio could implement a single, statewide “hybrid” assessment. More specifically, DEW has been tasked with researching and compiling data into a report for lawmakers that outlines how to establish a single assessment that provides two kinds of results: criterion-referenced and nationally norm-referenced.

To understand why Ohio should consider a hybrid assessment, it’s important to recognize how these two types of tests are different.

Criterion-referenced tests are, as the name implies, based on criteria. For Ohio’s primary and secondary schools, those criteria are the state’s content standards, which outline the knowledge and skills students are expected to master by the end of each grade. Districts and schools administer state tests to measure the extent to which their students have mastered grade-level content. Tests are scored by comparing performance to a standard of achievement known as a proficiency cut score. Students who score proficient are considered on grade level. Children scoring below the proficiency mark (limited or basic) will need extra support to catch up to their peers, while those who score above it (advanced and accomplished) are considered on track for college.

Norm-referenced tests, on the other hand, aren’t tied to state standards. Instead of a comparison to content standards, norm-referenced exams compare a student’s performance to other students and then determine a percentile ranking based on the distribution of test-takers. Schools often use norm-referenced exams as a diagnostic tool to understand how students have grown over time and how their achievement compares to that of their peers.

The upshot is that these are different tests, offering different results, which can be used for different reasons. Without criterion-referenced tests, it’s very difficult for parents and educators to objectively determine if students have met grade-level expectations. Since federal law requires states to administer standards-aligned tests as part of their accountability systems, maintaining a criterion-referenced exam is non-negotiable for Ohio. But norm-referenced results could give schools and families additional information and context that makes it easier to track student progress and identify needs. If DEW can develop a test instrument that reports both types of results, then Ohio parents and educators could have the best of both worlds.

That’s not all, though. As part of its report, DEW must explore several other dimensions of state assessment. There are three that are particularly interesting.

  1. A computer-adaptive design. As the name suggests, computer-adaptive tests adapt to students during the assessment process via computer software. In traditional, “fixed-form” tests like the ones Ohio currently uses, the difficulty level is the same for all students. With adaptive tests, however, the difficulty of students’ questions is determined by their previous responses. Although all students are tested on their current grade-level standards, students who answer questions correctly are provided harder items, and those who struggle with grade-level questions are provided easier ones to better pinpoint where they are. By targeting questions to a student’s ability level, the assessment can provide a much clearer picture of what students know.

  2. Producing a growth measure that leverages data from the grade level above and below the one being tested to more accurately reflect a year of learning. Because they’re designed to measure above and below a single grade level, adaptive tests could lead to better, more exact measures of student growth. Developing a more precise gauge of whether students learned a year’s worth of material in a year’s time for state report cards would provide a clearer picture of which schools are doing excellent work and which ones might need more support.

  3. Returning actionable results within one week of administration. For a long time, Ohio parents were forced to wait months for their students’ score reports. By the time they finally arrived, it was far too late to take advantage of the summer months to address academic concerns uncovered by the results or even plan for the fall. In 2024, policymakers changed the law to require public and private schools to provide score reports to families by June 30. While that was definitely an upgrade, the majority of students finish testing in May. A June 30 deadline is still a month-long wait (sometimes more). If Ohio’s new system could return actionable results within one week instead of one month, that would give parents and teachers far more time to plan accordingly for the summer and fall.

DEW is required to submit its report no later than November 15. We won’t know the feasibility of these changes until the department publishes its report. But making state assessments more useful to families and educators is a worthy goal. Here’s hoping Ohio can make it happen.

view
Teen survey data SR image

Digging into the findings of The American Teenagers Survey

Jeff Murray
8.25.2026
Ohio Gadfly Daily

How are today’s teenagers different from previous generations? Daniel Cox, a senior fellow at AEI and director of their Survey Center on American Life, dug into some new data to find out. The American Teenagers Survey project raises the specter of today’s young people eschewing traditional teen experiences—like eating regular family meals, reading for pleasure, and spending time with friends—in favor of whiling away hours a day on social media, playing video games, and trying to figure out the future.

Survey responses come from NORC at the University of Chicago’s AmeriSpeak, a probability-based panel designed to be representative of the U.S. household population, including all 50 states and the District of Columbia. Teenagers (13–17) were recruited to AmeriSpeak via parents/guardians who were already part of the panel. Cox’s sample consisted of 782 teens who completed the entire survey—self-administered online—in January and February of 2026. Three stages of weighting were conducted to align the final survey sample to specific population benchmarks drawn from the U.S. Census Bureau’s Current Population Survey as of March 2025.

Let’s start with a few data points on those traditional teen experiences. Only 37 percent of survey respondents said they share meals as a family every day, and 33 percent indicated this occurs no more than once a week. The older the teens, the lower the percentages. About one in three said they read a book for fun within the last week, roughly the same proportion who said they seldom or never do. Fifteen percent reported having a part-time job. Travel sports and music declined among older teens. And other traditional routines were also uneven, with one in four teens helping with household chores, and one in five seldom or never attending religious services.

How do today’s teens fill their time? Overall, 35 percent of respondents said they spent at least four hours a day on social media or playing video games. Short-form video platforms like YouTube and TikTok were the most-visited sites, and about 44 percent of teens spent at least an hour gaming every day. Thirty-five percent of teens said they seldom or never used AI chatbots; about one in five (21 percent) reported “irregular use,” a category that ranged from once or twice a month to a few times a year. There is, unfortunately, no differentiation as to whether any of this online time or device usage is required (schoolwork, college applications, job requirements, etc.) or voluntary.

Various aspects of family structure play strong roles in teens’ daily lives. Respondents with college-educated parents were more likely to participate in numerous extracurricular activities, including sports and school-sponsored clubs, than those whose parents did not have a four-year college degree. Just 37 percent of teenagers with divorced parents reported feeling very or completely satisfied with their lives, as compared with 55 percent of teens whose parents were married. Respondents with married parents also reported higher evaluations of their personal health and more satisfaction with their familial relationships than their peers with divorced parents.

One particularly bright spot concerns friendships. Sixty percent of teenagers reported they had four or more close friends, and another 34 percent said they had between one and three close friends. Only 2 percent of respondents said they had no close friends. And despite the long hours spent online, a majority of those with friends (55 percent) said they spent time with them—in person and outside school hours—at least once a week.

When it comes to their post-graduation options, approximately 48 percent of respondents planned on going to a four-year college after high school. Seventeen percent planned on enrolling in a two-year college or a vocational program, 10 percent were planning on a full-time job out of high school, and 3 percent planned on military enlistment. Eighteen percent of teens reported being uncertain about what they will do after high school graduation. Sixty percent of girls were planning on a four-year college, compared to 36 percent of boys. More boys than girls were planning for vocational school or getting a full-time job. More boys than girls also said they were unsure about their post-graduation plans.

What does the long-term future hold for today’s teens? In a word: traditional. Large majorities of respondents said they were very or extremely likely to find rewarding and good-paying jobs, to own their own home at some point in the future, and to marry someone “they really like.” Nearly 43 percent of teens said they are very or extremely likely to have children in the future, 30 percent said they are somewhat likely to have kids, and the rest said they are unlikely to or not interested at all in starting a family. Respondents from college-educated households were far more optimistic about their own college plans, ability to earn a living, and achieving the American dream of home and family than their peers whose parents did not have college degrees.

There’s lots more to unpack in these survey results, but the gist seems clear enough: Today’s teens may lead different, more-plugged-in lives from those of previous generations, but they still generally aspire toward traditional adult lives. Cox focuses heavily on reported technology use among teens in his conclusion, especially overuse among certain groups, noting that “it is their technology use that makes their formative experiences so distinctive” from their predecessors. But even in our rightful concern about the prominence of influencers both real and artificial in young Americans’ lives, we shouldn’t forget that some of those predecessors are their own parents and grandparents. Family ties and familial examples still serve to shape the lives and futures of young Americans today. The stronger and more connected our teenagers are to positive role models, mentors, and success stories, the better they can plan for—and reach—their own future goals.

SOURCE: Daniel A. Cox, “A Digital Divide in American Adolescence: Gender, Class, and the New Teenage Experience,” American Enterprise Institute (July 2026).

view
Teacher observation

Expanded review process for determining school quality leads to minimal improvement

Jeff Murray
8.20.2026
Flypaper

New York City Schools piloted an external qualitative review (QR) in a subset of its schools for the first time in 2005, intended to expand the definition of school quality via a school inspection-type model and to broaden the scope of educational accountability. Along with traditionally examined outcomes like test scores, disciplinary actions, attendance, and graduation rates, outside analysts aimed to capture schools’ quality across three additional dimensions: their instructional core, school culture, and structures in place for continuous improvement. New research looks at whether such an expansion of accountability improved schools.

Due to concerns over cost and potential disruption to school operations (external reviewers were on site for two or three days), the New York City Department of Education both delayed and staggered the rollout of QR across the district, beginning in the 2009–10 school year. The first year prioritized schools that were low-performing or in danger of becoming low-performing based on the most recent district-issued Progress Reports. Higher-performing schools were entered into a lottery system to receive their first qualitative review as soon as possible after 2009–10. The low performers received annual reviews; higher performers were on a three- or four-year schedule depending on how highly they were initially rated.

American University researcher Robert Shand exploits all of these implementation quirks in his analysis, covering 2009–10 through 2013–14. His main goal: determining how more frequent exposure to external qualitative evaluation impacted school practice and learning outcomes, including test scores, graduation rates, attendance, and the various QR measures. For just a taste of these new quality measures: Instructional core indicators included measures of a rigorous, engaging curriculum aligned with learning standards; school culture measures captured a positive learning environment (or not) and a climate of high expectations (or not); and structures for improvement concerned processes like institutional goal-setting and teacher support systems.

The publicly available data Shand uses came from the New York City Department of Education, including whether and when a school was subject to QR, scores for all QRs conducted, and measures of teacher practice from the annual Learning Environment Survey/School Survey. Student outcomes included scores on third through eighth grade math and English language arts state tests, four-year and six-year high school graduation rates, and student attendance, all compiled by NYU’s Research Alliance for New York City Schools. Shand employs a regression discontinuity design to examine the effects of additional evaluation and feedback provided via QR on student outcomes and the new quality measures.

First, the bad news: No statistically significant impacts from a quality review were seen in any school receiving a review, and even the small nonsignificant positive improvements on test scores observed were driven by a handful of schools, appeared two to three years after QR, and faded by the following year. Whether reviews were annual or intermittent made no difference.

On the more positive side, some additional dimensions of school quality examined via QR did show improvement following a review. These include the number of teachers reporting that they use data to guide decision-making and those working in collaboration with their peers, as well as measures of overall learning environment quality. Even better: Higher overall QR scores predicted modest test score gains in a given school—albeit not for a year or two after the review—with Shand suggesting that QR’s primary value is as a leading indicator rather than a diagnostic tool.

“Taken together,” Shand concludes, “the findings support a cautiously optimistic but qualified view of qualitative accountability as one component of a broader school improvement strategy…but insufficient on its own to drive sustained gains in student learning.” In other words, even a rigorous on-site review doesn’t negate the need to keep a sharp eye on more traditional measures of quality and for schools to change course when, say, test scores fall or absenteeism rises.

SOURCE: Robert Shand, “The Effects of Qualitative Accountability on School Improvement Efforts: Evidence from New York City,” Leadership and Policy in Schools (June 2026).

view
Next Chapter SoR report image - Getty Images/ValerioGalli

The Next Chapter: Ohio’s implementation of the science of reading—and where to next

8.18.2026
Report

Executive summary

Approximately half of American adults read at a sixth-grade level or below, according to the Barbara Bush Foundation.[1] The consequences of poor literacy skills are profound: higher unemployment rates, lower-paying work, and struggles with routine tasks such as reading prescriptions or bills. From a societal perspective, widespread illiteracy means slower economic growth, a less vibrant democracy, and greater taxpayer burdens.

Adult illiteracy rates of course include many who attended school decades ago. But the outlook is—somewhat surprisingly—just as grim for today’s students. In Ohio, 38 percent of fourth graders and 31 percent of eighth graders scored “below basic” (the lowest mark) on the most recent National Assessment of Educational Progress. These failure rates have crept upward over the past decade—accelerating during the pandemic—and in 2024 they reached the highest levels since the turn of the century.[2]

To address this literacy crisis, Ohio lawmakers have enacted two landmark policy reforms: the third grade reading guarantee (2012) and the science of reading (2023).

The third grade reading guarantee requires elementary schools to identify struggling readers in grades K–3 and create an improvement plan outlining the additional supports they will provide. The guarantee initially required schools to retain third graders (with narrow exceptions) who fell short of a state reading target and provide them with more intensive interventions.

The science-of-reading initiative requires schools to align their curriculum and instruction with the five pillars of evidence-based reading practices (phonemic awareness, phonics, fluency, vocabulary, and comprehension). It also requires colleges of education to align their teacher preparation with the science of reading, and included more than $170 million to support implementation in K–12 schools and higher education.

This report reviews Ohio’s efforts to implement key provisions of these literacy reforms, focusing primarily on state- and district-level activities.[3] Important—but mixed—developments pertaining to the third grade reading guarantee include the following:

  • Ohio recently strengthened its early identification policy. For many years, Ohio allowed schools to choose among more than a dozen diagnostic tests to identify lagging readers. Some tests were lower-quality assessments that allowed districts to avoid identification and intervention. Lawmakers recently limited the number of testing options to just six, thus helping to ensure that tests align with state expectations and accurately identify off-track students.

  • Ohio unfortunately gutted the retention requirement. Regrettably, state lawmakers in 2023 weakened the guarantee’s retention provision by allowing schools to promote struggling students based on parental request. Widespread “social promotion” has followed: In 2024–25, 98 percent of third graders were promoted despite a statewide third grade reading proficiency rate of just 61 percent. Of the grade-promoted students, 21,658 students advanced to fourth grade through the parental loophole.

As for science-of-reading implementation, the report documents the following:

  • Ohio schools have moved toward stronger reading curriculum. Under state requirements, Ohio barred the use of several popular but non-scientifically based curricula. In their place, schools have transitioned to higher-quality curricula such as the well-regarded Core Knowledge Language Arts, which was the most-used core curriculum in the state across grades K–5 in 2024–25.

  • Teachers are receiving professional supports. By the end of 2025, a large majority of Ohio classroom teachers, reading specialists, and administrators—more than 115,000 educators in all—completed an introductory professional development (PD) course in the science of reading. In addition, as of March 2026, Ohio has placed reading coaches in 151 low-performing schools to provide more intensive and personalized instructional support.

  • Ohio now exercises stronger oversight of teacher preparation programs. During 2025, Ohio undertook a first round of audits to ensure that instruction in the state’s colleges of education is aligned to the science of reading. Thirty-eight out of forty-eight programs were deemed in full or partial alignment but ten failed the audit, including Ohio University and Ohio State University. Non-aligned programs have twelve months to take corrective action; if they fail a follow-up audit, the program must close.

With one glaring exception (retention), Ohio has a solid early literacy policy framework.[4] When it comes to implementation—how laws are translated into practice—the state has moved aggressively in various areas such as curriculum and teacher PD. But it will take more to sustain this momentum. The following summarizes key ways that state leaders can keep the pedal to the floor.

Steady leadership. Due to term limits, Governor DeWine’s tenure is drawing to a close. The next governor should also embrace literacy reform, making it a top priority and taking actions that challenge schools to rigorously implement the science of reading. As exemplified by Massachusetts and Mississippi, strong and sustained leadership has been critical to keeping education reforms on-track and working to produce results.[5] Ohio will need that same type of resolve to ensure that literacy reforms yield long-term benefits for its students.

Strong accountability. State policymakers must hold schools and educators accountable for implementation and improved reading achievement. They can do this in the following ways (further discussion of each recommendation appears at the link noted.

a. Require schools to meet with parents of struggling readers more than once per year.

b. Restore the third grade retention requirement.

c. Support inspections of low-performing schools’ alignment to the science of reading.

d. Strengthen the teacher preparation program audits.

Knowledge-building focus. Discussion around the science of reading tends to revolve around phonics—i.e., teaching children to “decode” by sounding out words. While phonics is absolutely essential, it’s not the only ingredient to reading success. Students also need a rich vocabulary and strong background knowledge to make sense of what they are reading. The good news is that the content-rich Core Knowledge Language Arts has become the most-selected literacy curricula in Ohio, with roughly one in four districts choosing this program for third grade instruction; another one in five use another core reading program that is nationally recognized as knowledge-rich. This means, however, that just over half of Ohio districts are using third-grade reading programs of more questionable depth when it comes to foundational knowledge and vocabulary. Policymakers should continue to seek ways to promote vocabulary and background knowledge, whether by focusing future PD efforts on those reading pillars or providing grants for districts seeking to implement content-rich programs.

Rigorous evaluation. While Ohio schools are starting to row in the same direction on literacy, there remains wide variety in the specific programs schools use and quality of instruction. Rigorous research should be undertaken to shine light on which core curricula, intervention programs, and professional supports provide the strongest benefits for students. This can help state and local officials pinpoint programs and initiatives worth promoting through targeted investments (and which should be discontinued).

* * *

Literacy has the power to change lives. It can unlock further education and rewarding careers. It opens minds to new ideas and ways of thinking. The ability to read is necessary for responsible citizenship and independent adulthood. Thanks to the work of state policymakers, Ohio has moved in the right direction on literacy policy. With continued bold leadership and rigorous implementation in the years ahead, Ohio can make good on its promise of higher reading achievement.


Policy overview

Understanding the importance of literacy, Ohio policymakers have undertaken initiatives to improve reading proficiency, particularly in the early grades. Many of the state’s critical provisions were enacted through the third grade reading guarantee and the science-of-reading initiative. This section briefly summarizes these policies, while the following sections examine in more detail the implementation of key provisions and important steps remaining to be taken.

Third grade reading guarantee

Under the leadership of former Governor John Kasich, Ohio enacted the reading guarantee in 2012. The package includes the following elements:[6]

  • Early identification. Each fall, schools must identify students in grades K–3 who read below grade level using a state-approved reading diagnostic test.

  • Reading improvement plans. If a student is identified as off-track, schools must notify parents and create a reading improvement and monitoring plan (RIMP). Among other items, the plan must specify the “additional instructional services and support” that a student will receive.

  • Third grade retention. Schools must retain and provide “intensive interventions” to students who fall short of a reading benchmark on the third-grade state exam or an approved alternative.

The retention mandate was the most contentious provision, as it challenged schools to ensure that every child (with narrow exceptions) acquired foundational reading skills before advancing to fourth grade. At the bill-signing ceremony, Governor Kasich explained the rationale: “Kids who make their way through social promotion beyond the third grade ... they get lapped, the material becomes too difficult.”[7] In other words, the requirement sought to end social promotion and truly “guarantee” that all students are prepared to succeed when they enter fourth grade.

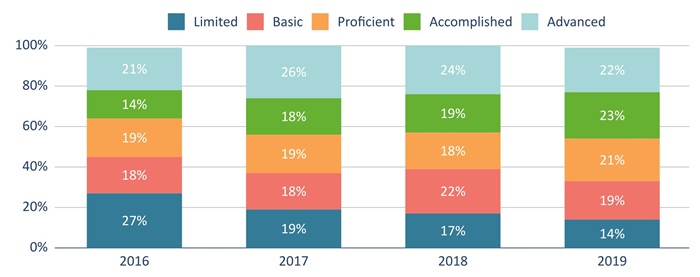
The retention policy worked. The fraction of third graders scoring “limited” (the lowest mark) on state reading exams fell from 27 to 14 percent between 2016 and 2019, years when the requirement was in effect. Consistent with research from other states, a rigorous study from the Ohio Education Research Center found that third graders retained under this policy performed better in middle school than their comparable peers.[8]

Despite these promising results, critics routinely attacked retention as “punitive,” leading the legislature to walk back the requirement in 2023. Under a weakened law, schools are now allowed to promote struggling students to fourth grade if a parent requests that his or her child advance in consultation with the teacher and principal. This allowance has relaxed accountability for reading proficiency and—as shown later in this report—resulted in widespread social promotion, the discredited practice of advancing students to the next grade even if they are unprepared.

Science of reading

The reading guarantee focused on early intervention, but did not directly address what happens in general classroom settings. Starting around 2020, a nationwide push for improved reading instruction, especially in the early grades, gained traction in the media and among policymakers. Amplifying longstanding scholarship on the “science of reading,” journalist Emily Hanford’s series Sold a Story introduced the broader public to effective practices—and to the bad as well.[9] At the same time, the rapid gains of Louisiana and Mississippi on national reading assessments made headlines in papers across the country. Their move up the rankings coincided with bold reforms that ensure schools align instruction with the science of reading.[10]

Ohio Governor Mike DeWine thrust the science of reading into the limelight in his 2023 state of the state address. “In our budget, we are making sure that all Ohio children have access to curriculum that is aligned with the evidence-based approaches of the Science of Reading,” he proclaimed.[11] Under his leadership, state lawmakers passed a two-year budget bill (FYs 2024 and 2025) containing science-of-reading provisions, along with $170 million over the biennium to support implementation.[12] The initiative covered the following areas:

  • High-quality instructional materials: Requires schools to use state-approved core reading curricula (grades K–5) and intervention programs (grades K–12) that align with the science of reading. The state provided $64 million to subsidize the purchase of new materials.

  • Professional development (PD): Required Ohio educators—with limited exceptions—to complete a state-developed PD course on the science of reading by June 2025. The state provided $86 million to pay stipends to teachers upon course completion.

  • Reading coaches: Provides intensive, hands-on coaching for teachers in low-performing schools; the state expended $18 million to fund coaches for FY24 and FY25.

  • Teacher preparation: Requires the state to audit all preparation programs to ensure training aligns with the science of reading. The state spent $2 million to support the audits.[13]

Though enacted at different times and via separate laws, the third grade reading guarantee and science-of-reading policies form a solid literacy framework for Ohio. But implementation—how policies on paper actually change practice—is key to delivering higher student achievement. The rest of this report examines how these reforms are being implemented.

What is the science of reading?

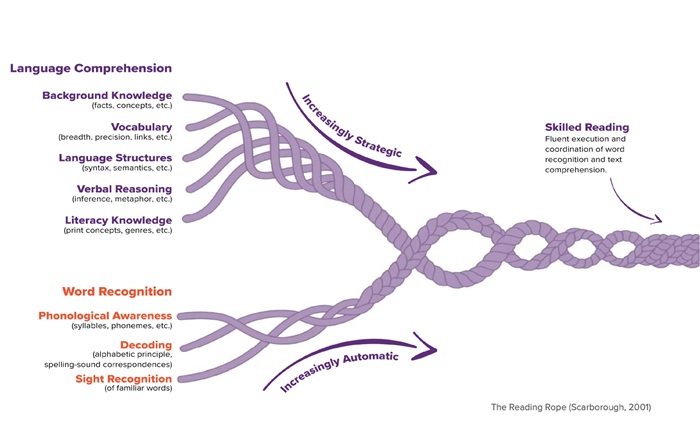
The science of reading refers to an instructional approach that is informed by a vast body of scientific research on how children best learn to read. It emphasizes the “five pillars” of reading outlined in a landmark national report (2000): phonemic awareness, phonics, vocabulary, fluency, and comprehension.[14] (Appendix A briefly defines each pillar.) The components are also commonly depicted via Hollis Scarborough’s “reading rope.” As indicated in the illustration below, phonics—teaching letter-sound relationships—is key to word recognition, while background knowledge and vocabulary (among other elements) are essential for language comprehension. By contrast, “three cueing”—a technique taught in many colleges of education and embedded in “balanced literacy” curricula—deemphasizes phonics and encourages children to guess at words based on contextual clues such as a picture.[15] Under Ohio’s science-of-reading law, three-cueing was banned.

Figure 1. Scarborough’s reading rope

Next Chapter SoR report Figure 1

Source: The Reading League, Science of Reading: Defining Guide (2021).

Third grade reading guarantee

This section discusses the implementation of the main elements of the third grade reading guarantee as enacted as well as subsequent developments: (1) early identification of struggling readers, (2) reading improvement and monitoring plans that outline how schools will support such students, and (3) retention and intensive interventions for students who are still struggling to read by the end of third grade.

Early identification

In an effort to identify and address reading deficiencies early, schools must assess all students in grades kindergarten through third each fall using a state-approved reading diagnostic test.[16] Students who are deemed “off-track” on these assessments receive extra supports based on an individualized improvement plan described later.

Diagnostic tests should align with state standards and flag students who are likely to struggle when they take the third grade state exam, the first year a state assessment is administered as required under federal law. Some districts, however, have reported questionably low numbers of off-track students when compared to their state exam results. In 2024–25, Dayton Public Schools identified only 24 percent of kindergartners as off-track in reading—far below the 63 percent of third graders who fell short of proficiency on state reading exams. In Akron, 33 percent of first graders were deemed off-track even though 54 percent of third graders fell short of proficiency.

The disconnect raised questions about whether schools were using weak diagnostic tests to avoid identification and intervention. This was a real possibility, as Ohio had approved a raft of testing options—fifteen, as of 2024–25.[17] To address a “race to the bottom” on K–3 diagnostic tests, Ohio lawmakers recently restricted the number of options. Starting in 2026–27, schools must choose from a narrower set of six tests: Acadience Reading K-6 (formerly DIBELS Next), Curriculum Associates’s iReady, Edmentum’s Exact Path, NWEA’s MAP Growth, Amplify’s mCLASS DIBELS (8th edition), and Renaissance’s Star CBM.[18]

Recommendation

To their credit, state lawmakers recently strengthened the early identification provision by reducing the diagnostic testing options. This change should improve the accuracy of schools’ identification of struggling readers—and better ensure they receive help under an improvement plan. Yet even with more limited options, an approved assessment might still under-identify struggling readers due to misalignment with state standards.[19] To flag possible inconsistencies, Ohio Department of Education and Workforce (DEW) should begin reporting publicly which diagnostic test each district and school uses, alongside their on- and off-track rates. The agency should also require diagnostic testing vendors to submit evidence establishing their comparability to state standards and assessment results.

Reading improvement and monitoring plans

When K–3 students are identified as off-track, schools must notify their parents and create a reading improvement and monitoring plan (RIMP). This plan must be developed within sixty days of identification and in partnership with parents. The RIMP must include a student’s specific reading deficiencies, the “additional instructional services and support” that the school will provide, and how progress will be monitored during the school year. Students may be removed from a RIMP when they achieve an on-track score on the following fall reading diagnostic or achieve proficiency on a state reading exam.[20]

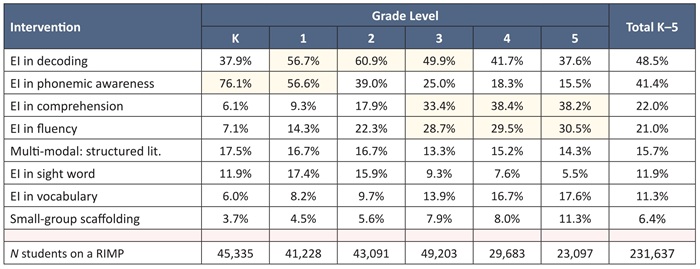
What types of additional supports do students receive? The table below offers a summary based on the various categories reported to the state. Across grades K–5, Ohio schools most frequently provide explicit intervention (EI) in decoding (i.e., phonics) and phonemic awareness. Not surprisingly, usage is heaviest in grades K–3 when word recognition is the emphasis. For instance, 57 and 61 percent of first and second graders on a RIMP received extra support in decoding. Interventions in comprehension and fluency are also common but more prevalent in grades 3–5. Schools must use an intervention program that aligns with the science of reading (more than eighty have been state-approved).[21] But beyond this information, little is known about what interventions consist of—e.g., the “dosage” students typically receive and who provides them—or what impacts they have on student progress.

Table 1. Type of intervention provided to students covered by a RIMP, 2024–25
Next Chapter SoR report Table 1

Source: Ohio DEW, Kindergarten Through Grade 4 Literacy Report for School Year 2024–2025 (January 2026). Notes: EI = Explicit Intervention. More detailed definitions of each intervention is available in DEW’s EMIS Manual (Section 2.9, Student Program [GQ] Record). Several less frequently reported intervention categories are omitted for display purposes. Percentages do not add to 100 because students may receive intervention in multiple categories.

Academic interventions recently passed in Senate Bill 19

In June 2026, the General Assembly enacted Senate Bill 19 (SB19), legislation that is primarily math-focused yet also contains provisions related to academic intervention for students (across all grades) falling well short of literacy standards.[22] Specifically, schools must provide interventions to students who score “limited”—the lowest achievement category—on a state reading exam in grades 3–8 or the high school English II assessment.[23] Interventions must supplement core academic instruction, be provided free of cost, and align with the science of reading. Importantly, the legislation also includes an accountability provision, whereby the Ohio Department of Education and Workforce (DEW) will, starting in 2027–28, randomly select no more than 5 percent of schools statewide for detailed on-site reviews of their interventions. The department will produce a report on its findings, which will be provided to the school and made publicly available on the school’s report card webpage.

Recommendations

RIMPs outline steps that schools will take to help children struggling to read, and Ohio policy ensures that parents have input on the plan. But without execution, the plans risk being merely check-box exercises. Ohio policymakers should do the following to promote effective interventions:

Require at least one follow-up parent conference after a RIMP is created. State law requires schools to develop the RIMP in partnership with a parent, but it fails to require any follow-up to discuss progress during the school year. This relieves schools of accountability to parents for following through on the plan. It’s also a missed opportunity for schools to encourage continued parental engagement at home in the shared goal of helping a child read. Understanding the importance of parental engagement, the SB19 provisions for “limited” students require schools to notify parents about the interventions their child will receive and provide “periodic” updates. A similar parental follow-up provision should be required for students covered by a RIMP.

Implement robust SB19 intervention reviews. Students scoring “limited” on state assessments are failing academically and at significant risk of dropping out during high school. It’s essential they receive high-quality interventions. DEW should implement a strong on-site review process that helps ensure quality and accountability, while also disseminating best practices through its public reports. Schools that are identified as noncompliant with the intervention requirements or providing ineffective interventions should be flagged for a follow-up during the following school year.

Evaluate which intervention models and programs are most effective. Given the large number of approved intervention programs and varying delivery models (small-group versus one-on-one; in-person versus virtual), struggling students are apt to receive widely different experiences. Some are likely helpful, but others may be no help at all—and sometimes at an enormous cost.[24] Ohio should commission independent research to uncover which interventions are most effective at boosting reading performance, at an affordable cost. This can help schools select and implement cost-effective interventions.

Third grade retention

The third grade reading guarantee promised Ohioans that every child would exit third grade with the foundational literacy skills needed to read increasingly complex material in fourth grade and above. To truly “guarantee” that students would be prepared, the law included a mandatory retention provision. As initially enacted and implemented, Ohio required schools—with limited exceptions[25]—to hold back third graders who fell short of a state-defined “promotional score” on the state reading exam or an approved alternative assessment.[26] Schools were also required to provide “intensive interventions” to retained students, which may include small group or one-on-one instruction during school day, summer reading camps, or extended learning opportunities (e.g., afterschool or Saturday programs). The point was not just a repeat of a failed year with no changes but a much-strengthened educational experience for children who needed it.

The table below shows that roughly 4.5 to 6.5 percent of third graders were held back in 2016 to 2019, four years in which the retention policy was in force. Though not large numbers, they surpassed pre-guarantee retention rates, which typically fell below 1 percent. Another 5.5 to 7.0 percent of third graders were exempt due to provisions that excused certain special-needs students from meeting reading requirements.

Table 2. Percentage of Ohio third graders promoted, retained, and exempted under third grade reading guarantee, 2015–16 to 2018–19

Next Chapter SoR report Table 2

Source: Ohio Department of Education and Workforce, Report Card Download Data (files titled “Third Grade Reading Guarantee”).

Did the policy work? Third grade reading proficiency rates steadily rose from 2016 to 2019, while the percentage of students scoring in the lowest category (“limited”) declined from 27 to 14 percent. The substantial decline in struggling readers suggests that retention—and the accountability it provided—increased schools’ sense of urgency and obligation to help children meet state reading targets to avoid holding them back. As for the direct effects of retention on students who were held back, a rigorous analysis found that retained students’ state exam scores were significantly higher into middle school than matched peers who just narrowly met the state’s promotional threshold at the end of third grade.[27]

Figure 2. Trend in third grade reading achievement 2015–16 to 2018–19
Next Chapter SoR report Figure 2

Source: Author’s prior analysis of DEW data. Note: The retention mandate was first implemented in 2013–14 but under different state assessments.

Lawmakers understandably pressed pause on accountability (including retention) during the pandemic and immediately afterwards. But as schools resumed normal operations, education groups, which have long resisted the accountability associated with retention requirements, pressured lawmakers to permanently abandon retention.[28] Despite the promising pre-pandemic progress and strong evidence that this tough-love requirement was boosting retained students’ reading skills, Ohio lawmakers gutted the policy in 2023—ironically, in the same bill that contained science-of-reading reforms. They accomplished this by creating a massive loophole that now allows schools to promote students who fail to meet reading standards upon parental request.[29]

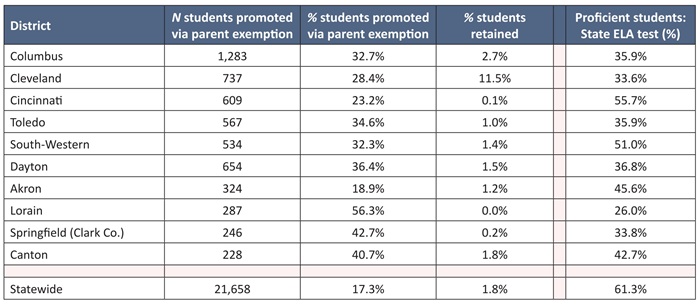
The result: social promotion has returned en masse to Ohio schools. As the table below indicates, the loophole is now widely used to advance third graders despite the fact that they’re struggling to read. Statewide, schools promoted 17.3 percent of third graders, or 21,658 students, to fourth grade via parental request as opposed to meeting state reading standards. Big-city districts such as Canton, Columbus, Dayton, and Toledo advanced one-third or more of their third graders through this loophole. In Lorain and several other districts (e.g., Lima and Trotwood-Madison),[30] more than half of third graders were promoted this way. These numbers of “socially promoted” third graders dwarf the tiny fractions of students who are now retained.

Table 3. Districts with the most third graders promoted via parental exemption, 2024–25
Next Chapter SoR report Table 3

Source: Ohio DEW, Report Card Downloadable Files titled “Third Grade Reading Guarantee” and data on students promoted via parental exemption provided by author request.

Recommendation

With a now toothless retention policy, students are no longer “guaranteed” the extra time and intensive interventions—e.g., summer reading programs or one-on-one supports—that help them read proficiently. It has also eased the pressure on elementary schools to ensure that every child has a strong literacy foundation before entering fourth grade. To reverse course, Ohio lawmakers should restore a standards-based promotional requirement by repealing the parental exemption.

Science of reading

The science-of-reading initiative has four main provisions: It (1) requires schools to use high-quality reading curricula; (2) requires educator professional development in the science of reading; (3) provides reading coaches for low-performing schools; and (4) requires teacher preparation programs to align their training with the science of reading. The following sections review Ohio’s implementation of these provisions.

Core curriculum

The national push for the science of reading has put a focus on reading curricula. Rightly so, as schools in Ohio and across the nation have for many years turned to popular but non-scientifically based programs, such as Lucy Calkins’ Units of Study, Fountas and Pinnell’s Classroom, and Reading Recovery, an intervention program with historical ties to Ohio State University. The science-of-reading movement exposed the shortcomings of such programs, but it also pointed the way to better curricula—the kind that stress phonics and include content-rich reading material that builds students’ vocabulary and background knowledge. As research by E.D. Hirsch, Dan Willingham, and others demonstrates, students must know what words mean and have factual knowledge in order to comprehend a text.[31] Some curricula put more content-rich material in front of students than others, with literacy experts often finding fault with “basal readers” that overemphasize “comprehension skills” (e.g., “find the main idea”) at the expense of foundational knowledge.[32]

Weeding out debunked programs and transitioning to high-quality curricula is an important goal of Ohio’s science-of-reading initiative. The law now requires schools to use instructional materials that align with the science and do not include “three-cueing” or other nonscientific methods. To implement that mandate, the Ohio Department of Education and Workforce (DEW) establishes a list of reading curricula (grades K–5) from which schools may choose. The initial list, unveiled in early 2024, included just over a dozen programs such as the highly regarded, content-rich Core Knowledge Language Arts (CKLA) and Wit & Wisdom. Schools were required to begin use of a state-approved program by the end of 2024–25. Understanding the heavy lift involved for many schools to change curricula, lawmakers provided $64 million to subsidize material purchases.[33]

Curricular terminology

Following standard practice, DEW categorizes elementary reading curricula used for general classroom settings into two main categories: (1) core comprehensive and (2) core foundational skills. They can generally be differentiated in the following way: Core comprehensive curricula cover all grade-level ELA standards, including phonics and comprehension, while core foundational skills curricula (only applicable in grades K–2) cover phonemic awareness, phonics, and fluency but do not cover all grade-level standards.[34]

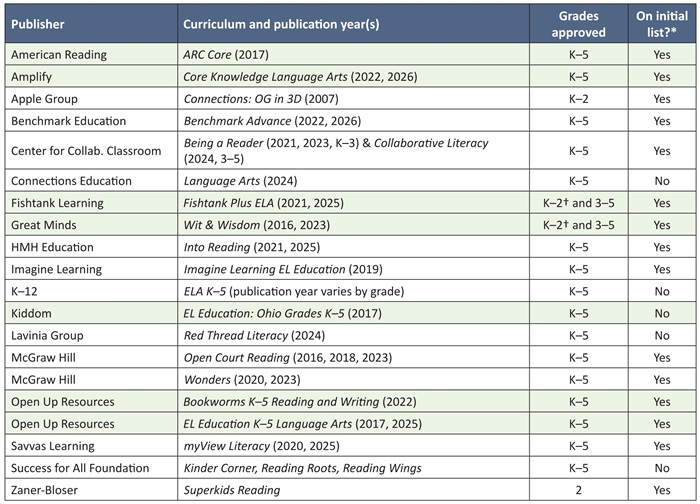
Over the past two years, the list of approved materials has grown as DEW has conducted additional review cycles. As Table 4 indicates, DEW added five core comprehensive curricula since 2024, two of which are affiliated with online education providers (K–12 and Connections) along with programs published by Kiddom, a digitally-enhanced version of Open Up Resources’ EL Education, and the Lavinia Group. In addition, DEW approved Success for All—a solid curriculum that should not have been omitted in the initial vetting.[35] Finally, a few updated versions of previously approved curricula have been added such as the 2026 edition of CKLA. Some approved core curricula meet basic state expectations but are not recognized by national experts as having especially strong knowledge-building material. However, several knowledge-rich programs—highlighted in green—are state approved.[36]

Table 4. List of state-approved core comprehensive curricula as of April 2026
Next Chapter SoR report Table 4

Source: Ohio DEW, “Approved List of Core Curriculum and Instructional Materials” (webpage, last accessed April 2026). Notes: (*) This column refers to curricula that were approved by DEW as of May 2024. (†) Indicates that the K–2 program does not include foundational skills and must be paired with a core comprehensive program to meet state requirements.

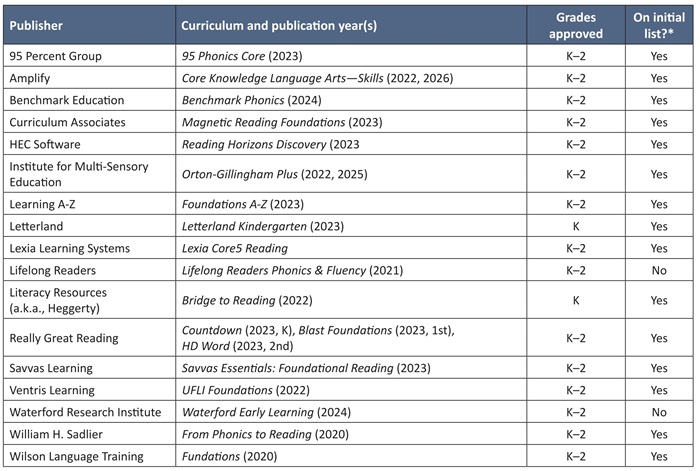
The next table displays state-approved core foundational skills curricula. Just over a dozen were initially approved with two more being added since 2024. A “knowledge-rich” designation does not apply for these programs, as they focus primarily on decoding through use of phonics and are intended for the earliest grades.

Table 5. List of state-approved core foundational skills curricula as of April 2026
Next Chapter SoR report Table 5

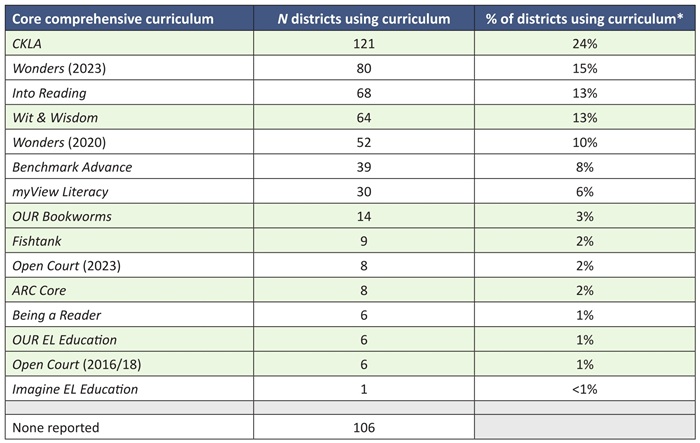
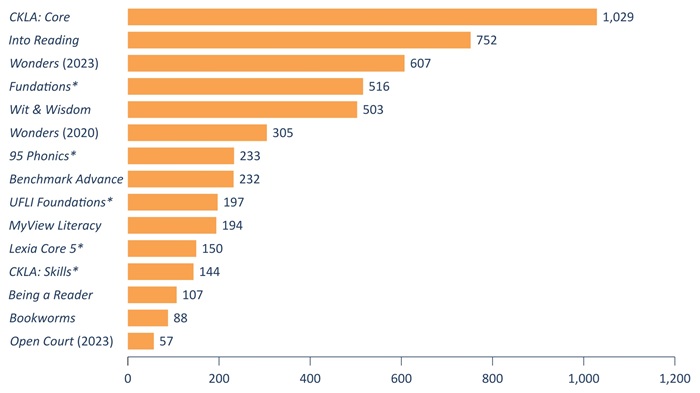
Which of these programs are used most by Ohio schools? The following figure shows that CKLA is the top core comprehensive curriculum in grades K–5, followed by Into Reading, Wonders (2023), and Wit & Wisdom. Of the core foundational skills programs, Fundations is the most widely used, followed by 95 Phonics and UFLI Foundations. The chart shows a total number of instances a program was reported in use across all grades K–5, with districts often reporting multiple uses of a single program when used in more than one grade.[37] It does not, therefore, reflect the number of districts or schools adopting a program. Appendix C displays the most frequently used program by individual grade level, which offers a closer approximation of the number of districts and charter schools using a program, and the box below takes deep-dive look at the numbers for third grade.

Figure 3. Most frequently used curriculum—total across all grades K–5—in 2024–25
Next Chapter SoR report Figure 3

Source: Ohio DEW, Report Portal. DEW technical documentation indicates incomplete reporting for 2024–25 and the data are subject to change later this year[38]. Note: (*) Indicates a core foundational skills curriculum.

A closer look at core comprehensive curricula in third grade

The foregoing analyses focused on the overall usage of curricula across all grades K–5. This is a more comprehensive look, but does not offer clarity about the fraction of Ohio districts using each program. The following table provides data on districts’ use of core comprehensive curricula in third grade, a year in which foundational skills programs are phased-out and the emphasis shifts toward language comprehension and knowledge-building.

Table 6 indicates that approximately one in four Ohio districts use CKLA for third grade core reading instruction, while another one in five use another nationally-recognized content-rich program (e.g., Wit & Wisdom, Bookworms, or Fishtank). However, just over half of Ohio districts use third-grade curricula that are not identified by the Knowledge Matters Campaign as being especially strong in the areas of knowledge building. As of the writing of this report, DEW reports incomplete data for 2024–25, with 106 districts not appearing in its curricula database (about one in six districts statewide). Thus, the percentages are rough approximations of the actual curricular share.

Table 6. Number and percentage of districts using various core comprehensive curricula in third grade

Next Chapter SoR report Table 6

Note: (*) The calculation is based on the number of districts reporting a curriculum (i.e., excluding the 106 districts without data). Ten districts reported use of two (n=9) or three (n=1) core comprehensive curricula, and those districts are counted more than once in the numbers presented above. Public charter schools are not included in this table.

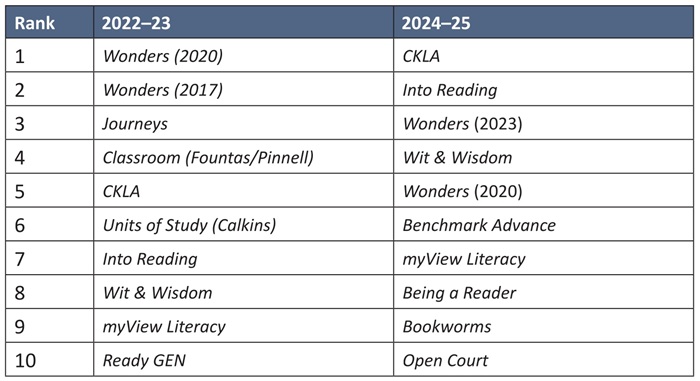
The next table compares the most-used curricula just prior to the science-of-reading legislation to post-reform. Pre-reform, Wonders (2020 and 2017 editions) were the most used curricula, with Journeys, Classroom, and Units of Study—three programs that are now barred—also making appearances among the top ten. Pre-reform, CKLA was the fifth most frequently used curriculum, but now stands on top; the well-regarded Wit & Wisdom has also moved up the ranks. The rise of these two curricula is promising, as “gold standard” experimental research finds significant benefits for students whose schools effectively implement content-rich curricula (in that study, CKLA).[39]

Table 7. Ten most frequently used K–5 core comprehensive curricula in Ohio, 2023 versus 2025
Next Chapter SoR report Table 7

Source: The 2022–23 list is based on a DEW curricula survey analyzed in Aaron Churchill, Off and Running, Thomas B. Fordham Institute (2024).

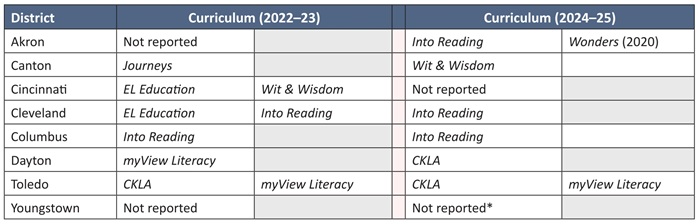
Table 8 displays the core comprehensive curricula used by the Ohio Eight urban districts. In 2024–25, three districts—Akron, Cleveland, and Columbus—reported use of Into Reading, a state-approved curriculum but one that has also faced criticism as being weaker on content.[40] Dayton and Toledo used CKLA, and one district (Canton) used Wit & Wisdom. Youngstown reported use of only a foundational skills program—materials published by Really Great Reading (RGR)—but did not report a core comprehensive curricula. Cincinnati’s 2024–25 curricula do not presently appear in the state database.

Table 8. Core comprehensive reading curricula, Ohio Eight districts, 2022–23 and 2024–25
Next Chapter SoR report Table 8

Note: (*) Youngstown reported use of a foundational skills curricula (Really Great Reading), but not a core comprehensive program.

Recommendations

Ohio policymakers acted quickly to establish a list of state-approved reading curricula, and schools have moved rapidly toward alignment with new state requirements. To their credit, state officials—following legislative intent—have forbidden use of several formerly popular but discredited reading curricula. As a result, the curriculum and materials landscape looks significantly different than just three years ago. To build on this movement, Ohio policymakers should do the following:

Create a strong “inspection” system that ensures use of high-quality curricula, especially in low-performing schools. Governor DeWine recently pledged to form “science-of-reading instructional implementation teams” organized and overseen by DEW.[41] While details are still to be officially announced, the governor did note concerns about high-quality materials not being used, suggesting that the teams may have some oversight responsibilities along with supporting schools struggling with implementation. This initiative should be strongly supported by state leaders moving forward, as it is critical to ensuring faithful implementation.

Create incentives for schools to adopt knowledge-rich curricula. One of the most promising developments is the significant uptake in CKLA and Wit & Wisdom, programs that are strong on content knowledge. But many schools still choose curricula known to be lighter on knowledge. With the assistance of national experts and local educators, DEW should take a closer look at its state-approved reading curricula list to identify programs that are especially strong on the knowledge-building elements. Once identified, the state could provide incentives such as grant funding for curriculum-specific PD or a state-negotiated price for knowledge-rich curricula for districts seeking to upgrade their learning materials.

Professional development

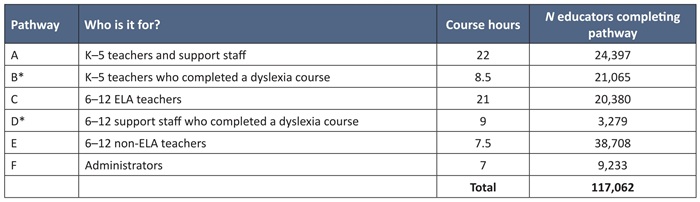
The science-of-reading legislation required nearly all Ohio educators to complete a professional development course by June 2025. The main exception was teachers who had previously completed “similar training” in the science of reading (e.g., LETRS).[42] To implement the requirement, DEW created a course in partnership with a national PD provider, Keys to Literacy. It includes a general introduction to the science of reading as well as modules that cover each of the five reading pillars (see Appendix D for the course structure). The format was online, though facilitated in-person trainings were offered through regional educational service centers and state support teams. Upon completion, teachers received $1,200 stipends if they taught in grades K–5, were English teachers in grades 6–12, or served in reading-focused support roles.[43] Non-English teachers in grades 6–12 received $400 stipends, while administrators were ineligible for stipends.

DEW created six “pathways” that guided educators to the appropriate PD course, depending on grade level and whether they had completed dyslexia training (the latter being eligible for an abbreviated course). The table below displays the breakdown of educators completing the various pathways by December 2025, six months after the completion deadline. In total, just over 117,000 educators took the PD course. There are approximately 105,000 classroom teachers and administrators,[44] so the vast majority of educators working in Ohio schools completed the PD course.

Table 9. Ohio educators completing the state’s science-of-reading PD course
Next Chapter SoR report Table 9

Source: Ohio DEW, Kindergarten through Grade 4 Literacy Report for School Year 2024–2025 (January 2026). Note: (*) Starting in 2025–26, DEW has discontinued pathways B and D, as they are no longer relevant.

In 2025, state lawmakers updated the state’s science-of-reading PD requirements. Moving forward, all Ohio educators (K–12 teachers and administrators) must complete a refresher course by June 2030 and every five years thereafter.[45] Under state law, the refresher course must be “competency-based” and “reinforce educators’ knowledge and skills in the science of reading.” As of April 2026, DEW reports that the refresher course is still under development, though it will include two modules: Module 1 will review the major components of the science of reading, while Module 2 will allow teachers to select from several options to deepen their knowledge, including literacy instruction for specific student groups or in particular content areas. No stipend is currently being provided for the refresher.[46]

Recommendation

An introductory PD course in the science of reading was essential for in-service teachers, many of whom were trained by their colleges of education to use three cueing techniques and “balanced literacy” curricula. The more recent move requiring teachers to “refresh” their knowledge is another step forward. As DEW develops the refresher course, it should make sure that (1) teachers are required to demonstrate “competency” by meeting a certain score on an end-of-training assessment;[47] and (2) that reading comprehension—including the vocabulary and knowledge-building elements that support it—is strongly emphasized within the course’s content.

Reading coaches

For many Ohio educators, the PD course served as a necessary introduction to the science of reading. But a half-week course won’t be enough to transform instruction in schools where ineffective practices are deeply ingrained. In those locales, teachers will need more personalized, hands-on training from experienced educators with expertise in the science of reading.

To provide more intensive PD, Ohio launched a reading coach initiative, which prior research has shown helps sharpen instructional practices and boosts student achievement.[48] Per legislative requirements, DEW must place coaches in schools with low reading achievement. The coaches are “under the direction” of DEW but are employees of regional educational service centers (ESCs).[49] To support the program, lawmakers allocated $6 million in FY24 and $12 million per year in FYs 2025–27. Coaches are trained to follow the state’s coaching model, which mainly involves providing small-group and one-on-one teacher support (e.g., analyzing assessment data or problem-solving with a teacher) yet also includes interfacing with the entire school staff.[50]

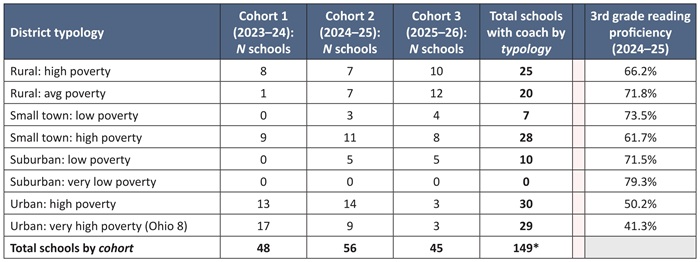
As of spring 2026, ninety-one reading coaches work in 151 schools across the state, with more being added in the coming fall.[51] The table below displays the geographic and socio-economic characteristics of these schools as well as their “cohort”—i.e., the year in which a coach first worked at a school. Coaches have been distributed rather widely across the state—surprisingly so, given that high-poverty urban schools struggle most with reading achievement and the legislation directs DEW to place coaches in low-performing schools. It’s not clear why placements have not been more heavily concentrated in urban areas: Only twenty-nine Ohio Eight schools have coaches, even though there are more than 600 district and public charter schools in those communities. It may have proven challenging to recruit coaches to work in those schools, or perhaps urban schools have been reluctant to sign-up for a coach. Coaches have also been placed—again somewhat surprisingly, given the emphasis on early literacy—in some middle and high schools (approximately one in five reading coach schools are in a middle or high school).

Table 10. Schools with reading coaches by cohort and district typology
Next Chapter SoR report Table 10

Source: Analysis of DEW’s list of schools with reading coaches provided by request.[52]. Notes: (*) Two schools with reaching coaches are excluded from the count: one preschool and one online charter school. The “cohort” refers to the first year (in parentheses) in which a school had a reading coach.

Just as important as placement questions is whether reading coaches are making a difference. On this count, DEW did a fall-to-spring analysis of reading coaching schools’ internal diagnostic tests (which varied) during 2024–25. It found that students whose teachers had more intensive coaching demonstrated more progress than students whose teachers had less intensive coaching. (The “intensity” of the coaching was measured by the amount of time teachers received small-group or one-on-one coaching.)[53]

While the DEW analysis suggests that the individual coach matters, it did not investigate whether schools with coaches fared better than schools without one. To explore this question using standardized assessment data, the figures below display the third-grade proficiency rates and the schoolwide reading performance index (PI) scores[54] of the cohort 1 reading coach schools versus statewide and for the Ohio Eight school districts. Third grade scores are a narrower measure and in some cases do not reflect the actual grade a coach is supporting. The schoolwide PI score, on the other hand, may capture the work of coaches who cover middle and high school grades, but may not accurately reflect the work of the majority of coaches who support teachers in elementary schools.

Cohort 1 schools are lower achieving—not surprisingly so, given the program guidelines—with scores closely tracking the Ohio Eight district average. There was an uptick in reading scores during year one of coaching (2023–24), and more noticeably so on the broader PI measure.[55] However, scores on both metrics slipped in the second year of implementation.[56] While more rigorous analysis on reading coaches is needed, the basic trend data do not yet indicate the hoped-for positive impact of reading coaches.

Figure 4. Cohort 1 schools with reading coaches, third grade reading proficiency rates (left) and reading performance index scores (right)
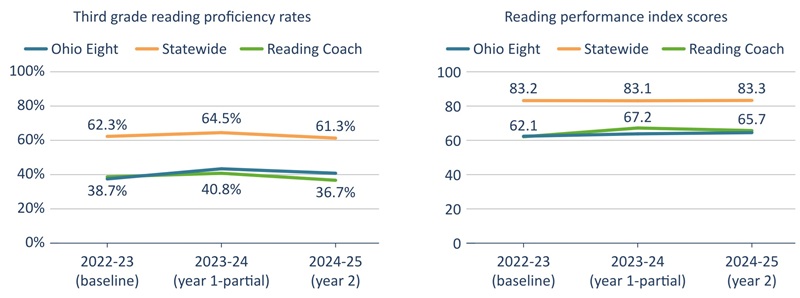
Next Chapter SoR report Figure 4

Source: Author’s analysis of state test data, accessed through the DEW report card webpage. Note: The analysis displays an enrollment-weighted average proficiency rate/PI score across all cohort 1 schools.

Recommendations

Reading coaches have a strong rationale and empirical support based on prior studies. They were also instrumental in supporting the literacy improvements in Mississippi. Ohio should continue to provide funding for the program and give it time to mature. But as state leaders implement the reading coaching program, they should do the following:

Require—or at least strongly encourage—low-performing urban elementary schools to have a reading coach. Ohio should focus placements more heavily in high-poverty urban schools where achievement lags furthest behind. This may require mandatory coaching placements in schools with chronically low reading performance and more focused recruitment of coaches in urban communities.

Make reading coaches direct employees of DEW. While state legislation gives DEW some authority over reading coaches, the agency does not directly employ them (they are hired by regional ESCs). This weakens DEW’s ability to directly supervise, evaluate, and reward or discipline reading coaches. While ESCs could support recruitment efforts and provide logistical assistance, coaches should ultimately answer to state officials. Mississippi’s successful program ensured that coaches were state employees, which promoted quality and accountability.[57] Ohio should do the same.

Hold individual reading coaches accountable. The DEW analysis of diagnostic test scores suggested variation in the time coaches spent with teachers, with some apparently providing more extensive support than others. While clock-time itself should not be the measure of success—teachers’ time shouldn’t get consumed with ineffectual coaching—DEW should make sure that its coaches are being proactive and spending the necessary time with teachers to develop their practices. Moreover, reading coaches should be accountable for improved reading outcomes in the schools and specific grades they support.

Conduct rigorous evaluations of the overall coaching program. Coaching is not inexpensive—nor should it be—and the state will need an assessment of whether the benefits of coaching in terms of increased student achievement justify its expense. That time is now. A rigorous evaluation of the impact of reading coaches on student achievement in reading should begin immediately.

Teacher preparation

Colleges of education have long trained teaching candidates to use non-scientific methods, which they then bring into classrooms. A 2023 analysis by the National Council on Teacher Quality, for instance, found that most of Ohio’s teacher preparation programs (TPPs) were instructing future elementary teachers in methods that are contrary to the science, and just a minority of programs were adequately covering the five pillars of reading.[58]

Ohio’s science-of-reading initiative aims to encourage more effective preparation through two measures. First, the legislation called for an audit of all Ohio TPPs to ensure alignment with the science of reading. Programs failing the audit must undertake corrective action, or face program revocation if a follow-up review reveals persistent misalignment. Second, the initiative requires the Ohio Department of Higher Education (ODHE) to publish each TPP’s first-time pass rates on the state’s Foundations of Reading licensure exam (as opposed to the longstanding practice of reporting only “best attempt” pass rates, which include retakes). First-time pass rates shine a clearer light on the programs that most and least effectively train candidates in the science of reading.[59]

To implement the requirement, ODHE partnered with the Meadows Center at the University of Texas to design the audit framework and assist in the reviews, which occurred during 2025. The audits include seventy-three individual metrics that cover all five reading components as well as a few additional elements such as writing (example metrics appear in Appendix E). Audit teams checked whether a TPP met a metric based on reviews of course syllabi, assigned readings and textbooks, and course assessments. They also checked for evidence of three-cueing. If discovered, the program automatically failed the review, being deemed noncompliant with the state’s prohibition. TPPs could also fail if they met less than half of the seventy-three audit metrics.

Thirty-three TPPs passed the review and were deemed “in alignment,” while five programs were in “partial alignment.” Ten programs were “not in alignment,” including large ones such as Bowling Green, Cleveland State, Ohio State, and Ohio universities. In all cases, non-compliance with the three-cueing prohibition was the reason for failure, and follow-up reviews are currently underway—should they fail that review, the chancellor of higher education must revoke their approval. Moving forward, all TPPs will be audited every four years.[60]

The audits rightly penalized TPPs for blatant noncompliance and will hopefully prompt swift changes in those programs. Yet the initial results reveal a weakness in the audit framework. When reviewers measured adherence to the seventy-three metrics, they found almost no fault with any program. Even those that failed the basic compliance review—and even those with poor licensure exam pass rates—received perfect to near-perfect scores on the metrics. In fact, Ohio TPPs as a whole met a remarkable 98 percent of the metrics, with twenty programs meeting every single one.

Perfect scores on the audit metrics contrast with the first-time licensure exam pass rates. Roughly one in three teaching candidates from Miami, Ohio State, and Bowling Green universities failed the Foundations of Reading licensure exam on their first try. Yet all three programs met 100 percent of the audit metrics. This discrepancy suggests that the auditing process may be overlooking weaknesses in training programs that show up when candidates take their licensing exam.

Figure 5. Teacher preparation programs’ first-time Foundations of Reading licensure exam pass rates versus audit metrics met
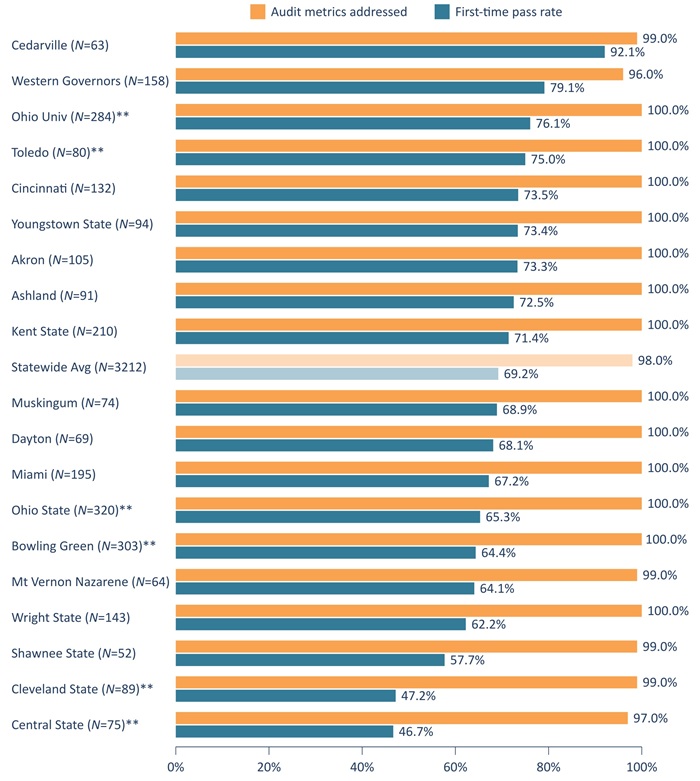
Next Chapter SoR report Figure 5

Source: ODHE, “Foundations of Reading Dashboard” (webpage, last accessed May 2026). Note: The figure above includes all TPPs with more than fifty candidates taking the Foundations of Reading licensure exam between September 2023 to August 2024. The number of test-takers is displayed next to each college. (**) Indicates the college of education was not-in-alignment on the ODHE audit.

Recommendation

The first-round of audits was an important step toward holding colleges of education accountable for teaching the science of reading. Yet as demonstrated by licensure exam results, many candidates leave their programs with knowledge deficits in the science of reading. This indicates weaknesses in TPP’s training not captured through the auditing metrics. Unfortunately, the perfect to near-perfect scores on the audit metrics across virtually all colleges of education sends signals that no further improvements are needed. ODHE should refine and strengthen the audit framework to more accurately measure the extent to which programs cover an audit metric, so that the process identifies weaknesses and incentivizes programs to address them.[61] ODHE should also incorporate first-time Foundations of Reading passage rates into the audit framework as another way of ensuring quality teacher training in the science of reading.

Conclusion

“The science of reading has won the argument. Has it won the classroom?” asked literacy expert Robert Pondiscio in a recent piece discussing the mixed views of U.S. teachers toward the science of reading.[62] Here in Ohio, the policy question about how best to teach children to read is largely settled but whether these literacy reforms win over classroom teachers—and more importantly, whether we see progress in student proficiency—remains an open question.

As this report documents, Ohio has not merely enacted literacy laws and then put the system on autopilot. The state has truly made literacy a top priority—arguably the top priority in education—and has devoted significant resources toward literacy and taken steps to promote faithful implementation.

Yet more work remains in these efforts. Accountability pieces are in their initial phases (TPP audits), in development (state inspection teams), or simply missing (third grade retention). State and local leaders will need to more clearly emphasize that knowledge-building is just as critical for skilled reading as phonics. Rigorous evaluation—an oft-overlooked part of implementation—must be undertaken to discover what’s working.

The past twenty years have seen a flurry of activity in literacy reform. If state leaders continue to follow through on these policies, more Ohio students will acquire the literacy skills needed for lifelong success.


Abbreviations and Acknowledgments

Abbreviations

CKLA: Core Knowledge Language Arts

DEW: Ohio Department of Education and Workforce

ESC: Educational Service Center

FY: Fiscal Year (which runs from July 1 to June 30)

ODHE: Ohio Department of Higher Education

ORC: Ohio Revised Code

PD: Professional Development

RIMP: Reading Improvement and Monitoring Plan

TPP: Teacher Preparation Program


Acknowledgments

I wish to thank my Fordham Institute colleagues Chad L. Aldis, Chester E. Finn, Jr., Jeff Murray, Michael J. Petrilli, and Jessica Poiner for their invaluable feedback on drafts of this report. Special thanks also to Dave Williams for designing and typesetting the report.

— Aaron Churchill
Ohio Research Director, Thomas B. Fordham Institute


Endnotes


[1] Barbara Bush Foundation for Family Literacy, “Literacy Gap Map” (webpage, last accessed May 2026).

[2] NAEP data were accessed via https://www.nationsreportcard.gov/ndecore/.

[3] Classroom-level implementation is beyond the scope of this report, but a survey of Ohio teachers offers insight into how they view and implement the science of reading: Alanna Bjorklund-Young and Andrea Ochoa, Ohio’s Path to Early Literacy, Johns Hopkins University/Thomas B. Fordham Institute (March 2025).

[4] ExcelinEd, “Comprehensive Early Literacy Policy” (2024). Though beyond the scope of the present report, a comprehensive policy framework for reading achievement across all grades also includes a rigorous school report card and academically driven graduation requirements. For discussion of these topics and how Ohio can improve those areas, see Aaron Churchill, Ohio’s High School Diploma: Gateway to success or door to nowhere? Fordham Institute (October 2025), and ibid., “Getting Ohio’s early literacy measure right,” Fordham Institute, blog (January 28, 2026).

[5] Rachel Canter, Inside the Mississippi Marathon, Progressive Policy Institute (April 2026) and Education Reform Now Massachusetts, Thirty Years Later (January 2023).

[6] Senate Bill 316 of the 129th General Assembly. Current law is available at ORC 3313.608.

[7] Reginald Fields, “Ohio Gov. John Kasich signs third grade reading guarantee bill into law,” Cleveland Plain Dealer (June 25, 2012).

[8] Caroline Barto, Josh Hawley, Lisa Neilson, and Ani Ruhil, “Initial Results from the Third Grade Reading Guarantee,” Ohio Education Research Center/Ohio Excels (June 2023). For studies from other states finding benefits of retention, see footnote 27.

[9] Emily Hanford, “Sold a Story,” APM Reports (October 2022–August 2025).

[10] See, for example, Nicholas Kristof, “Mississippi Is Offering Lessons for America on Education,” New York Times (May 31, 2023).

[11] Mike DeWine, “Governor DeWine’s 2023 State of the State Address” (January 31, 2023).

[12] House Bill 33 of the 135th General Assembly. Key sections of law related to the science of reading include ORC 3313.6028, 3319.2310, and 3333.048.

[13] HB33 set aside just $150,000 for the teacher preparation audits, but subsequent legislation added $2 million to carry out the responsibility (Senate Bill 94 of the 135th General Assembly).

[14] National Reading Panel, Teaching Children to Read (2000).

[15] For resources discussing the science, see Ohio DEW, “The Science of Reading” (webpage, last accessed May 2026); Anne Castles, Kathleen Rastle, and Kate Nation, “Ending the Reading Wars: Reading Acquisition from Novice to Expert,” Psychological Science in the Public Interest (June 2018); and Louisa Moats, “Teaching Reading Is Rocket Science,” American Educator (Summer 2020). For discussion of non-scientifically-based instruction, see Louisa Moats, Whole-Language High Jinks, Thomas B. Fordham Institute (January 2007) and Hanford, “Sold a Story.”

[16] Following statutory language, I use the term “diagnostic” assessment/test, but they are also commonly known as “screeners.”

[17] This excludes the statewide KRA assessment which, through 2025–26, was approved for identification purposes in kindergarten. Starting in 2026–27, schools must still administer the KRA each fall but are no longer permitted to use KRA scores for identification under the third grade reading guarantee.

[18] The limit on state-approved diagnostic tests was passed in 2025 via House Bill 96 of the 136th General Assembly. The tests approved by DEW appear on its webpage “Reading Diagnostic Assessments” (last accessed April 2026). Some relatively minor modifications to the diagnostic test provisions were passed in June 2026 via Senate Bill 19 of the 136th General Assembly.

[19] For more on the challenges of equating different diagnostic tests, see Matthew Brunetti, Meredith Langi, and Sarah Quesen, Are We on the Same Page? A discussion of the use and misuse of early literacy assessments, WestEd (2025).

[20] Prior to 2023, schools were not required to maintain a student’s RIMP after third grade. Starting in 2023–24, third graders who fall short of proficiency on the state reading exam remain on a RIMP if they are promoted to fourth grade (and beyond fourth, if they continue to fall short of proficiency). The policy extending RIMPs beyond third grade was enacted through HB33 of the 135th General Assembly.

[21] The list of approved intervention programs covers all grades K–12, and is available at the Ohio DEW, “Approved List of Evidence-Based Reading Intervention Programs” (webpage, last accessed April 2026).

[22] For a summary, see Jessica Poiner, “Ohio lawmakers just passed a sweeping math reform bill. Here’s what’s in it,” Fordham Institute, blog (June 22, 2026). More detail is available at Senate Bill 19 of the 136th General Assembly.

[23] It also includes students scoring the equivalent of “limited” on a grade K–3 diagnostic. In those grades, there will be students covered by a RIMP but not by the SB19 intervention provisions (i.e., students who score above “limited” but below the “on-track” threshold).

[24] Reading Recovery—an intervention that Ohio now prohibits due to use of three-cueing—was notorious for its large expense. One reading expert estimated that it doubled the per-pupil cost of educating a child: Tim Shanahan, “Me and Reading Recovery,” blog (May 14, 2022).

[25] Exceptions include students who recently immigrated to the U.S., students with disabilities whose IEP specifically exempts them from the retention requirement, and certain students who have been previously retained.

[26] From 2016 to 2019, the exact promotional score always fell substantially below the “proficient” mark. In 2018–19, the promotional score was 677, or just 5 points above the “basic” cut point (672) and 23 points below the “proficient” score of 700. As of 2025–26, Ohio approved six alternative assessments for third-grade retention purposes.

[27] Caroline Barto, et al., “Initial Results from the Third Grade Reading Guarantee,” Ohio Education Research Center/Ohio Excels (June 2023). The positive finding in the Ohio study is consistent with research from other states. For evidence from Florida, see Guido Schwerdt, Martin R. West, and Marcus A. Winters, The Effects of Test-based Retention on Student Outcomes over Time, National Bureau of Economic Research (2017); from Mississippi, see Kirsten Slungaard Mumma and Marcus A. Winters, The Effect of Retention Under Mississippi’s Test-Based Promotion Policy, Wheelock Educational Policy Center/ExcelinEd (2023); and from Indiana, see NaYoung Hwang and Cory Koedel, “Helping or Hurting: The Effects of Retention in the Third Grade on Student Outcomes,” Education Evaluation and Policy Analysis (2023).

[28] School administrator groups and teachers’ unions led the criticism of the retention mandate. For their arguments, see committee testimony on House Bill 117 of the 135th General Assembly.

[29] There is a form letter that Ohio State University has created that schools can use to obtain parental approval. See “Sample Letter to Request Exemption from Ohio’s Third Grade Reading Guarantee,” The Ohio Statewide Family Engagement Center (website, last accessed June 2026).

[30] Appendix B lists the districts with the highest percentage of third graders promoted via parental exemption.

[31] Daniel T. Willingham and E.D. Hirsch, Jr., “Rediscovering Knowledge as the Key to Reading,” Education Next (March 2026).

[32] Kate Walsh, “Basal Readers: The lost opportunity to build the knowledge that propels comprehension,” American Educator (2003).

[33] For an analysis of Ohio schools’ pre-reform reading curricula and the initial list of state-approved curricula, see Aaron Churchill, Off and Running: Ohio’s early implementation of its Science of Reading reforms, Thomas B. Fordham Institute (July 2024).

[34] Though rarely applicable, a third category of core reading curricula is “core, no foundational skills.” For more detailed definitions, see Ohio DEW, High-Quality Instructional Materials in English Language Arts: PreK-Grade 5 Core Curriculum and Instructional Materials Approved List (October 2024).

[35] Robert Pondiscio, “’Sold a Story’: Six takeaways from deep dive into literacy in Steubenville, Ohio,” The 74 (March 20, 2025).

[36] Knowledge Matters Campaign, “Curriculum Directory,” (webpage, last accessed April 2026). For a critique of Ohio’s approved curriculum list, see Karen Vaites, “Ohio offers an object lesson on issues in the curriculum space,” School Yourself, blog (February 21, 2025).

[37] There are also a number of instances where a district reports more than one program in use even for a particular grade (e.g., a district that uses Fundations and CKLA in Kindergarten). This duplication is also reflected in the most-used numbers displayed in Figure 3.

[38] Ohio DEW, HQIM Dashboard Guidebook (January 2026).

[39] Mark Berends, et al., “How Building Knowledge Boosts Literacy and Learning,” Education Next (March 13, 2024).

[40] Natalie Wexler, “Most New York City schools are choosing a literacy curriculum that falls short,” Minding the Gap (blog, June 16, 2023).

[41] Mike DeWine, “Governor DeWine Delivers 2026 State of the State Address,” (March 10, 2026).

[42] Similar training included PD approved by the International Dyslexia Association, which includes programs such as LETRS, or those approved by the Ohio Dyslexia Committee for Structured Literacy Certification.

[43] The legislation (HB33) specifies qualifying support staff as intervention specialists, English learner teachers, reading specialists, or instructional coaches who serve in any grades K–12.

[44] For teaching and administrative staff counts, see Ohio Education by the Numbers, Thomas B. Fordham Institute (2025). The number of reading support staff is difficult to discern from publicly available data.

[45] New hires must take the original introduction to science of reading PD course within the first year of employment, unless they recently completed comparable coursework through their college of education.

[46] Ohio DEW, “Professional Development in the Science of Reading,” (webpage, last accessed April 2026).

[47] Current DEW guidance notes that teachers must achieve at least 80 percent on a post-course assessment to fulfill the forthcoming PD “refresher” requirement. Ohio DEW, Science of Reading Professional Development Requirements (March 2026).

[48] Matthew Kraft, David Blazar, and Dylan Hogan, “The Effect of Teacher Coaching on Instruction and Achievement: A Meta-Analysis of the Causal Evidence,” Review of Educational Research (February 2018).

[49] Section 265.330(C) of House Bill 33 of the 135th General Assembly contains language about reading coaches. DEW has contracted with regional educational service centers, which recruit and hire coaches.

[50] For an overview of what reading coaches should be doing to support literacy efforts, see Tim Shanahan, “How Can Reading Coaches Raise Reading Achievement?” blog (May 22, 2016). Ohio’s coaching model is available at Ohio DEW, Literacy Coaching: Implementation Playbook.

[51] Mike DeWine, “Governor DeWine Delivers 2026 State of the State Address” (March 10, 2026).

[52] The schools with reading coaches are publicly available on a map posted at DEW, “Ohio’s Model for Instructional Coaching for Literacy” (webpage, last accessed May 2026).

[53] Ohio DEW, Early Impacts of Ohio’s Literacy Coaching Model: The Year 2 ReadOhio Coaching Report (Fall 2025).

[54] The performance index is a composite measure of student achievement on all state reading exams (grades 3–8 and high school English II).

[55] For cohort 1 schools, 2023–24 was a “partial implementation” year. Coaches were hired and trained during fall 2023 and did not begin work at the schools until December 2023. For more on timing, see Ohio DEW, ReadOhio Coaching Report: Cohort 1, 2023–24 School Year (October 2024).

[56] The value-added “growth” results from 2024–25 were likewise inconclusive. Among cohort 1 schools, 10 schools demonstrated gains in reading (an ELA value-added index score above +2.0); 22 schools did not demonstrate significant gains or losses in reading (an ELA value-added score between -2.0 and +2.0); and 7 schools demonstrated losses in reading (an ELA value-added score below -2.0).

[57] Emily Freitag, “A bold state move to improve reading,” Flypaper (blog, February 2, 2025).

[58] Shannon Holston, Do Ohio’s teacher preparation programs follow the science of reading? National Council on Teacher Quality/Thomas B. Fordham Institute (May 2023).

[59] Ohio’s Foundations of Reading licensure exam is considered by NCTQ to be a “strong” assessment of teachers’ understanding of the science of reading. Hannah Putnam, False Assurances, National Council on Teacher Quality (March 2024).

[60] ODHE, Science of Reading in Ohio Educator Preparation Programs: A Statewide Audit (2025).

[61] This may require a scoring system—e.g., awarding points on a 1–5 scale for each metric—based perhaps on how much time is spent covering a metric or how rigorously it is assessed.

[62] Robert Pondiscio, “The science of reading has won the argument. Has it won the classroom?” Thomas B. Fordham Institute, blog (May 1, 2026).

Fordham Logo

© 2026 The Thomas B. Fordham Institute
Privacy Policy
Usage Agreement

National

P.O. Box 110
Burke, VA 22009

202.223.5452

[email protected]

Ohio

P.O. Box 82291
Columbus, OH 43202

614.223.1580

[email protected]

Sponsorship

130 West Second Street, Suite 410
Dayton, Ohio 45402

937.227.3368

[email protected]