Mobile Navigation

  • National
    • Policy
      • High Expectations
      • Quality Choices
      • Personalized Pathways
    • Research
    • Commentary
      • Gadfly Newsletter
      • Flypaper Blog
    • Events
    • Scholars Program
  • Ohio
    • Policy
      • Priorities
      • Media & Testimony
    • Research
    • Commentary
      • Ohio Education Gadfly Biweekly
      • Ohio Gadfly Daily
  • Charter Authorizing
    • Application
    • Sponsored Schools
    • Resources
  • About
    • Mission
    • Board
    • Staff
    • Career
Home
Home
Advancing Educational Excellence

Main Navigation

  • National
  • Ohio
  • Charter Authorizing
  • About

Ohio Menu

  • Topics
    • Accountability & Testing
    • Advanced Education
    • Career & Technical Education
    • Charter Schools
    • Curriculum & Instruction
    • ESSA
    • Evidence-Based Learning
    • Governance
    • Personalized Learning
    • Private School Choice
    • School Finance
    • Standards
    • Teachers & School Leaders
  • Research
  • Policy
  • Commentary
    • Ohio Gadfly Newsletter
    • Ohio Gadfly Blog
    • Events

The Education Gadfly Weekly

Sign Up to Receive Fordham Updates

We'll send you quality research, commentary, analysis, and news on the education issues you care about.
Thank you for signing up!
Please check your email to confirm the subscription.

Ohio Gadfly—Senate proposes big moves forward for school choice

Volume 17, Number 14
6.16.2023
6.16.2023

Ohio Gadfly—Senate proposes big moves forward for school choice

Volume 17, Number 14
view
Senate plan school choice blog image
School Funding

Senate’s budget plan moves the ball downfield on educational choice

To use football parlance, education reform often feels like three yards and a cloud of dust. Yet sometimes the gains are bigger—a long forward pass—and that’s what the Ohio Senate’s final budget bill, which passed the chamber yesterday, would amount to. These are the key proposals in their game plan.

Aaron Churchill 6.16.2023
OhioOhio Gadfly Daily

Senate’s budget plan moves the ball downfield on educational choice

Aaron Churchill
6.16.2023
Ohio Gadfly Daily

Senate takes aim at some CTE funding boosts proposed by Governor DeWine

Jessica Poiner
6.16.2023
Ohio Gadfly Daily

“Supplemental targeted assistance” is no way to fund schools

Aaron Churchill
6.20.2023
Ohio Gadfly Daily

Lots of new schools. How much innovation?

Jeff Murray
6.20.2023
Ohio Gadfly Daily

CREDO got it wrong: Ohio’s charter sector is strong and getting better

Stéphane Lavertu
6.15.2023
Ohio Gadfly Daily
view
Senate budget CTE funding cut blog image

Senate takes aim at some CTE funding boosts proposed by Governor DeWine

Jessica Poiner 6.16.2023
Ohio Gadfly Daily
view
Supplemental targeted assistance blog image

“Supplemental targeted assistance” is no way to fund schools

Aaron Churchill 6.20.2023
Ohio Gadfly Daily
view
Carnegie new schools report SR image

Lots of new schools. How much innovation?

Jeff Murray 6.20.2023
Ohio Gadfly Daily
view

CREDO got it wrong: Ohio’s charter sector is strong and getting better

Stéphane Lavertu 6.15.2023
Ohio Gadfly Daily
view
Senate plan school choice blog image

Senate’s budget plan moves the ball downfield on educational choice

Aaron Churchill
6.16.2023
Ohio Gadfly Daily

To use football parlance, education reform often feels like three yards and a cloud of dust. Yet sometimes the gains are bigger—a long forward pass—and that’s what the Ohio Senate’s final budget bill, which passed the chamber yesterday, would amount to. These are the key proposals in their game plan. (The next step is a huddle with House leaders likely in conference committee.)

Private school choice

The headliner of the Senate plan is universal eligibility for EdChoice scholarships, a move that would make private schools more accessible to all Ohio families. As a refresher, Ohio has long offered state-funded scholarships that cover some or all of the costs of attending private schools via the EdChoice program. Under current policy, families with incomes below 250 percent of the federal poverty level are eligible for income-based EdChoice.[1] In this year’s budget process, Governor DeWine proposed raising the income threshold to 400 percent. The House took it a step further and upped the limit to 450 percent, which would make approximately 70 to 80 percent of Ohio students eligible for income-based EdChoice (currently, about half of students are eligible).

The Senate took the final step by removing income restrictions entirely. If approved, all Ohio families would have access to financial assistance, but on a sliding scale. Instead of receiving the full scholarship amount, parents with incomes above 450 percent ($135,000 for a family of four) would receive gradually reduced amounts as their incomes rise. This approach is both more equitable—it ensures more dollars are directed to needier families—and more fiscally sensible, as it reduces some of the expense of universal eligibility (including the cost of allowing current private school students to participate). In sum, the Senate plan would empower all families to make decisions about what’s best for their kids. This move should also bring school choice’s helpful competitive effects to the most affluent school districts in Ohio.

Public charter schools

Over the past two decades, charter schools have become an integral part of Ohio’s K–12 education system. They provide parents with public, tuition-free alternatives to traditional district options. Some charters specialize in the arts or career-technical education, others focus on serving students with disabilities, others implement a classical education model, and still others have a laser-focused academic mission and are dedicated to preparing low-income students for college. In recent years, Ohio’s brick-and-mortar charters have significantly outperformed nearby district schools, especially when it comes to boosting the achievement of Black and Hispanic students.

But charters have also been severely underfunded, receiving approximately 30 percent fewer dollars than the districts in which they are located. This gap makes it harder for charters to provide supplemental supports and enrichment that can benefit students. With less funding, charters struggle to hire and retain talented teachers. It also leaves quality charters with diminished capacity to expand and reach more students.

Under the leadership of Governor DeWine, Ohio launched a program in 2019 that narrows the funding gap faced by high-quality charters. This year, 114 charters—about one-third statewide—received $1,416 per economically disadvantaged pupil and $809 per non-disadvantaged pupil in extra support through the program.[2] Recognizing the importance of these funds, the governor proposed in his budget recommendations a significant increase in high-quality charter funding. The House and Senate approved this proposal, and qualifying schools are now slated to receive $3,000 per economically disadvantaged pupil and $2,250 per non-disadvantaged pupil. In addition, the governor and both chambers of the General Assembly also increased the state’s brick-and-mortar charter facility allotment from $500 to $1,000 per pupil in this year’s budget.

The Senate added a final touch by including a new charter equity supplement that provides an additional $400 per pupil for all brick-and-mortar charters in the state, regardless of whether they receive the quality funds. Excluding the facilities dollars, the average brick-and-mortar charter statewide would be funded under the Senate plan at 83 percent of district funding—a 17 percent shortfall—while high-quality charters would be funded on average at 88 percent. It’s not quite parity, but if these moves are ratified by the conference committee, they will help ensure that charter students are funded at amounts far more comparable to their district peers. For great charter schools, it would mean approximately $2,400 more per student—one of the largest one-time increases in charter history, anywhere in the nation.

Open enrollment

Here at Fordham, we typically discuss interdistrict open enrollment, which allows students to attend schools in another school district. Barring any last-minute action, state lawmakers didn’t make any headway on requiring all districts (subject to capacity) to allow non-resident students to attend their schools. Regrettably, Ohio’s affluent suburban districts—even those with empty seats—will continue to close open enrollment options to students who might benefit from transferring to their schools.

But another important form of choice, especially in larger districts, is intradistrict open enrollment. This allows students to attend a district-run school—such as a magnet school—that is not the one assigned based on their home address. Such options appear widespread, but there is no hard data about how many students attend non-assigned district schools. A Senate provision aims to shed light on the question by requiring districts to report how many students use intradistrict open enrollment. This data should allow for a more comprehensive picture school choice in the Buckeye State.

Non-chartered private schools and homeschooling

Parents can exercise choice through two additional avenues: by enrolling their child in non-chartered, non-tax supported private schools or by homeschooling. In the last budget cycle, the legislature created a modest tax credit for families enrolling their children in non-chartered schools, which are very lightly regulated schools and cannot accept state-funded scholarships (only chartered private schools may do so). The Senate budget plan raises the current nonrefundable tax credit from $500 to $1,000 for higher-income families choosing this option and from $1,000 to $1,500 for lower-income families. These credits are intended to help offset tuition. As for homeschooling, parents will continue to be eligible for a $250 tax credit, which remains unchanged relative to current policy.

* * *

Under the Senate’s budget plan, more Ohio families will be empowered to choose the educational option that they believe best meets their child’s needs. The upper chamber proposed these reforms while also significantly increasing funding for traditional public schools by more than half a billion over the next biennium, a solid 7 percent increase compared to FY23 funding. The work to create great school options for all students isn’t yet finished. But for now, three cheers to the Senate for continuing to strengthen educational choice in Ohio.


[1] Students may be eligible for a “performance-base” EdChoice scholarship if they would otherwise attend a low-performing school. The state also has scholarship programs specifically for Cleveland students and students with disabilities.

[2] House Bill 110 of the 134th General Assembly provides $1,750 per economically disadvantaged pupil and $1,000 per non-disadvantaged for the program, but the dollars are reduced if the per-pupil funding exceeds the appropriation. That occurred in FY23 and the other years in which the program has existed.

view
Senate budget CTE funding cut blog image

Senate takes aim at some CTE funding boosts proposed by Governor DeWine

Jessica Poiner
6.16.2023
Ohio Gadfly Daily

The Ohio Senate recently introduced its version of the state budget for fiscal years 2024 and 2025. The upper chamber maintained several proposals that were introduced by Governor DeWine and passed by the House, including increased funding and expanded eligibility for school choice programs and provisions aimed at ensuring that elementary schools are using instructional methods and materials aligned with the science of reading. The Senate also deserves praise for removing some troubling additions made by the House, namely a provision that would eliminate the third grade retention requirement.

Overall, the Senate deserves plenty of kudos for its budget proposal. But not everything included in their version is praiseworthy. Specifically, the upper chamber took an axe to some proposed career-technical education (CTE) funding increases, dollars that could have improved and expanded opportunities for thousands of students across the state.

To understand these cuts in context, some background is needed. When Governor DeWine released his budget recommendations in January, it was immediately obvious that he intended to double down on his commitment to expanding and improving CTE in Ohio. He proposed boosting funding in three specific areas:

  1. Industry Recognized Credentials (IRCs) for high school students. The state has been investing funds in IRCs for high schoolers since DeWine’s first budget, which established the Innovative Workforce Incentive Program. This program provides grant funding to school districts to help them establish programs for students to earn qualifying credentials in “priority” industry sectors. To incentivize attainment, schools also receive an additional payment of $1,250 when students earn a qualifying credential.

  2. CTE enhancements. ODE identifies a host of potential program enhancements that fall under the CTE umbrella. They include—but aren’t limited to—things like apprenticeships, work-based learning, credit flexibility, and Career Connections.

  3. CTE equipment. Unlike math and English classes, which are typically taught in traditional classrooms with textbooks and Chromebooks and the like, CTE courses often require much different settings and materials. For example, the state’s engineering and science technologies and manufacturing technologies career field prepares students for college majors like engineering and robotics and/or a career as a welder, machinist, or line operator. Students need to master various competencies—essential skills—like cutting and drilling materials, splicing and terminating cables and wires, and constructing “a digital circuit based on schematics using solder and solderless techniques.” Teaching students to do these things requires a variety of tools and equipment that are expensive, and CTE providers need help from the state to afford them. Governor DeWine specifically mentioned in his state of the state address that, while visiting career centers across Ohio, he recognized that many lack the “modern, up-to-date equipment needed to teach certain courses.”

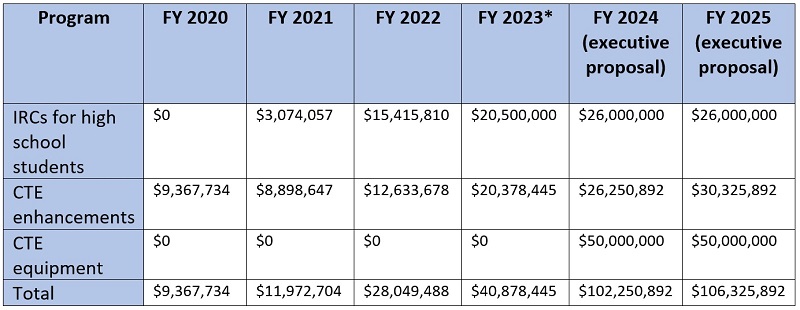
As the table below shows, CTE spending in these three areas has risen consistently during DeWine’s time as governor. His latest budget, which covers FY 2024 and 2025, proposes the state’s largest investments yet.

Senate budget CTE funding cut blog Table 1
*Amounts for FY 2023 are estimated according to state calculations found here. Note that this table does not include “categorical add-on” dollars distributed through Ohio’s main funding formula when students take CTE coursework.

When House lawmakers passed their version of the budget in April, they maintained DeWine’s proposed funding amounts for IRCs for high school students, as well as for CTE equipment. And in the area of CTE enhancements, they actually increased the dollar amount by roughly $2 million for both FY 2024 and 2025.

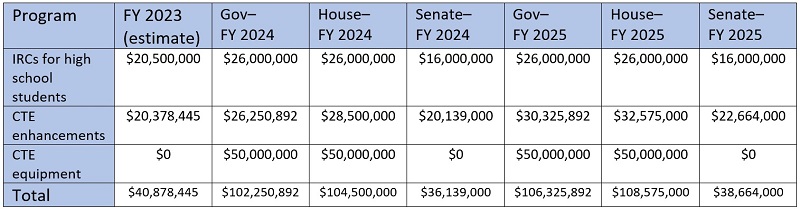
These significant boosts in funding indicate that CTE holds the same priority for the lower chamber as it does for the governor. The Senate, on the other hand, opted to trim some of the increases proposed by their colleagues. Consider the table below, which shows the dollar amount that each of the three major players in the budget process—the governor, the House, and the Senate—proposed for each of the aforementioned CTE areas according to the most recent appropriation spreadsheet.

The most obvious takeaway from the table above is that although the governor and the House proposed $50 million in each fiscal year to cover the cost of CTE equipment, the Senate did not—at least not in this particular part of the budget. It appears they included the funds for CTE equipment as an earmark in the Ohio Facilities Construction Commission budget instead, but they did so without increasing the overall dollar amount. That means they will likely cut CTE construction funding relative to the governor’s original proposal. 

Senate budget CTE funding cut blog Table 2

But that’s not the only example of the Senate being tight-fisted when it comes to CTE. Both the governor and the House proposed raising IRC funding to $26 million in FY 2024 and 2025—an increase of roughly $6 million from the estimated FY 2023 funding amount. The Senate, on the other hand, proposed reducing funding to $16 million, which would represent a decrease of approximately $4.5 million from the FY 2023 amount. The CTE enhancements category follows a similar pattern. The governor proposed boosting funding to just over $26 million in FY 2024 and slightly more than $30 million in FY 2025. The House took it a step further, and raised the governor’s proposed appropriation by roughly $2 million for each year. But the Senate kiboshed these increases by proposing fewer dollars for FY 2024, and then offering a modest increase for FY 2025. Although it’s not included in the table above, the governor also proposed—and the House maintained—up to $10 million in each fiscal year for a Work-based Learning Incentive Program that would require the Ohio Department of Education to pay public schools $1,000 for each student participating in at least 250 hours of work-based learning. The Senate eliminated that provision, too.

When considering dollar amounts in this way, it’s important to remember that budgeting is about give and take. If policymakers want to boost funding for certain programs, then that typically means that others will face cuts. The protests and praise that result from such decisions are part and parcel of the budget process, and lawmakers are likely accustomed to hearing complaints. Tuning them out is only natural.

But in the case of CTE, Ohio lawmakers would be wise to listen carefully. IRCs can lead to well-paying jobs, identify qualified job applicants for employers, and contribute to a healthy statewide economy. Ohio’s credentialing efforts are far from perfect, but there’s no denying that they’ve created opportunities for thousands of high schoolers. They’re also part of the state’s graduation requirements. There are plenty of ways lawmakers could and should improve the system, and some of those improvements will require increased funding.

CTE enhancements, meanwhile, fund delivery methods, practical learning opportunities, and student supports that can bolster career pathways programs. Such programs can be a promising option for young adults, as they’re typically more affordable than a traditional four-year university. They also offer myriad benefits—including on-the-job learning experience and job-related classroom training, boosted income, and valuable industry-recognized credentials.

Budgeting is a tough job. Everyone wants more money, and money doesn’t grow on trees. But as the Senate puts its finishing touches on its version of the budget and then gets ready for possible conference committee debates, lawmakers would be wise to remember just how important CTE programs are to students, employers, and Ohio at large. Funding them properly is crucial.

view
Supplemental targeted assistance blog image

“Supplemental targeted assistance” is no way to fund schools

Aaron Churchill
6.20.2023
Ohio Gadfly Daily

In its biennial budget plan for FYs 2024–25, the Senate—as did the House—proposed a hefty increase in K–12 education spending. Despite the overall largesse, the Senate also proposed the elimination of a funding category called “supplemental targeted assistance.” The idea raised some eyebrows among education groups, as any type of reduction—no matter how small—is rarer than a blizzard in June. The proposal could easily become a point of debate in conference committee. But what is this funding component and why should it be removed?

Simply put, these dollars are “pork.” First appearing in FY22, the component funnels $53.4 million to just thirty-six of Ohio’s 600 plus districts. To receive the special subsidy, districts must have been relatively low wealth in the state’s formula calculations and had a sizeable number of students attending non-district schools in 2019. As we all know, a lot has changed since 2019, and using historical data is the wrong way to allocate state aid. These funds aren’t tied to districts’ actual enrollments or the needs of current pupils, which are the variables that truly matter when funding schools. But somehow these districts got a special carve-out—something of a “reward” for having families exit their schools—and now receive millions in excess funding.

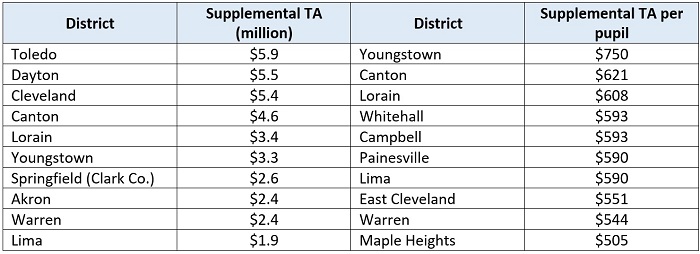
The table below shows the largest beneficiaries of these funds. In absolute dollars, Toledo Public Schools receives the most supplemental targeted assistance ($5.9 million per year), while Youngstown City Schools receives the largest allotment on a per-pupil basis ($750).

Table 1: Districts receiving the most supplemental targeted assistance (TA) in FY23

Supplemental targeted assistance blog Table 1
Source: Ohio Department of Education, district funding payment reports (FY23, June #2).

Some may argue that eliminating these funds is cruel or heartless. One superintendent told the Senate Finance Committee that losing these dollars would be “devastating.” But let’s keep four things in mind.

First, while a less-than-ideal policy, the Senate budget plan does guarantee that districts receive no less in state aid than they did in FY23.[1] Even if supplemental targeted assistance goes away, these districts won’t actually have their overall state aid cut; they’d just receive a smaller increase.

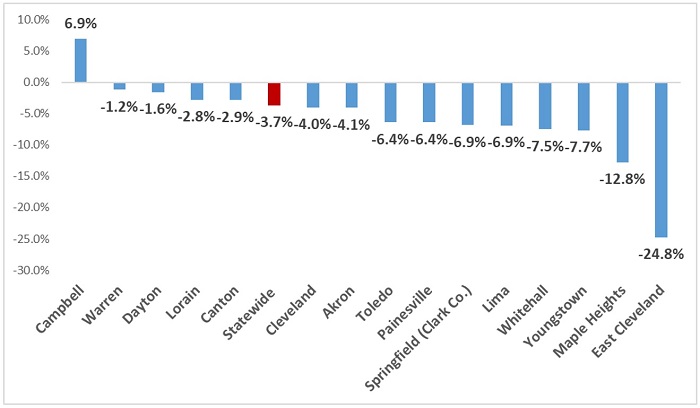
Second, most districts receiving these dollars have lost significant numbers of students in recent years. Figure 1 shows the enrollment patterns from FY20–23 for the ten largest recipients of supplemental targeted assistance, whether in absolute or per-pupil dollars. Districts, including Whitehall and Youngstown, posted enrollment losses that more than double the statewide average during this period. East Cleveland’s enrollment dropped by a stunning 25 percent in just four years. When schools are responsible for serving fewer students, especially at these rates, their educational costs should decrease, as well. How do these districts justify the need for excess state aid on top of what they already receive through the formula?

Figure 1: Change in enrollment from FY20 to FY23, largest recipients of supplemental TA

Supplemental targeted assistance blog Figure 1
Source: Ohio Department of Education, district funding payment reports (FY23, June #2).

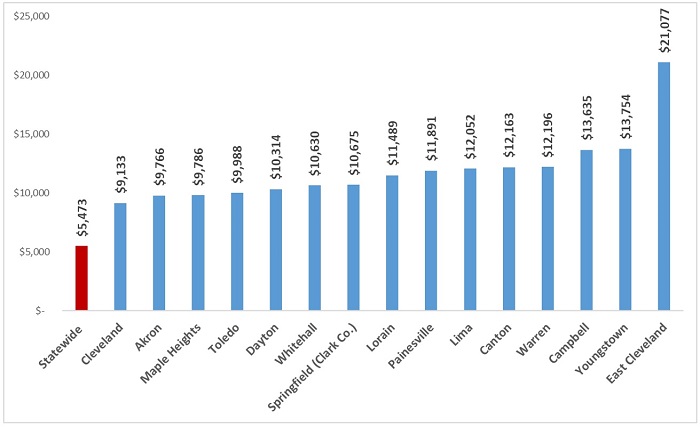
Third, districts receiving supplemental targeted assistance already receive far more in state aid than the typical Ohio district. To be clear, some of that is justified, as the funding formula intentionally drives more aid to the least-advantaged districts—and those receiving these dollars tend to be disadvantaged. But some of the state funding amounts are still quite large, even with the elimination of supplemental targeted assistance. Consider Figure 2 below, which shows funding projections under the Senate plan. Districts such as Dayton, Springfield, Lorain, Canton, and Youngstown are slated to receive $10,000 to $14,000 per pupil in state foundation funding under the Senate plan. East Cleveland could end up receiving a staggering $21,000 per pupil. Remember that this is strictly state formula funding. It doesn’t even include the millions more in local funding that districts raise (including via a minimum state-required 2 percent property tax).

Figure 2: Projected state foundation aid per pupil, Senate plan (FY 2025)

supplemental targeted assistance blog Figure 2
Source: Ohio Legislative Service Commission. Note: This figure displays state formula funding but excludes local tax revenues—another major source of funding for districts—along with several other smaller state funding streams (e.g., property tax reimbursements) and federal dollars. Districts’ FY23 enrollments are used to calculate the per-pupil amounts based on LSC’s FY25 funding estimates under the Senate plan.

Fourth, if the concern is to deliver more dollars to high-poverty schools, there are better ways to do it. Instead of shoveling money to a small number of districts—thereby excluding other high-poverty districts, such as Cincinnati and Columbus, as well as urban public charter schools—lawmakers could work to strengthen Disadvantaged Pupil Impact Aid (DPIA). This funding component delivers extra state funds to all districts and charters based on their economically disadvantaged enrollment numbers. While it’s too late in this budget to address, legislators should take steps in the future to improve DPIA by implementing a methodology that more accurately identifies low-income students. This will better ensure state aid is steered to the schools that most need the extra resources in the fairest way possible. Once a more accurate identification method is adopted, legislators could consider further increasing DPIA funding.

* * *

Removing “guarantees,” carve-outs, and special earmarks from government budgets isn’t easy political work. It’s bound to upset someone. But sometimes legislators have to put an end to them. Kudos to Senate lawmakers for seeking to root out inefficient and unnecessary spending in K–12 education. Let’s hope its proposal to scrap supplemental targeted assistance sticks.


[1] The Senate does, however, commendably eliminate funding guarantees based on historic FY20 and FY21 funding levels, in addition to eliminating supplemental targeted assistance.

view
Carnegie new schools report SR image

Lots of new schools. How much innovation?

Jeff Murray
6.20.2023
Ohio Gadfly Daily

Since the 1980s, education reform efforts have sought to shake up the stodgy, traditional landscape of public schooling in the United States. One way to do that is to start schools from scratch that can introduce innovative new education models and push traditional systems to improve. A new report from the Carnegie Corporation of New York takes a closer look at new public schools that have opened in the last three decades to identify whether that aim was achieved and define any patterns of change.

The authors select 1990 to 2020 as their timeframe, an appropriate choice given that the first charter school law was passed in Minnesota in 1991 and that the charter movement has provided the most obvious source of competitive pressure on the district establishment. Their analysis considers only district and charter public schools, both old (opened prior to 1990) and new (opened in 1990 or after). Every school they include is encompassed within one of those two categories. Certain school models, such as those in correctional facilities, are expressly excluded in the methodology described. However, while the methodology makes no mention of virtual schools either way, an interactive map of schools included in the analysis lists no virtual schools in any stat. Thus, it seems safe to assume the analysis considers only brick-and-mortar schools.

Of the 93,502 public elementary and secondary schools operating across the country in the 2019–20 school year, the authors find that 31,912 (34 percent) did not exist thirty years earlier. Of those, 7,079—more than one in five—were charter schools. All together, these new public schools are attended by nearly 17 million students, or one-third of all public school students in the country.

As to patterns, the analysts identify three waves of new school creation. The first, in the 1990s, reflects overall increases in student enrollment occurring at the time. Just 4 percent of those created in this wave were charters, as the movement was just getting started. That means most of these “first wave” schools were district schools created in high-growth states and suburbs. The second wave, in the early 2000s, shows new schools being established at a higher rate than school enrollment trends and a boost in the percentage of charters (24 percent) among them. The third, in the 2010s, shows a declining number of new schools being created, even though student enrollment was still increasing, albeit modestly. Charter schools made up 40 percent of schools created in this wave. Nevada, Arizona, and Florida led the nation in new school formation, while fifteen states (including Ohio) saw an overall decrease in total schools by 2020, despite schools continuing to be created. New schools of both types are more likely to enroll Black and Hispanic students than their older counterparts, while White students are more likely to attend older schools. These trends have accelerated in the last decade and are attributed to charter school proliferation in more and more states, which tracks with other data.

The authors surmise that all or nearly all of the new charter school creation over the period was a result of “systems change”—deliberate efforts to build something new and/or operationalize education reform principles—due to the intentionality required and the funding and regulatory hurdles that must be overcome to launch a charter. By contrast, they believe that at least one-third of new district schools created during this period were a response to enrollment pressures—either growth that required additional buildings or geographic shifts that required closing an old building in a declining location and building a new facility in a burgeoning one. And while an additional third of new district schools do appear to have been created for some reason other than enrollment concerns, the authors won’t go so far as to label that other reason as systems change. Seems wise, since systems change and districts are not typically synonymous terms.

New York City, where Carnegie is based, saw the largest number of new schools created (1,050) compared to all other districts/county systems. By 2020, 57 percent of all public schools in the city were new, serving 45 percent of the student body. The report includes a case study of the Big Apple, finding that a majority of public high school students there attended new schools in 2020 while a majority of elementary students attended schools opened prior to 1990. The average new school enrolled 452 students, compared with 744 students enrolled in older schools. For high schools, the difference was even more pronounced: 495 high schoolers attended the average new school versus 1,416 at older New York high schools. The report aligns this finding with former Mayor Michael Bloomberg’s effort to prioritize small schools. The peak of new school creation in the city occurred during the Bloomberg administration (2002–2013) and the majority in that period were new district schools. However, between 2016 and 2020, 71 percent of new schools created in the city were charter schools.

What does all this mean? Carnegie folks are very bullish on the prospect that most of these new schools reflect efforts at innovation and improved opportunities for students, as per research findings on NYC’s small school project. But traditional schools are traditional for a reason, and it is highly likely that, building-wise, districts have created more new facilities to house the same old programs than to experiment with new teaching and learning models. Luckily, we know from research that competitive pressure almost always improves district school outcomes. So to the extent that charters are growing and competition from voucher and ESA programs is increasing—and as the seismic changes from pandemic-era innovations settle into the mainstream—perhaps that bullishness is warranted.

SOURCE: Carnegie Insights, “New Schools in the United States: A Quantitative Review of Public Schools Opened During the Last Three Decades,” Carnegie Corporation of New York (May 2023).

view

CREDO got it wrong: Ohio’s charter sector is strong and getting better

Stéphane Lavertu
6.15.2023
Ohio Gadfly Daily

NOTE: The Thomas B. Fordham Institute occasionally publishes guest commentaries on its blogs. The views expressed by guest authors do not necessarily reflect those of Fordham.

Charter schools are publicly funded but independently operated schools that serve students in grades K–12. Despite receiving far less funding than traditional public schools, they’ve significantly improved the educational options for Ohio families, many of whom lack the financial means to leave ineffective district schools. Indeed, on average, brick-and-mortar charters’ educational benefits are substantial—particularly for students from low-income households.

That’s not my opinion—it’s based on objective data analysis. Using rigorous statistical methods, my 2020 analysis of Ohio’s charter schools indicated that students attending brick-and-mortar charters between 2016 and 2019 were way better off than they would have been had they attended district schools. They learned more each year, were less likely to be absent, and were less likely to be suspended—all because they attended a charter school instead of a nearby district school. These effects were large, implying that students would receive the equivalent of an extra year’s worth of learning (180 days!) if they attended charter schools instead of their district schools from grade four to grade eight. The gains were largest for Ohio’s Black and Hispanic students.

Unfortunately, a false narrative about Ohio’s charter schools can emerge when one presents the data the wrong way. Recently, Education Week reported on a new study by CREDO, based on 2015–2019 data across thirty-one states, which found that charter schools across the nation generally outperformed traditional public schools. But the study also stated that Ohio charter students lost ground in math compared to otherwise similar students attending nearby district schools. Even worse, the article stated “Ohio charter schools saw the largest drop” in mathematics achievement (relative to nearby district schools) among the states in the study.  Subsequently, The Center Square, an Ohio statehouse news outlet, used those results to build a case against funding school choice in Ohio.

How on earth could CREDO come to that conclusion? After all, like my study, CREDO uses rigorous statistical methods that compare the learning rates of charter students to those of similar students in the same district (students with the same baseline achievement, same demographic characteristics, similar household income, and so on). We also use the same dataset. Did one of us make some sort of coding error when running our statistical models?

There are two reasons that CREDO’s report makes it look as if Ohio’s charters are doing poorly relative to charters in other states. First, while they include students attending brick-and-mortar charter schools in their analysis, they combine those brick-and-mortar charter students with students who learned remotely via online schools, as well as those who attended specialized schools (such as “dropout-recovery” schools for at-risk kids and schools that serve almost exclusively students with disabilities). Unfortunately, lumping all these schools together obscures the strong results of Ohio’s brick-and-mortar charter schools. Second, their estimates are based on averaging effects across five years (2015–2019) and do not capture the substantial improvement in Ohio’s charter sector during that time span—following Ohio’s major regulatory reforms that greatly increased the accountability for charter schools. I address each of these important problems in turn.

Online charters

The pandemic made clear to everyone—particularly parents and teachers—that online schooling is tough. Prior research has long shown that students tend to learn far less when schooling occurs online—particularly those who lack the proper supports at home. Parents often have very good reasons to enroll their kids in online schools. Perhaps their kids were bullied. Or perhaps the local district school is too far away or does not offer the curriculum they need. But the tradeoff is that most students learn much less online, particularly in mathematics. And because all online schools were technically “charter schools” during their period of study, CREDO’s analysis must compare the achievement of students in online charter schools to the achievement of students attending district schools in person. When doing so, they find that online charter students nationally lose an equivalent of fifty-eight days per year of learning in reading and 124 days in math. States with relatively large enrollments of online students would, therefore, appear worse when they are included in such an analysis.

And that’s exactly what CREDO found. For example, of the nine states they list as top performers for posting superior gains in math and reading, five don’t allow online charter schools (Massachusetts, New Jersey, New York, Rhode Island, and Tennessee). Of the two states where charters have negative impacts in math—Ohio and South Carolina—both have by far the highest share of online enrollments (more than double the average rate of online schooling across all states in CREDO’s sample). In addition to the 25 percent of Ohio charter students attending online schools and the approximately 60 percent attending brick-and-mortar schools providing a general education, Ohio’s remaining 15 percent of charter students in 2019 attended a school that caters primarily to students with special needs. Again, in CREDO’s study, these charter schools are compared to regular district schools, but it’s not quite clear whether that’s an appropriate comparison.

There is no doubt that comparing Ohio (with lots of online charter students) to, say, Massachusetts (with no online charter students) creates a false impression about the relative effectiveness of their charter sectors. And Dr. Raymond, CREDO’s director, knows it. The Education Week article states “Data from the online schools drag down the average performance for students in all charter schools, Raymond said.” So why combine students across sectors? Why not create a more apples-to-apples comparison across states? Why not compare Massachusetts brick-and-mortar schools to Ohio’s brick-and-mortar schools, for example? That would provide clearer insight into how the schools that most families consider an option for their children perform from state to state. As noted above, Ohio’s brick-and-mortar charters would likely stack up well against other locales.

Annual improvements

Even if you agree with CREDO that online and in-person schools should be combined,[1] CREDO’s analysis is still misleading. That is because CREDO’s analysis generates estimates based on data pooled across 2015–2019. Any improvements in a state’s charter sector that occurred during that span would be obscured—weighed down by the lower quality of the sector in early years.

That’s particularly problematic for Ohio. In 2015, the Ohio General Assembly enacted a rigorous set of reforms that greatly increased accountability for charter school authorizers (called “sponsors” in Ohio); included provisions that sought to improve online charter schools and the financial management of all charters; and required more transparency around the practices of charter operators—the organizations that many Ohio charter school boards contract with to run their schools.

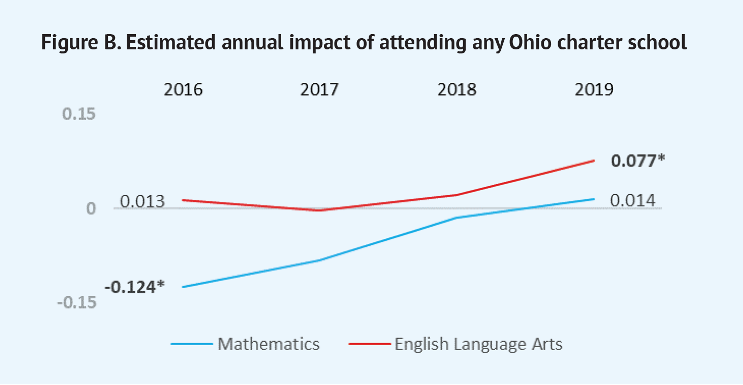
Ohio arguably went from having one of the least-regulated charter sectors in the nation to having a far more accountable sector. From 2015 to 2019, dozens of low-performing schools and operators were shut down, and the better ones remained, leading to a dramatically improved overall charter sector. The figure below—drawn from my 2020 report—documents this improvement in annual learning among all Ohio charter students (both brick-and-mortar and online schools).
1

The figure indicates that, in 2016, charter students learned far less math annually than similar students in their district schools (0.124 standard deviations less). That effect is as if students had received seventy-two fewer days of instruction annually than if they had attended their local district school. Averaging estimates across 2016–2019, the charter school disadvantage is equivalent to about thirty-two fewer days’ worth of learning in mathematics annually. That is just slightly different than the thirty-eight fewer days of annual learning that CREDO estimated across 2015–2019.

Yet we care much more about 2019 than 2015. In 2019—across all charter students (including the online and special education students)—students in Ohio’s charter schools had, on average, the equivalent of forty-five extra days’ worth of learning in English language arts (a 0.077 standard-deviation gain). And, though not statistically significant, it appears they also gained eight extra days’ worth of learning in mathematics. Those results are masked when the data are combined across multiple years.

There is much to admire about CREDO’s latest report. The statistical methods are rigorous; it provides a wealth of information (including estimates of the quality of specific charter management organizations and school networks); and the general take-home point, that charters across the nation are improving and that they provide an important alternative to traditional district schools, is welcome. I also don’t doubt that Dr. Raymond’s inclusion of both online and in-person students comes from a good place—a concern that we should ensure that charters serve all students well. But the lack of attention to Ohio’s context is careless and needlessly perpetuates a false narrative. Upon closer inspection, we see that Ohio’s brick-and-mortar charters are strong performers—and getting better.


 

[1] After all, the achievement of students in online schools, as well as the achievement of at-risk students, is just as important as the achievement of students attending brick-and-mortar charter schools in person. Improved test scores in math and English language arts are strong predictors of students’ future income and wellbeing, and they are predictors of economic growth—affecting us all.

Fordham Logo

© 2026 The Thomas B. Fordham Institute
Privacy Policy
Usage Agreement

National

P.O. Box 110
Burke, VA 22009

202.223.5452

[email protected]

Ohio

P.O. Box 82291
Columbus, OH 43202

614.223.1580

[email protected]

Sponsorship

130 West Second Street, Suite 410
Dayton, Ohio 45402

937.227.3368

[email protected]