Mobile Navigation

  • National
    • Policy
      • High Expectations
      • Quality Choices
      • Personalized Pathways
    • Research
    • Commentary
      • Gadfly Newsletter
      • Flypaper Blog
    • Events
    • Scholars Program
  • Ohio
    • Policy
      • Priorities
      • Media & Testimony
    • Research
    • Commentary
      • Ohio Education Gadfly Biweekly
      • Ohio Gadfly Daily
  • Charter Authorizing
    • Application
    • Sponsored Schools
    • Resources
  • About
    • Mission
    • Board
    • Staff
    • Career
Home
Home
Advancing Educational Excellence

Main Navigation

  • National
  • Ohio
  • Charter Authorizing
  • About

Ohio Menu

  • Topics
    • Accountability & Testing
    • Advanced Education
    • Career & Technical Education
    • Charter Schools
    • Curriculum & Instruction
    • ESSA
    • Evidence-Based Learning
    • Governance
    • Personalized Learning
    • Private School Choice
    • School Finance
    • Standards
    • Teachers & School Leaders
  • Research
  • Policy
  • Commentary
    • Ohio Gadfly Newsletter
    • Ohio Gadfly Blog
    • Events

The Education Gadfly Weekly

Sign Up to Receive Fordham Updates

We'll send you quality research, commentary, analysis, and news on the education issues you care about.
Thank you for signing up!
Please check your email to confirm the subscription.

Ohio Gadfly—Ohio should look to other states for good policy ideas

Volume 19, Number 19
9.15.2025
9.15.2025

Ohio Gadfly—Ohio should look to other states for good policy ideas

Volume 19, Number 19
view
IRC revamp recs blog image
Standards & Accountability

When revamping its industry-recognized credential framework, Ohio should look to other states

Ohio is going back to the drawing board to revamp how high school students can use industry-recognized credentials to graduate. Here are two critical fixes and how other states have successfully addressed them.

Jessica Poiner 9.15.2025
OhioOhio Gadfly Daily

When revamping its industry-recognized credential framework, Ohio should look to other states

Jessica Poiner
9.15.2025
Ohio Gadfly Daily

Ohio should emulate Indiana on equitable charter school funding

Aaron Churchill
9.12.2025
Ohio Gadfly Daily

Examining teacher vacancies in rural school districts and how they’re filled

Jeff Murray
9.16.2025
Ohio Gadfly Daily

Revisiting research on who gets into elite colleges and how it affects their lives

Jeff Murray
9.11.2025
Flypaper
view
Local funding - Indiana blog image

Ohio should emulate Indiana on equitable charter school funding

Aaron Churchill 9.12.2025
Ohio Gadfly Daily
view
Rural teacher applicants SR image

Examining teacher vacancies in rural school districts and how they’re filled

Jeff Murray 9.16.2025
Ohio Gadfly Daily
view
School graduation

Revisiting research on who gets into elite colleges and how it affects their lives

Jeff Murray 9.11.2025
Flypaper
view
IRC revamp recs blog image

When revamping its industry-recognized credential framework, Ohio should look to other states

Jessica Poiner
9.15.2025
Ohio Gadfly Daily

A rapidly rising number of Ohio students are earning industry-recognized credentials (IRCs). This should be good news, as IRCs can boost earnings and employment if they are high-quality and tied to in-demand jobs. But a closer look at state data reveals that many of the credentials Ohio students are earning don’t take much time or effort to obtain. Moreover, they lead to industries and jobs that pay relatively low wages. There are credentials with the potential to provide long-term benefits. But those aren’t the ones Ohio students are most likely to earn.

Ohio’s uptick in attainment—and the questionable quality of its most-earned credentials—can be explained as an unintended consequence of well-meaning state policy. For years, students have been permitted to meet high school graduation requirements by earning a 12-point credential or “bundling” a group of credentials in the same career field that added up to 12. The problem was that these IRCs weren’t consistently or transparently linked to data on wages, job outlook, or employer demand. Absent such data, there was little evidence indicating that the lower-point credentials students could bundle to graduate were actually benefiting them in the long run. But that didn’t stop some of Ohio’s largest districts from funneling students toward these easy-to-earn IRCs in an effort to boost graduation rates.

In short, Ohio lawmakers needed to go back to the drawing board. They did so via the recently passed state budget, which eliminates the point system and requires the committee to establish new criteria for how students can use credentials to graduate. If the committee wants to get things right this time around, it needs to do two things: 1) establish a system that accurately and transparently identifies IRC value and 2) develop a process for revalidating IRCs over time.

Fortunately, Ohio doesn’t have to start from scratch. Credentials of Value, a recently published report from Advance CTE, offers plenty of insight into how other states have tackled these two tall tasks. Let’s take a closer look at each.

1. Establishing a system that accurately and transparently identifies credential value.

Meaningful credentials are those that offer students a return on investment. There are plenty of ways to measure such returns, but one of the most important is whether a credential has value to employers. If an IRC doesn’t help students get their foot in the door in a growing career field, set them apart from other job applicants, or incentivize employers to offer them higher wages, then it’s probably not worth their time. To be clear, Ohio’s credential approval process under the point value system did involve a labor market audit and an industry feedback survey. But the new process needs to be much more in-depth and transparent.

The Credentials of Value report offers several ideas from other states that could help Ohio craft a better system. For example, when validating credentials during its approval process, Wyoming asks employers two specific questions: 1) If a learner comes to you with this credential, would you monetarily incentivize them? 2) If a learner comes to you with this credential in a hiring situation in which all things are equal, will this credential give them hiring preference? A minimum of ten employers must answer both questions affirmatively before a credential can be approved for the state list. Tennessee evaluates IRCs using a “robust scoring rubric” that measures credentials against high-skill, high-wage, and in-demand occupation definitions and cross-references labor market trends. And in South Dakota, leaders have leveraged real-time data from the state labor agency to review job listings from across the state and determine the required credentials employers are seeking for specific occupations.

Employer demand isn’t the only measure that matters. Ohio officials should also pay particular attention to wages. Florida considers whether credentials are tied to occupations that meet wage thresholds within specific economic regions, rather than a statewide wage benchmark that could be influenced by areas with particularly high or low costs of living. Given Ohio’s size and regional diversity, Buckeye leaders should consider following suit. Meanwhile, both Michigan and New Hampshire reported using the Living Wage Calculator created by the Massachusetts Institute of Technology to determine “family-sustaining wages” while identifying the value of credentials. For Ohio, looking to a trusted expert source—rather than relying on in-house calculations—would be a positive step toward transparency.

2. Developing a system for revalidating credentials over time.

The labor market is constantly evolving. A credential that’s in demand and leads to a well-paying job in 2025 could be obsolete by 2030. Ohio leaders should prepare for this possibility by proactively developing a system through which credentials are regularly reevaluated over time.

Once again, the Credentials of Value report offers some intriguing examples from other states that Ohio leaders could consider. For example, Maryland ensures that its state-approved credential list contains only IRCs of value by putting credentials through a rigorous vetting process every two years. South Dakota has a statewide advisory board that reviews credentials annually, and its revalidation process intentionally mirrors the initial credential approval process. Wisconsin and Kentucky collect employment-related outcomes data to review the return on investment for credential earners. And Colorado ties its reevaluation of approved credentials to the state’s Talent Pipeline Report, which is updated annually and identifies areas of growing demand.

***

Ohio policymakers deserve credit for their willingness to go back to the drawing board with credential approval. But calling for a new framework is the easy part. Creating a better one will be much more difficult, and getting it right is more important than ever. Fortunately, there’s no reason to start from scratch. Advance CTE’s recent report offers plenty of ideas from other states. Here’s hoping Ohio leaders are willing to take a closer look.

view
Local funding - Indiana blog image

Ohio should emulate Indiana on equitable charter school funding

Aaron Churchill
9.12.2025
Ohio Gadfly Daily

A core principle of fair school funding is that dollars should follow students to the schools they attend. This was the recommendation of a renowned group of education leaders, who two decades ago called for a system in which “funding from all levels follows every student to whatever public school he or she attends.” Here in Ohio, one of the main ideas behind the acclaimed Cupp-Patterson school funding plan is that “dollars flow directly to where students are educated.”

The concept makes perfect sense. The school bearing the responsibility—and the cost—of educating a student should receive the per-pupil allotment for her education. This principle should apply to traditional districts. For instance, when students transfer from Columbus to Westerville (or vice versa), dollars should move with them. It should also apply for schools of choice. Public charter schools, along with regional STEM and career-tech schools, should receive full per-pupil funding when students enroll. In a truly “sector agnostic” system, private schools would also be included.

Unfortunately, Ohio has long struggled to follow this principle. Despite their adoption of the Cupp-Patterson formula, state lawmakers continue to hand out “guarantees” to school districts. These extra subsidies, which amount to hundreds of millions of dollars, undermine an enrollment-driven formula by shielding districts from funding reductions when students are no longer enrolled. This funding of “empty desks,” instead of actual students, reduces the availability of state dollars for districts that are growing and in need of additional resources.

Another egregious violation of the funds-follow-students principle happens at the local level. In Ohio (and most other states), local taxpayer funds stay with the district, rather than travelling with students when they choose non-district alternatives such as public charter schools. Of the $12 billion that Ohio districts generate in local taxpayer support, charters receive next to nothing. Their lack of local funding results in significant shortfalls relative to their district counterparts. Considering all funds—including both state and local—Ohio charter students are funded on average at about 23 percent less than their peers attending district schools.

Shortchanging charter students is hardly fair, but the notion that local funds move with them is a political third rail. School districts have long viewed these dollars as “theirs,” and some have even accused charters of taking them when, in fact, no money was moving. In the face of this opposition, few have dared to fight the uphill battle against their financial interests. Today, despite serving almost 90,000 students—along with strong evidence that they deliver a superior education—Ohio’s brick-and-mortar charters remain almost entirely shut out of local funding. The only exception is nine Cleveland schools that received a mere $6 million out of the Cleveland Metropolitan School District’s $284 million in local tax revenues in 2024.[1] The other roughly 310 charter schools in Ohio received goose eggs.

Breaking the status quo in Ohio will be a politically fraught undertaking. But a handful of other states are showing that local revenue sharing can be done. In most of these cases, districts are required to provide a portion of local facility dollars to charters (but not the larger pot of local revenues that cover operational expenses). Florida, for instance, requires school districts to share a portion of facility-related local revenues and provided about $56 million to charter schools for their capital needs in 2024.

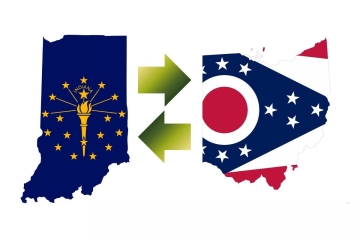
An even more ambitious effort is underway in Indiana. For those unfamiliar, Hoosier State lawmakers in 2023 began requiring certain districts to provide charters with a share of local operational funding, proportional to their enrollments. The legislation was initially quite narrow, as it applied to charters in just four counties, including those encompassing Indianapolis and Gary. Moreover, charters’ share of local funding was limited to any revenue growth moving forward, whether via levy passage or increased valuations. It did not apply to existing local tax revenues.

Earlier this year, the Indiana legislature took it a step further. Under recently passed legislation, the state now ensures that practically every Indiana charter school receives a proportional share of all local revenues—both existing funds and additional growth. This more comprehensive revenue-sharing requirement is being phased in over four years starting in 2028. The Mind Trust, an Indiana-based education group, expects Indianapolis charters to receive some $3,750 per pupil in local revenue by 2031, which will bridge a substantial portion of the city’s charter funding gap.

Ohio lawmakers should take a page from path-breaking states such as Indiana and begin providing charter schools with a share of local dollars. Under an Indiana-like approach, Columbus’s 70-plus charters, which serve nearly 30 percent of the city’s public school students, would receive more than $175 million per year (or some $9,000 per pupil). That would make a huge dent—maybe even erase—the charter funding gap in that city, and others, too.[2]

Some may see a robust local revenue-sharing requirement as a pie-in-the-sky idea. Perhaps. And if so, the onus remains on Ohio lawmakers to keep boosting state aid for charter schools to offset the absence of local dollars. Yet other states—building on principles of fair funding—have forged a pathway toward equitable charter funding that Ohio can and should emulate.


[1] These funds were received through a unique (for Ohio) revenue-sharing agreement called for under the Cleveland Plan and authorized under Revised Code 5705.21.

[2] If public charter schools begin to receive a proportional share in local funding, state lawmakers would need to modify charters’ funding formula to reflect their receipt of local dollars.

view
Rural teacher applicants SR image

Examining teacher vacancies in rural school districts and how they’re filled

Jeff Murray
9.16.2025
Ohio Gadfly Daily

Claims of teacher shortages in recent years are more complex than the typical rhetoric suggests. Digging into limited labor market data helps uncover particular scarcities—and surpluses—depending on subject, grade level, student type, and teaching location. New research exploring the staffing processes in rural districts helps illustrate the nuance required to both assess and address the challenges specific to those schools.

Researchers Se Woong Lee and Minseok Yang (the latter a Fordham-AEI EEPS alum) use data from the Wisconsin Education Career Access Network (WECAN), a centralized system for Badger State districts to post teacher—and other—vacancies, and for hopeful candidates to upload their applications for those jobs. More than 95 percent of districts use the system, thus providing a trove of data from across the state. They analyze WECAN job postings and applications from 2014 to 2016. Interestingly, some charter and private schools also use the system today, but it is unclear whether they did so in the previous decade. Either way, Lee and Yang focus their study only on full-time teaching positions in traditional districts. That still results in more than 390,000 application-year observations, representing 41,300 teacher candidates who applied for 26,600 vacancies across 404 districts. Staffing records from the Wisconsin Department of Public Instruction provide data on final hiring decisions. Their analysis separated districts into four different typologies—rural, town, suburban, and urban—and compared the numbers and characteristics of applicants and hirees for teaching jobs in the various locales. They also used a mapping tool to determine the distance between applicants’ reported home addresses and the schools to which they applied.

The first big finding: 62 percent of applicants did not apply for vacancies in any rural school, while 6 percent applied exclusively to rural schools. The remainder listed themselves as geographically flexible and showed that to be true by applying to schools of multiple types. The median number of applications received per teacher vacancy in rural districts was nine, compared to eight for urban districts, ten for town districts, and 14 for suburban districts. Their analysis indicates that distance from an urban area seems to be driving this pattern: the farther away a job is from the city, the fewer candidates who apply. Additionally, math and special education teaching vacancies, regularly reported to be the hardest jobs to fill, received lower than the median number of applications across the board with minimal difference based on district type.

Female, non-white, and highly-qualified teachers (as determined by factors like years of experience, degree attainment, and college GPA) all demonstrated reduced inclination to apply for rural jobs. Conversely, individuals with prior rural teaching experience and graduates of rural-based teacher preparation programs exhibited a higher inclination to apply for such jobs. It is perhaps not surprising to learn that applicants to rural schools tend to live much further away (median 39 miles) from the districts to which they are applying, compared to those applying for suburban or urban jobs.

As to hiring, women, teachers with less than three years of experience, and those possessing master’s degrees were more likely to be hired by rural districts than by other district types. The authors speculate that the latter finding is probably due to the fact that so few of them apply to rural schools so they are quickly snapped up whenever possible. Internal applicants (defined as those who currently or previously worked in the district to which they are applying) were 5.9 percentage points more likely to be hired in a rural district than at any other district, and candidates with rural teaching experience or who graduated from a teacher prep program in a rural area also were more likely to be hired in rural districts than in urban or suburban districts.

Lee and Yang note a couple of limitations to their work relating to details of both the supply and demand sides of the equation. How many other candidates declined an offer before the final candidate accepted? Do novice teachers really want rural jobs or are those simply the easiest for them to get? Etc. The age of the data also raises questions about its applicability to today’s employment ecosystem, not to mention the impact of public school/district enrollment declines and growth in the charter and private school sectors. Even so, Wisconsin’s geography hasn’t changed much since 2016, with more than half of districts still defined as rural and encompassing 30 percent of the population. Concern regarding teacher vacancies in those schools has only increased in the last ten years, and the findings here echo those of other analyses showing a nuanced picture of hiring in specific places and subjects.

Based on their findings, the authors assert that “grow your own” programs and efforts to bring pre-service teachers into rural schools for internships or job shadowing would be beneficial policies for district leaders to implement. At the state level, paying all candidates during their student-teaching period, providing funds for hiring bonuses in hard-to-staff positions, and increased support to rural-focused teacher-preparation programs are also suggested as ways to help boost the number and diversity of applicants for rural teaching vacancies.

SOURCE: Se Woong Lee and Minseok Yang, “Who Is Applying to and Being Hired by Rural Schools? What Vacancy and Application Data Reveal About the Rural Teacher Labor Market,” Educational Evaluation and Policy Analysis (August 2025).

view
School graduation

Revisiting research on who gets into elite colleges and how it affects their lives

Jeff Murray
9.11.2025
Flypaper

Every once in a while, an older research paper pops back into the discourse unexpectedly and invites another look. A 2023 NBER working paper analyzing the determinants and effects of attending America’s most elite colleges has been recently updated, and has gained attention anew as many on the political right continue to call into the question the influence that such institutions have in America, amid a broader discussion of the value of college.

National Bureau of Economic Research (NBER) heavyweights Raj Chetty, David Deming, and John Friedman used five different sources to build their dataset: federal income tax records on parents and children’s incomes from 1996–2021; 1098-T tax forms on college attendance from 1999–2015; Pell grant records from the Department of Education’s National Student Loan Data System from 1999–2013; standardized test score data from the College Board every year from 2001–2005 and every other year from 2007–2015, as well as ACT scores from 2001–2015; and admissions records for undergraduate first-year students spanning subsets of years from 1998–2015 from a list of private and public colleges. That list has two parts. What’s sometimes termed “Ivy-Plus” consists of the eight Ivy League schools plus Stanford, MIT, Duke, and the University of Chicago. All colleges in the University of California (UC) and California State University (CSU) systems, as well as all four-year public institutions in Texas, were labeled as a “flagship public colleges” comparison group. These data sources were linked together, and all analyses were conducted using the linked, anonymized, individual-level dataset.

The headline finding was that children from families in the top 1 percent of the income distribution were more than twice as likely to attend an Ivy-Plus college as those from middle-income families with comparable SAT/ACT scores. Two-thirds of this gap was due to higher admission rates for students from high-income families with test scores comparable to their lower-income peers; the remaining third was due to differences in rates of application and matriculation among the two groups. By comparison, children from the highest-income families demonstrated no such admissions advantage at the flagship public colleges. To be fair, flagship public colleges also admit a larger share of students from top 1 percent families than from middle-income families, but the gap there is driven almost entirely by disparities in application rates rather than anything to do with admissions.

Chetty and colleagues also used their longitudinal data to show that attending an Ivy-Plus college instead of a flagship public college on average boosted students’ chances of reaching the top 1 percent of the earnings distribution by 50 percent, nearly doubled their chances of attending an elite graduate school, and almost tripled their chances of working for a prestigious employer. Interestingly, “prestigious” is defined here as an employer that disproportionately employs students from Ivy-Plus colleges, which is somewhat circular and does raise a question or two about the findings. More on this below.

The high-income admissions advantage at Ivy-Plus colleges was driven by three factors, two of them pretty obvious: preferences for admitting children of alumni and athletic recruitment (think: “rich kid” sports like crew, squash, etc.). The third—weighting placed on non-academic credentials like “extracurricular activities, leadership traits, etc.”—is one sure to raise hackles among proponents of meritocracy. In fact, all three factors are uncorrelated or negatively correlated with post-college outcomes, whereas academic credentials such as SAT/ACT scores are highly predictive of post-college success. As Chetty and team lay it out, students of equal academic ability are being shut out of elite colleges because such ability is systematically subsumed beneath highly gameable non-academic admissions factors. And that’s a problem, not only for higher education, but also for our society at large.

To illustrate the problem, the researchers tweaked their formula to reflect a putative admissions policy without the advantage that arises from the highly-weighted non-academic factors enjoyed by students from high-income families. This change reduced the percentage of admitted students from the highest income category from 15.8 percent of the actual admitted student body to 11.1 percent of the hypothetical admitted student body. The places thus vacated could be readily filled by lower-income students with a high likelihood of college achievement based on their SAT/ACT scores. Assuming a similar distribution of outcomes (graduate school attendance, employment, income level, etc.) for the new, more-diverse cohort, the many post-college advantages of an Ivy-Plus degree are projected to be distributed beyond top income families where they are currently concentrated.

Fast forward to today: Would a change like this—leading to the diversification of society’s future leaders, per the report’s title—be enough to turn down the heated rhetoric aimed at these elite institutions? The current administration in Washington seems to be on a mission to find out, although it is hedging its bets by also trying to change the academic culture, which could easily impact the Ivy-Plus “advantage” for whomever might earn it—although not in the way this report’s authors envision it.

SOURCE: Raj Chetty, David J. Deming, and John N. Friedman, “Diversifying Society’s Leaders? The Determinants and Causal Effects of Admission to Highly Selective Private Colleges,” National Bureau of Economic Research (first published July 2023; updated August 2025).

Fordham Logo

© 2026 The Thomas B. Fordham Institute
Privacy Policy
Usage Agreement

National

P.O. Box 110
Burke, VA 22009

202.223.5452

[email protected]

Ohio

P.O. Box 82291
Columbus, OH 43202

614.223.1580

[email protected]

Sponsorship

130 West Second Street, Suite 410
Dayton, Ohio 45402

937.227.3368

[email protected]