Mobile Navigation

  • National
    • Policy
      • High Expectations
      • Quality Choices
      • Personalized Pathways
    • Research
    • Commentary
      • Gadfly Newsletter
      • Flypaper Blog
    • Events
    • Scholars Program
  • Ohio
    • Policy
      • Priorities
      • Media & Testimony
    • Research
    • Commentary
      • Ohio Education Gadfly Biweekly
      • Ohio Gadfly Daily
  • Charter Authorizing
    • Application
    • Sponsored Schools
    • Resources
  • About
    • Mission
    • Board
    • Staff
    • Career
Home
Home
Advancing Educational Excellence

Main Navigation

  • National
  • Ohio
  • Charter Authorizing
  • About

Ohio Menu

  • Topics
    • Accountability & Testing
    • Advanced Education
    • Career & Technical Education
    • Charter Schools
    • Curriculum & Instruction
    • ESSA
    • Evidence-Based Learning
    • Governance
    • Personalized Learning
    • Private School Choice
    • School Finance
    • Standards
    • Teachers & School Leaders
  • Research
  • Policy
  • Commentary
    • Ohio Gadfly Newsletter
    • Ohio Gadfly Blog
    • Events

The Education Gadfly Weekly

Sign Up to Receive Fordham Updates

We'll send you quality research, commentary, analysis, and news on the education issues you care about.
Thank you for signing up!
Please check your email to confirm the subscription.

Ohio Gadfly—The fair school funding plan is hurting open enrollment

Volume 18, Number 12
6.4.2024
6.4.2024

Ohio Gadfly—The fair school funding plan is hurting open enrollment

Volume 18, Number 12
view
Budget pt 3 - Open enrollment funding blog image
School Funding

Ohio’s school funding formula is hurting open enrollment

Changes to the way districts are funded when they accept open enrolled students from outside their borders threatens to shrink a popular and important public school choice program. This longstanding option must remain widely available and robust.

Aaron Churchill 6.4.2024
OhioOhio Gadfly Daily

Ohio’s school funding formula is hurting open enrollment

Aaron Churchill
6.4.2024
Ohio Gadfly Daily

For principal apprenticeships, look to the Peace Garden State

Jessica Poiner
6.3.2024
Ohio Gadfly Daily

Give Ohio teachers control over their own retirement

Aaron Churchill
5.22.2024
Ohio Gadfly Daily

The impact of private schooling on students’ civic engagement

Jeff Murray
6.4.2024
Ohio Gadfly Daily

Digging in to the 2024 Charter School Ecosystem Rankings

Jeff Murray
6.4.2024
Ohio Gadfly Daily

Five things we learned this school year

Tim Daly
5.30.2024
Flypaper
view
Principal apprentice program blog image

For principal apprenticeships, look to the Peace Garden State

Jessica Poiner 6.3.2024
Ohio Gadfly Daily
view
STRS blog image

Give Ohio teachers control over their own retirement

Aaron Churchill 5.22.2024
Ohio Gadfly Daily
view
Private schools and civics outcomes image

The impact of private schooling on students’ civic engagement

Jeff Murray 6.4.2024
Ohio Gadfly Daily
view
EFI charter ecosystem SR image

Digging in to the 2024 Charter School Ecosystem Rankings

Jeff Murray 6.4.2024
Ohio Gadfly Daily
view
Young teacher talking with teenager students seating in a circle at school

Five things we learned this school year

Tim Daly 5.30.2024
Flypaper
view
Budget pt 3 - Open enrollment funding blog image

Ohio’s school funding formula is hurting open enrollment

Aaron Churchill
6.4.2024
Ohio Gadfly Daily

This is third in a series in which I examine issues in K–12 education that Ohio leaders should tackle in the next biennial state budget. Previous pieces covered the science of reading and funding for low-income pupils. This essay looks at the way Ohio funds interdistrict open enrollment students.

Since 1989, Ohio has allowed students to attend public schools outside of their home district through interdistrict open enrollment. Under this policy, a student living in Columbus, for instance, can enroll in the neighboring Reynoldsburg school district (and vice-versa). Over the years, a growing number of families have availed themselves of this opportunity and roughly 77,000 students select this option today. Students may be using the program to access schools that offer special programs or courses not offered by their home district. In rural areas, open enrollment may be the only alternative available. And no matter where a student lives, it allows them to attend a different school without needing to call the U-Haul and change homes. As for impacts on learning, a 2017 Fordham study indicates that students, particularly those from less advantaged groups, make academic gains when they open enroll.

Ohio has always allowed districts to choose whether to accept open enrollees, and about four in five do voluntarily participate. Yet in a non-mandatory system, funding is crucial as the dollars tied to open enrollment students serve to incentivize district participation. Unfortunately, as discussed below and previously on this blog, state lawmakers made a misstep in open enrollment funding under the recently enacted Fair School Funding Plan. As data and media accounts suggest, the policy change is putting the program in jeopardy. In the next biennial budget, state lawmakers should restore Ohio’s traditional approach to funding open enrollment.

How open enrollment was previously funded

Under the former version of the state funding formula, open enrollment students were funded at a simple, flat amount. In the last year the old formula was used (FY21), districts across the board received $6,020 per open enrollment student in state funds. This straightforward approach made clear to districts the financial incentive to accept an open enrollee, and the per-pupil amounts were large enough that they likely exceeded the costs of serving additional students (especially in districts not at full capacity). The former approach to funding was clear, straightforward, and helped ensure that districts were covered financially when they decided to permit open enrollment and serve more students.

Recent changes via Fair School Funding Plan

First implemented in FY22, Ohio’s new funding model now treats open enrollees as if they were resident students of the district. Though there is some logic to that approach, the change has significantly cut the funding tied to most open enrollees. The reason: While open enrollment students were previously funded at the full base amount (e.g., $6,020 in FY21), they are now funded at a certain percentage of the base amount. That resulted in particularly sharp declines for more affluent districts—arguably the ones both most in demand, and most in need of convincing to take students from outside their boundaries. But it also reduced funding in average wealth districts, as well, many of which serve Ohio’s rural and small town communities where open enrollment has been relatively common. The new system is also more complicated, making it hard to determine with certainty the precise amounts that open enrollees will bring with them.

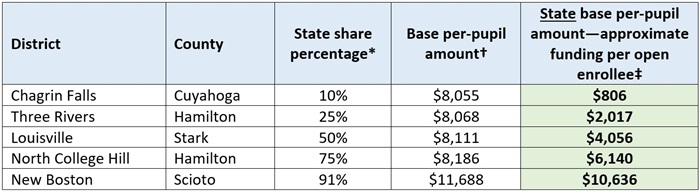
To illustrate, consider table 1, which shows five districts of varying wealth, with Chagrin Falls being the wealthiest and New Boston the poorest. The column shaded in green is key, as it approximates the per-pupil funding of general-education[1] open enrollees attending these districts. In Chagrin Falls, the district receives just $806 per open enrollee—well below what it would have received under the old formula. In Three Rivers, an open enrollee would be funded at just $2,017. Only in higher-poverty districts such as North College Hill does open enrollment funding reach amounts more comparable to the prior formula. In total, just 95 districts—roughly 15 percent—received base amounts this year for open enrollees that exceed $6,020 per pupil.[2]

Table 1: Illustration of open enrollment funding in selected districts, FY24

Budget pt 3 Open enrollment funding blog table 1
Source: Ohio Department of Education and Workforce, traditional district payment reports, (May #2). Notes: (*) The SSP is the state’s measure of district wealth and is used to drive the bulk of state funding. It’s based on a district’s property values and resident incomes; lower percentages = wealthier, higher percentages = poorer. (†) This is the baseline amount the state’s formula assumes is needed to educate a general-education student attending a particular district, as determined through a base cost model. The formula expects districts to levy a state-required local property tax of at least 20 mills (2 percent), which covers the “local share” of the base amount. (‡) This is the “core” state per-pupil funding that a district receives for a resident and open-enrollment student. These amounts are approximations as they don’t account for formula phase-ins (which would generally reduce the per-pupil amounts displayed here).

Downturn in open enrollment participation

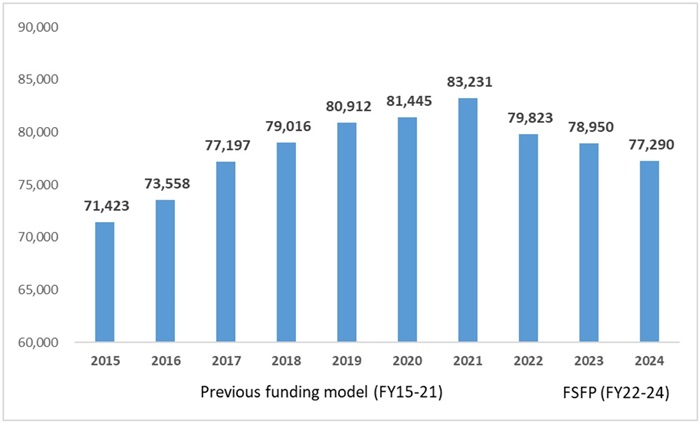
Prior to FY22, participation in open enrollment had been rising at a steady clip each year. Under the new formula, that pattern has reversed. As shown in figure 1, a noticeable decline in participation has occurred over the past three years. Compared to FY21, open enrollment numbers this year are down 7.1 percent (-5,941 students). It is possible that some of the decline from FY21 to FY22 is due to a change in reporting methods.[3] Yet even then, there’s has still been a noticeable slide in enrollments under the Fair School Funding Plan after years of consistent growth.

Figure 1: Open enrollment participation statewide, FYs 2015–24

Budget pt 3 Open enrollment funding blog figure 1
Source: Ohio by the Numbers (FYs 2015-23, and citing the state’s funding report data); for FY24, Ohio Department of Education and Workforce, traditional district payment reports (May #2). It is possible that some of the enrollment decline from FY21 to FY22 is attributable to a change in reporting methods.

It may be a coincidence that participation in open enrollment has dipped as the state implemented its new funding formula. Correlation isn’t causation, and perhaps other factors explain these declines (e.g., less parental interest in the program or the expansion of private-school choice).

Or maybe it’s no accident at all. In Northeast Ohio, West Branch school district announced last summer that it would be scaling back open enrollment, pointing specifically to changes in the funding formula. West Clermont, a Southwest Ohio district that open enrolled more than 100 students in 2021, reports just 24 open enrollees this year. A notice on its website confirms that it recently “decreased the number of open enrollment acceptances.” Similarly, Riverside school district says that it’s no longer accepting new open enrollment applications. This spring, Lakota school district near Cincinnati announced that (save for employee children) it’s no longer going to accept open enrollees in grades K–6, period. Impacted open enrollees will be forced to trek back to their home district or seek another educational alternative this fall. All of this is happening at a time when public school enrollment overall is dropping, which would typically lead districts to want to take more students from outside their boundaries.

The path forward on open enrollment funding

Funding policy should encourage rather than discourage districts to meet the needs of more Ohio families and students. The state’s new funding method misses that mark, and without change, we may see even more districts closing off open enrollment opportunities. The best way forward for state lawmakers is to restore the traditional approach to funding open enrollment by setting a simple, flat per-pupil amount that all districts receive when they open enroll.[4] This would once again make clear the financial incentive for districts to accept non-resident students. It would also provide amounts sufficient for districts to maintain or expand their open enrollment program. With any luck, it might even nudge some of the last remaining non-participating districts toward opening their doors.

* * *

For more than two decades, state leaders have crafted choice-friendly policies that put parents and students’ needs first. One part of this push has been to encourage more public-school options within the traditional district system via open enrollment. But recent changes in school funding policy have put this valuable program at-risk. In the next budget cycle, state lawmakers should fix open enrollment funding to ensure that it continues to benefit Ohio families and students.


[1] An economically disadvantaged, special-education, or English learning open enrollee would generate a certain amount above the base funding level for an educating district. In the previous system, an educating district would receive additional dollars from the home district of a special-education student (but not for disadvantaged or English learning students).

[2] Continuing former policy, local dollars do not change hands for open enrollment in the Fair School Funding Plan. Thus, the “gap” created by the new formula’s application of the state share percentage to base funding amounts for open enrollees is not filled through a transfer of local dollars from a home district to educating district.

[3] There is a discrepancy in open enrollment numbers that might reflect a change in reporting. DEW’s FY22 district payment file, which includes the previous year open enrollment numbers, reports 79,595 open enrollees in FY21. However, DEW’s FY21 district payment file reports 83,231 open enrollees (what is displayed in Figure 1).

[4] The amount could be set at the statewide average base per-pupil amount for a given year (in FY24, the average is $8,242 per pupil), or another fixed amount determined by the General Assembly.

view
Principal apprentice program blog image

For principal apprenticeships, look to the Peace Garden State

Jessica Poiner
6.3.2024
Ohio Gadfly Daily

Registered apprenticeship programs offer workers paid, on-the-job learning experience under the supervision of an experienced mentor, job-related classroom training, and the chance to earn a portable industry-recognized credential. Most people assume that these opportunities are limited to certain types of careers, like electricians or plumbers. But over the last several years, apprenticeships have become an increasingly popular solution for school staffing shortages.

Ohio is looking to leverage that potential. Last summer, Governor DeWine followed in the footsteps of states like Tennessee and announced the creation of a Teacher Apprenticeship Program aimed at bolstering the teacher pipeline. During his most recent state of the state address, he also acknowledged the importance of having a strong pipeline of school leaders. He noted that a great principal “creates the conditions for students, teachers, and staff alike to thrive.” And research backs that up. Which is why it’s good news that he’s announced that the Ohio Department of Education and Workforce will also create a principal apprenticeship program.

Applications for districts and teacher preparation programs interested in establishing teacher apprenticeships are already open. But details on what the principal-based program will look like have not yet been released. That’s not surprising, given that the initiative was only recently announced. But as state officials get to work hammering out the details, they would be wise to look to North Dakota for guidance. Here’s a broad overview of what’s going on in the Peace Garden State with principal apprenticeships, and what Ohio leaders should attempt to replicate in the Buckeye State.

Background

In July 2023, North Dakota became the first state to receive approval from the U.S. Department of Labor to include K–12 principals among federally-supported registered apprenticeship programs. The approval was granted based on an application submitted by the North Dakota Department of Public instruction, written by the National Center for Grow Your Own, and sponsored by the Council of Chief State School Officers. The state is using Title II funds to support its work. Currently, there are three participating educator preparation programs.

Program requirements

Governor DeWine didn’t explicitly say that his proposed program would be a registered apprenticeship. But given his administration’s focus on registered apprenticeships, as well as the benefits they offer, it seems a wise path. To follow it, Ohio’s program will need to meet certain criteria. North Dakota offers a solid example of how to do so.

According to the state’s website and its application to the U.S. Department of Labor, North Dakota’s program requires apprentices to complete a minimum of one year of on-the-job training as a paid assistant principal working under the guidance of a mentor and lead principal. Apprentices must also complete “related instruction” from a state-approved preparation program. Their coursework totals thirty credit hours[1] and results in a master’s degree in education/school leadership.

The program is also considered competency-based. Before they can accept a full-time principal position, apprentices must have obtained a master’s degree, met all state certification and licensure requirements, and completed at least 2,000 hours of on-the-job training. They must also be evaluated as proficient by their mentor on a variety of standards, including curriculum, instruction, and assessment; professional capacity of school personnel; meaningful engagement of families and community; and operations and management.

Grant funding

North Dakota leaders didn’t stop at establishing a program. They went a step further and also created the Aspiring Principal Pipeline Grant. The state’s request for applications pledged to award up to $150,000 to one or two preparation providers willing to meet the requirements outlined above while also ensuring that participants don’t pay any programming costs. In short, the grant makes it possible for a program to help teachers become principals for free and earn money while doing so.

North Dakota State University was awarded the initial grant. The university will be required to provide the state with a written final report that includes participant progress data, an overall evaluation of program effectiveness, a district satisfaction survey regarding the effectiveness of participants’ preparation, and recommendations for program improvements. These findings could be instrumental in helping state leaders pinpoint and address areas for growth as the program expands.

Ohio leaders should follow suit, not only with DeWine’s proposed principal apprenticeship program, but also with teacher apprenticeships. Including grant funding for both these efforts in the upcoming state budget would go a long way toward encouraging preparation programs and districts to establish apprenticeship pathways. Even better, the evaluation component of a grant program could help Ohio fine tune its offerings and fully capitalize on the potential of school staffing apprenticeships.

***

Governor DeWine deserves kudos for recognizing the importance of school leadership. Pledging to establish a principal apprenticeship program was a good first step toward bolstering the state’s pipeline of school leaders. Moving forward, state officials should design a program and offer accompanying incentives that—much like North Dakota’s initiative—create an environment where school-based apprenticeships can truly have an impact.


[1] Each credit is the equivalent of fifteen hours, which means apprentices devote a total of 450 hours to instruction.

view
STRS blog image

Give Ohio teachers control over their own retirement

Aaron Churchill
5.22.2024
Ohio Gadfly Daily

The soap opera at the State Teachers Retirement System (STRS), the entity that manages Ohio’s teacher pensions, has made non-stop headlines of late. The turmoil includes complaints from retirees about meager cost-of-living adjustments (COLAs) in an age of sky-high inflation, STRS staff bonuses paid in a year when the system lost billions, an investment wipeout tied to the Silicon Valley Bank collapse, and the suspension of the STRS executive director. The latest is an allegation from Attorney General Dave Yost that two STRS board members pushed a questionable investment deal behind the scenes. Looming in the background is a system that has amassed some $20 billion in unfunded pension liabilities and is lobbying the legislature to increase employer contribution rates—a move that would take another bite out of school budgets—to fill some of that gap.

Ohio teachers deserve better. Their hard-earned money shouldn’t get funneled into a troubled pension system. Taxpayers, who could be asked to foot the bill if contribution rates rise, deserve better, too. And so do students, who may suffer if pension payments divert more dollars from the classroom.

What to do? Remembering the adage “if you’re in a hole, stop digging” would be a good place to start. In that vein, let us first pause and consider why STRS seems to face such endless drama—and then consider what Ohio could do to improve the situation.

A key problem facing STRS—and other public pensions, too—is that high-stakes decisions about other people’s money and retirements are made centrally through a political process. In a traditional pension (“defined benefit”) system, retirement contributions go into a big old pot, i.e., the “pension fund,” which is used to pay out benefits. Policymakers and bureaucrats are charged with making decisions about how those dollars are invested and how retirement benefits are determined.

Even without myriad scandals that can ensue, politics puts tremendous stress on this model. In the case of STRS, teachers, often via union representatives, push for more generous benefits and bigger investment returns. State officials must then wrestle with these demands (and sometimes resist them) based on fiscal or risk-taking implications. Even if they acquiesce, yet another round of demands is likely to follow. So the cycle continues, with the tussling done in the public eye and billions of dollars at stake.

So long as questions about teacher pensions—including contribution rates, investment allocations, and COLAs—are settled in the political arena, STRS will remain under intense scrutiny. It’s not just STRS, either. Any number of public pension systems have also been embroiled in controversy. And like STRS, the largesse needed to appease special interests has put many of them on shaky financial ground.

The way out is to stop propping up this byzantine system and move to a modern approach that gives teachers control of their own retirement. To do this, Ohio should more fully leverage its “defined contribution,” or 401(k)-style, retirement plan. As most private sector workers know—and some in the public sector, too—this model allows employees to save for retirement via contributions to a personal savings account. The funds are “portable” as employees can change jobs without penalty—an appealing feature in today’s mobile economy. From an employer perspective, these plans are easier to manage, as no pension debt accrues, no complex actuarial calculations are needed, and the costs of retirement benefits are clear (i.e., the amount an employer contributes to workers’ accounts).

The good news is that Ohio has already established a 401(k)-style defined contribution option for teachers, managed by STRS.[1] Under this plan, teachers contribute 14.0 percent of their salary for retirement, while their employer contributes another 11.1 percent—good for a combined 25.1 percent contribution, a rate that is considered to meet the “best practice standard” by the Reason Foundation. Teachers may choose from various investment options offered by STRS, and to address concerns about outliving savings, STRS provides an option to convert funds into an annuity that provides a lifetime stream of income. To top it off, pension expert Chad Aldeman has shown that Ohio teachers in the defined contribution plan accrue substantially more retirement wealth than their counterparts in the traditional pension.

But here’s the rub: Only a small minority of teachers participate in the defined contribution plan (approximately 3 percent). One likely reason is that Ohio nudges teachers into the traditional pension plan by making it the default when entering teachers do not make an affirmative choice. The state also forbids existing teachers—once they’re in the traditional pension—to switch to the defined contribution plan. It’s also possible that the unions, which have long favored traditional pensions and are dominated by more senior teachers, might even influence the decisions of new teachers. These policies and practices discourage teachers, whose contributions are needed to help cover retirement liabilities, from participating in the 401(k)-style plan.

State legislators have a couple of options when it comes to moving teachers towards a 401(k)-style model. One possibility is to switch the default option for entering teachers to the defined contribution plan—something that is likely to drive more teachers in this direction. A more direct option would be to simply close the traditional pension plan to entering teachers (while preserving the status quo for current teachers and retirees) and offer only a defined contribution plan moving forward.[2] Several other states have done this for public sector workers, as have numerous private employers. Though not likely an easy transition—it would require a plan (and probably money) to cover existing pension promises to teachers—this type of “soft freeze” would be a first step in permanently ending the traditional pension and the long-term risks it poses to the state, taxpayers, and schools.

Some may also worry that these moves could stir a hornet’s nest. That’s a fair concern, and leading this change wouldn’t be for the faint of heart. Yet beneath the union front, survey data suggest that teachers are open to 401(k)-style plans. In a recent national survey of public employees, Joshua Rauh of Stanford University found that nine in ten said they would be willing to switch to a defined contribution plan, provided their employers make a sufficient contribution (10 percent of salary was the median amount). A national survey by the Equable Institute found that a slight majority of teachers (54 percent) indicate an openness to a change in retirement models.

Political backbiting and fiscal excess are baked into the traditional pension model, so it’s hard to believe that the drama at STRS will simply go away. The time has come to end the spectacle. Let’s stop making educators pawns in a massive pension scheme and instead treat them like the adults and professionals they are. It’s time to let Ohio teachers chart their own course to retirement.


[1] Ohio teachers, regardless of plan, do not participate in social security. STRS also offers a “combined plan” that offers features of a traditional pension and defined contribution plan.

[2] While likely more politically challenging, the state could also institute a “hard freeze” in which current teachers stop accruing pension benefits and would transition to a defined contribution plan.

view
Private schools and civics outcomes image

The impact of private schooling on students’ civic engagement

Jeff Murray
6.4.2024
Ohio Gadfly Daily

In 2023, Sarah Stitzlein—professor of education at the University of Cincinnati—asserted that “the health of our democracy in the United States depends directly on our public schools.” Her assessment summed up decades of thought and scholarship on the subject. But what about private schools, attended by about one in every ten young Americans? Surely they are crucial to democracy as well. A new meta-analysis in Educational Psychology Review aims to find out.

The research team is a stellar one, including Danish Shakeel of the University of Buckingham in England, and a crew from the University of Arkansas that includes professor Patrick Wolf and researchers Mattie Harris, Alison Heape Johnson, and Sarah Morris (the latter two former Fordham EEP Scholars). Together, they dig into the measurable impacts of civics instruction on students. The initial literature search identified a whopping 13,000 quantitative studies. The vast majority, however, duplicated or replicated each other, weeding out the majority and leaving just over 1,500 unique studies. The researchers screened these based on appropriateness and quality—specifically, they were looking for those that showed the impacts of civics education on public and private school students’ political tolerance, political participation, civic knowledge and skills, as well as their voluntarism and social capital.

Their final meta-analysis draws from 40 different databases and includes 57 studies, yielding 531 effects studied across the four outcomes of interest. (More on this methodology later.) The majority of studies came from the United States, with a handful from other countries in Europe, Asia, South America, and Australia. Thirty-one studies utilized nationally representative samples. Data ranged from 1982 to 2020. The private schools studied included those with specific religious identities (Catholic, Protestant, Islamic, and other religions), several non-specific religious schools, as well as secular private schools. The analysts used robust variance estimate (RVE) regression and meta-regression to identify the average association between civics education and the four civic outcomes of interest.

On average, they report, private schooling boosts any civic outcome by 0.055 standard deviations over public schooling, showing statistically significant positive impacts on three of the four civic outcomes, with only political participation showing null effects. Religious private schooling shows an even stronger impact.

These findings come with methodological caveats that must be considered: Only seven of the 40 databases informing the studies were generated using experimental or quasi-experimental designs. The average effect observed in the studies that use those databases, the authors write, “is positive 0.019 SD, but null.” And while the meta-analysis would likely have not been possible using only those gold-standard studies, the observational nature of the majority of the source data—and the reliance on those sources to generate statistically significant effects—should encourage readers to interpret the findings cautiously. The wide chronologic and geographic spread of the data also deserve consideration—Chile and Mexico are not the U.S.—and the America of 1982 is far removed from that of 2020. The fact that effects on parents are included in the overall outcomes—and are larger than the effects on students—is another concern. Additionally, as with meta-analyses in general, we can’t investigate the mechanisms that may be at work.

Still and all,  the analysts conclude that private schools appear better than public schools at building civically-engaged citizens and let the rhetorical chips fall where they may. There’s likely some truth to their assertion—and the corollary that public schools are not de facto better than private at building good citizens, despite a century of faith in that tenet, is likely true as well—but this evidence is surely not enough for anyone to declare it a settled question just yet.

SOURCE: M. Danish Shakeel, et al., “The Public Purposes of Private Education: A Civic Outcomes Meta‑Analysis,” Educational Psychology Review (April 2024).

view
EFI charter ecosystem SR image

Digging in to the 2024 Charter School Ecosystem Rankings

Jeff Murray
6.4.2024
Ohio Gadfly Daily

The Education Freedom Institute (EFI) recently released the newest iteration of its charter ecosystem rankings, its third such effort to gauge the health of states’ charter-school sectors. The mission is still the same—shifting the focus of ranking schema to how a state’s schools are actually performing and serving students, rather than how conducive their laws are to charter establishment, support, and growth (which is what other national organizations’ rating systems have typically focused on). But how well have the authors achieved their goal and crafted an ideal ranking system?

The authors, Benjamin Scafidi and Eric Wearne of Georgia’s Kennesaw State University, combine four statewide measures of charter school accessibility and academic success to craft their rankings: Accessibility comprises the percentage of a state’s students who attend charter schools and the percentage of students residing in a zip code that contains a charter school serving their grade. The former gauge is straightforward enough, but the latter tends to bias the rankings against states that limit charters to urban communities and/or low-performing districts. On the academic success front, the authors use the aggregate reading and math test score performance for all charter students as compared to how these students would have performed if they had instead attended a traditional district school.[1]

Accessibility measures come from publicly available data frome 2021–22 while achievement data are drawn from CREDO’s 2023 National Charter School Study III. The rankings include 29 states and the District of Columbia, and exclude states whose data are incomplete or too recent to be properly comparable. The components are scored individually, with the highest-performing state given 30 points and the lowest-performing one given 1 point—the others ranked in order in between. Then the point totals are added together, with the Academic Success measures comprising 60 percent and the Accessibility measures counting for 40 percent of each state’s total score.

According to EFI, the top five charter locales are Rhode Island, New York, Michigan, the District of Columbia, and Colorado. In line with the 60/40 split, their scores were driven by the relatively strong academic performance of those states’ charters versus their district peers. For example, Rhode Island’s accessibility rankings were average to just-above average, but charter students in the state gained a whopping 90.2 extra days of instruction in reading and 87.9 days in math compared to their district counterparts.

What does all this mean? Scafidi and Wearne emphasize the importance of considering student outcomes, which other national organizations don’t do in their rankings. “What experts consider well-written laws,” they opine, “do not always produce actual charter schools, and those schools do not always result in increased achievement by students.” They are hopeful that state and national policymakers will eventually favor their more outcomes-driven analysis, especially in this third iteration. However, they note that any statewide snapshot of the charter sector—even theirs—should only be used as a “first-pass” when considering the performance of charter schools in a given state. These aggregated data “may not reflect what is happening in a specific community” at a specific point in time, and especially may lag behind where that state’s charter school ecosystem is currently at or may be headed in the near future. If lots more charters are scheduled to open in the fall of 2024, for example, 2023 accessibility scores will be far lower than they will be during the next review. And low charter performance on a statewide measure could mask the fact that any single charter school could be the very best-performing option near a given family’s home.

Another important issue is the inclusion of online charter schools in CREDO’s data, which has a big impact on the EFI ratings. Consider Fordham’s home state of Ohio, ranked 27th, rising above only Oregon, Indiana, and South Carolina. Ohio ranks low in the accessibility categories (in part because its plentiful charters are limited to urban locales), but does especially poorly in academic outcomes, with charter students actually losing days of instruction in both reading and math to their traditional district peers, according to CREDO. Yet such analyses fail to control for the well-documented academic struggles of online schools, which make up nearly 30 percent of the Buckeye State’s charter sector, and have often distorted CREDO’s Ohio charter analyses. Indeed, a 2020 Ohio State analysis commissioned by Fordham found that brick-and-mortar charter schools boosted math and ELA test scores for grades 4–8 above their district counterparts, with impacts especially pronounced among Black students.

Despite these methodological concerns, however, EFI’s analysis continues to add food for thought around what makes for a “good” charter school sector. And for that, it deserves to be taken seriously.

SOURCE: Benjamin Scafidi and Eric Wearne, “EFI Charter School Ecosystem Rankings 2024,” Education Economics Center, Kennesaw State University (April 2024).


[1] More on the methodology used by the Center for Research on Education Outcomes at Stanford (or CREDO) and used in this analysis can be found here: https://ncss3.stanford.edu/methods-data/methodology/

view
Young teacher talking with teenager students seating in a circle at school

Five things we learned this school year

Tim Daly
5.30.2024
Flypaper

School is nearly out, thank goodness.

We had the usual ups and downs. But on balance, our orbit seemed to bend toward normal, didn’t it?

Here’s what we learned:

Lesson #1: We owe the high school class of 2024 an apology.

You got a raw deal. You were born in 2006. We gave you a smartphone for your seventh birthday and made you captive to big tech’s finest algorithms. Your eighth-grade field trip to Six Flags was canceled due to COVID. Ditto for your middle school graduation ceremony. You spent the first half of your freshman year of high school—already a festival of awkwardness—staring at your new classmates on Zoom while we argued amongst ourselves about whether it was safe to re-open buildings. And now, as you are dealing with the stress of applying to college, we messed up the FAFSA. Described in a single New York Times article as “a bureaucratic mess,” “a nightmare,” “convoluted” and “a debacle,” the new application for college aid was so buggy and late, you might have given up completing it altogether. Speaking for the rest of the American adult population, I hope you can find it in your hearts to forgive us because we are counting on you to support us when we are old and infirm. Your childhood—our bad on that one. We will do better.

Lesson #2: We can’t ignore demographic realities forever, but we’re going to try.

School enrollments are down. It’s not an illusion of the pandemic. Some students are never coming back to public schools. Birth rates are sharply lower, too, which guarantees future declines.

Chad Aldeman did a great piece on this for The 74. He shows that just a few years ago, federal agencies were predicting that the number of students would grow modestly over the next decade. Now? Just 13 states are expected to increase enrollment by 2031. The other thirty-seven states (plus D.C.) are slated to shrink.

We might expect that fewer students means fewer schools. Nope.

Sara Randazzo and Matt Barnum of the Wall Street Journal wrote recently that although urban schools have seen a 5.5 percent drop in students since 2019-20, the number of schools is “virtually unchanged.”

Chicago is a prime example. After the closure of fifty schools in 2013 sparked widespread political blowback, city leaders more or less swore off the issue. A coalition of organizations advocated successfully for a state law preventing any more closures. Just this spring, the Illinois House passed an extension of that moratorium until 2027.

In the meantime, Chicago has lost eighty thousand students since 2013.

The city now has dozens of massive buildings that are largely empty. Once-proud Manley High School on the west side has just seventy-eight students this year from grades 9–12. Marshall High School, familiar to fans of the famous Hoop Dreams documentary as the school one of the film’s subjects attended, has 174.

Under the current school funding plan, every school will have “a principal, an assistant principal, a clerk, at least one counselor, and at least one part-time school assistant.” That’s an expensive proposition for schools with fewer than 200 students. And Chicago has about fifty such schools.

The politics of shrinking schools are about to become a big deal. As I’ve written before, doing right by families requires planning ahead and prioritizing transition supports. Pretending closures won’t be necessary makes the eventual harm to vulnerable communities worse.

Now’s the time to ask districts if they are taking appropriate steps.

Lesson #3: If the Adidas Samba can come back into style, so can standardized tests.

For the first two decades of the millennium, there was a slow drip of colleges going test-optional or test-free. It was a thing. COVID forced the cancellation of several SAT/ACT administrations. Every college waived the requirement to submit scores, at least temporarily. A few months into the pandemic, the Times was asking whether the University of California’s plan to end consideration of exams “will spell the beginning of the end for college admissions testing.”

Proponents of dropping the tests argued that it would advance equity because tests are biased instruments and wealthy students can earn higher scores by paying for expensive tutors.

This year, momentum shifted abruptly in the opposite direction. A host of elite universities—MIT, Harvard, Yale, Caltech, Dartmouth, etc.—announced that they will now require submission of test scores from applicants.

Once again, the argument centered around advancing equity. Confusing, right?

This time, researchers pointed to data showing that tests help identify lower-income and underrepresented students who can thrive at selective colleges—kids who would otherwise be overlooked.

A second problem is grade inflation at the high school level. In the past, course grades tended to predict college performance at least as well as test scores, if not better. That has changed. At the University of California—the same system that doesn’t use tests—a study of its own students across nine campuses found that tests were a much better predictor of success than grades.

At a practical level, colleges are struggling to make good decisions without the tests. They are flooded with applicants who have perfect or near-perfect GPAs. How can they tell them apart? Besides giving preference to crew rowers, of course.

Tests are playing a key role at the K–12 level in monitoring our recovery (or lack thereof) from COVID learning setbacks. When surveyed, parents have consistently reported that their kids never lost any ground or have already made it up. Grades, as we just noted, have been rising. If we didn’t have test data, we would think everything’s peachy. But that’s far from the case. In fact, national tests show that the steady progress we made over the course of decades was wiped out.

In Massachusetts, a ballot initiative to eliminate state tests as a graduation requirement has attracted public opposition from the Governor and key legislative leaders—all of them Democrats who are typically allies of the state teachers union, which has spent millions backing the initiative.

Tests had a good year. Until grades improve as a signal, they will probably continue their resurgence.

Lesson #4: The quest to curb student absenteeism isn’t hopeless.

I’ll spare you the background. If you are a newer subscriber to this newsletter, we did a series on absenteeism in the fall.

What’s happened since September?

There’s been a notable shift in news coverage. Past stories tended to frame absenteeism in terms of barriers that prevented students from getting to school (e.g., transportation, chronic health conditions) or a lack of belonging. This year, reporters began to focus on how “our relationship with school has become optional,” as a Duke psychologist put it recently. We got some fantastic reporting from Alec MacGillis, among others, that helped us understand ground-level efforts to get students back in class.

The Biden administration has prioritized absenteeism through analysis by the Council of Economic Advisors and a recent summit.

And guess what? We seem to be making progress. Back in September, I profiled the Oakland Unified School District, where 61 percent of students were chronically absent last year. Ouch. This year, as of May 19, it’s about 31 percent. With a strong finish, Oakland might be back to pre-pandemic levels. That’s truly worth celebrating.

How about New Trier? I can’t tell you how many emails I received when I flagged that one of America’s most affluent high schools had a chronic absenteeism problem. Lots of schadenfreude. Well, get the laughs out of your system because New Trier cut absenteeism by two-thirds, from 24 to 8.5 percent, after shifting to tougher policies.

Massachusetts, which has been reporting school-level attendance each March since 2021, announced that the share of students chronically absent dropped from 24.5 percent last year to 19.6 percent this year.

Yes, still a long way to go. But this is important progress. It is not preordained that kids will miss more school forever. Big thanks to all the parents, educators and students out there who have been fighting the good fight.

Lesson #5: The science of reading won.

Emily Hanford’s podcast, Sold a Story, was an immediate hit when it arrived in fall 2022. With investigative flair, Hanford and her collaborators retraced how flawed literacy strategies were adopted by approximately one in four U.S. elementary classrooms—generating piles of profits for textbook publishers.

The central figure in the podcast is Lucy Calkins, a renowned professor at Teachers College. She evangelized for techniques that many researchers consider discredited.

In what was clearly a response to Sold a Story and the rising “science of reading” movement, Calkins announced in a May 2023 Times profile that she was overhauling her curriculum.

The reboot wasn’t enough. The Friday afternoon before Labor Day—a classic spot for dumping bad news—Teachers College pushed Calkins and her reading center out the door—ending forty years of her being one of its most visible stars.

This spring, Hanford released a follow-up episode reporting that the whole affair had taken a wrecking ball to Heinemann, the company that publishes Calkins’ books. Its revenues were down seventy-five percent in 2023 compared to 2019. Pretty stunning.

Now, what? Without Lucy Calkins to kick around anymore, districts are on the clock to show that their new reading strategies can deliver. As we know, nothing can go wrong with a research-informed, politically popular attempt to implement sweeping change nationwide.

We won’t hurry to adopt new curricula with an “EVIDENCE-BASED” stamp and rush the materials into classrooms, leading to a sloppy overcorrection toward all-phonics, all-the-time, will we? Who? Us?

Happy summer vacation to all

There’s a reason we close schools each summer, and it’s not because kids used to work in the fields. Enjoy the break—get some sun and relaxation. You’ve earned it.

This was first published on the author’s Substack, The Education Daly.

Fordham Logo

© 2026 The Thomas B. Fordham Institute
Privacy Policy
Usage Agreement

National

P.O. Box 110
Burke, VA 22009

202.223.5452

[email protected]

Ohio

P.O. Box 82291
Columbus, OH 43202

614.223.1580

[email protected]

Sponsorship

130 West Second Street, Suite 410
Dayton, Ohio 45402

937.227.3368

[email protected]