Mobile Navigation

  • National
    • Policy
      • High Expectations
      • Quality Choices
      • Personalized Pathways
    • Research
    • Commentary
      • Gadfly Newsletter
      • Flypaper Blog
    • Events
    • Scholars Program
  • Ohio
    • Policy
      • Priorities
      • Media & Testimony
    • Research
    • Commentary
      • Ohio Education Gadfly Biweekly
      • Ohio Gadfly Daily
  • Charter Authorizing
    • Application
    • Sponsored Schools
    • Resources
  • About
    • Mission
    • Board
    • Staff
    • Career
Home
Home
Advancing Educational Excellence

Main Navigation

  • National
  • Ohio
  • Charter Authorizing
  • About

Ohio Menu

  • Topics
    • Accountability & Testing
    • Advanced Education
    • Career & Technical Education
    • Charter Schools
    • Curriculum & Instruction
    • ESSA
    • Evidence-Based Learning
    • Governance
    • Personalized Learning
    • Private School Choice
    • School Finance
    • Standards
    • Teachers & School Leaders
  • Research
  • Policy
  • Commentary
    • Ohio Gadfly Newsletter
    • Ohio Gadfly Blog
    • Events

The Education Gadfly Weekly

Sign Up to Receive Fordham Updates

We'll send you quality research, commentary, analysis, and news on the education issues you care about.
Thank you for signing up!
Please check your email to confirm the subscription.

Ohio Gadfly—What to know about 3-year bachelor’s degrees

Volume 20, Number 18
9.3.2026
9.3.2026

Ohio Gadfly—What to know about 3-year bachelor’s degrees

Volume 20, Number 18
view
3yr bachelors degree blog image
Standards & Accountability

What to know about 3-year bachelor’s degrees

College isn’t cheap. Families and students pay the direct cost of tuition and fees, and students—because they are sitting in classrooms—forego potential wages that could be earned at work. Taxpayers also subsidize students’ education.

Aaron Churchill 9.3.2026
OhioOhio Gadfly Daily

What to know about 3-year bachelor’s degrees

Aaron Churchill
9.3.2026
Ohio Gadfly Daily

Three lessons Ohio could learn on career advising from Texas

Jessica Poiner
9.8.2026
Ohio Gadfly Daily

Ohio should tidy its high-priority IWIP industry credentials list, too

Aaron Churchill
9.8.2026
Ohio Gadfly Daily

Examining education sector mixing within homeschool families

Jeff Murray
9.8.2026
Ohio Gadfly Daily

Examining outcomes-based contracting in eight pilot districts

Jeff Murray
9.3.2026
Flypaper
view
TX career advising blog image

Three lessons Ohio could learn on career advising from Texas

Jessica Poiner 9.8.2026
Ohio Gadfly Daily
view
IWIP update blog image

Ohio should tidy its high-priority IWIP industry credentials list, too

Aaron Churchill 9.8.2026
Ohio Gadfly Daily
view
Sector mixing among US homeschoolers SR image

Examining education sector mixing within homeschool families

Jeff Murray 9.8.2026
Ohio Gadfly Daily
view
Graduation

Examining outcomes-based contracting in eight pilot districts

Jeff Murray 9.3.2026
Flypaper
view
3yr bachelors degree blog image

What to know about 3-year bachelor’s degrees

Aaron Churchill
9.3.2026
Ohio Gadfly Daily

College isn’t cheap. Families and students pay the direct cost of tuition and fees, and students—because they are sitting in classrooms—forego potential wages that could be earned at work. Taxpayers also subsidize students’ education. While completing a four-year degree still provides a strong long-run return on investment (especially for majors in high-demand fields), hefty upfront costs make college unaffordable for many young people.  

To defray those costs, policymakers have long pushed for “accelerated” routes to a bachelor’s degree. They include encouraging AP and IB exams and dual enrollment, so that students arrive on campus with college credit and reduce the time it takes to earn a degree. Some colleges also feature summer programs that allow students to graduate early or “4+1” “or 3+3” models that let students earn an undergraduate and graduate degree together and save time compared to completing those degrees separately.

Now another idea is gaining steam: The three-year (or “reduced-credit”) bachelor’s degree. Unlike other accelerated programs, which still require the traditional 120 credits, this approach simply scales back degree requirements to 90 to 100 credits—in essence, cutting a year of college and its associated costs right up front.  

A small handful of U.S. colleges have already put the concept into practice. Private nonprofit institutions such as Johnson & Wales University (RI) and Ensign College (UT) were among the first to offer three-year bachelor’s, and the University of Maine was the earliest public system to launch such an initiative. As of May 2026, a recent RAND Corporation study reports that 119 reduced-credit bachelor’s programs were being offered by colleges located in 26 states. Roughly half are fully online, while the others are either in person or hybrid models. Colleges typically offer a three-year bachelor’s as an alternative to a traditional four-year program and limit the option to students pursuing “applied” majors in fields such as business, IT, and public safety.

No Ohio college has yet to offer a three-year bachelor’s degree. But it probably won’t be long before we see them in our backyard. What do state and institutional leaders need to know about the model? And how can they maintain the quality and value of a college education within a condensed timeline? Published in response to a legislative directive, the aforementioned RAND report offers insights about how Ohio leaders might approach three-year bachelor’s degrees. Here’s the key takeaways:  

There is not yet evidence on how students who earn three-year bachelor’s degrees fare in the labor market. The main concern about condensed programs is that they might disadvantage students who must compete against traditional degree earners for jobs, promotions, and graduate school admissions. However, reduced-credit programs are so new that outcomes data are not yet available. In the near-term—until researchers have built an evidence base—policymakers and college leaders will need to rely on common sense, survey data (e.g., employer perceptions), and interim measures (e.g., college persistence) to design programs and gauge success.

College accreditors are open to reduced-credit bachelor’s degrees, but institutions will need to justify their creation. Accreditation is critical for colleges, as it verifies quality, unlocks financial resources, and signals to employers that graduates earn legitimate degrees. According to RAND, most Ohio colleges are accredited by the Higher Learning Commission (HLC), and they would need to win approval from their accreditor (HLC or other) to offer a three-year bachelor’s degree. HLC has already approved such programs in other states, so if the program design is satisfactory, accreditation should not be an insurmountable hurdle for Ohio colleges.

Some majors are better suited to a three-year bachelor’s than others. Based on a feasibility analysis that considers licensure rules and occupational standards, the RAND analysts conclude that colleges can more easily compress undergraduate programs in business, computer systems, public safety, and some healthcare professions into a 90-credit degree. On the other hand, majors such as architecture and engineering are not viable candidates due to stricter occupational licensing requirements. Interestingly, RAND did not examine liberal arts majors (perhaps because they are not easily linked to occupations), but they would seem to be candidates for a three-year bachelor’s.[1] That said, the RAND study does offer evidence that students pursuing graduate studies may want to opt for a traditional four-year program. In a small-scale survey of graduate school administrators, they voice skepticism about reduced-credit degrees (though their opinions may shift as students earn them).

What to cut from the traditional four-year degree matters. The RAND analysts make clear that accreditors still expect all students to complete a university’s full general-education requirements, whether pursuing a three- or four-year degree. Similarly, due to occupational or graduate school expectations, colleges should resist scaling back major course requirements. But elective courses are fair game. Well-designed 3-year bachelor’s degrees remove some frills from an undergraduate education without sacrificing core general education and major requirements.

***

With concerns about college affordability mounting, the push for three-year bachelor’s degrees will only accelerate in the coming months and years. Lopping off 30 credits from an undergraduate education could yield significant cost-savings for students and families, but colleges should still prune thoughtfully. As one college administrator noted, “If you want to go to medical school or be a rocket scientist at NASA, you’re going to need a four-year degree.” But for college students with other career ambitions, a three-year bachelor’s degree might be the right fit.


[1] RAND did explore the possibility of a 90-credit bachelor’s degree in education. It is regarded as “feasible” but not easily so in Ohio due to the state’s required reading instruction credits and student teaching requirements.

view
TX career advising blog image

Three lessons Ohio could learn on career advising from Texas

Jessica Poiner
9.8.2026
Ohio Gadfly Daily

For nearly a year, state lawmakers have been mulling legislation that would help Ohio build on its career-connected learning efforts. Senate Bill 328, which was passed unanimously by the Senate and is currently in the House, primarily focuses on K–12 students and schools. Its provisions include a requirement that districts provide career exploration instruction to middle schoolers and that students create individualized academic and career plans by the end of eighth grade that must be updated throughout high school. It also calls on the Ohio Department of Education and Workforce (DEW) to establish a statewide career coaching framework that districts must use to provide every middle schooler with at least one career coaching session.

Collectively, these provisions would provide Ohio students with more career advising support than they currently receive. That’s reason enough for lawmakers to pass this bill as soon as possible. But SB 328 is best viewed as a starting point, not a finish line. To be truly prepared for the future, students will need much more than career exploration and a single coaching session in middle school. They’ll need consistent support throughout all their schooling years.

For clues about how to make that happen, Ohio should look to the Lone Star State.

In Texas, the Effective Advising Framework (EAF) helps districts and schools develop and implement an integrated approach to career and academic planning for students. The planning and implementation process for EAF is—much like Texas’s teacher performance pay system—a complex one. The state’s website offers plenty of information for those interested in more detail, as does a recently published TNTP case study[1] and some additional analysis. For the purposes of this blog, though, let’s focus on three primary lessons that Ohio could glean from Texas.

Lesson 1: Prioritize support for counselors and advisors.

EAF consists of five levers that form the basis of an effective advising program. The second lever focuses on the importance of having effective, well-supported counselors and advisors. It identifies three “essential actions” that describe what the “most effective” school counseling programs do. All three emphasize two key issues: recruitment of and support for school counselors and advisors.

Recruitment matters because of simple math: If every student is to receive consistent, in-depth advising, then schools are going to need a lot of adults to fill those roles. School counselors, who already have very full plates, can’t be expected to do it all on their own. The EAF’s second lever notes that it’s important for program leaders and administrators to “identify and partner with feeder institutions who can support the talent pipeline of new school counselors and advisors.” In Ohio, state officials could help by creating an RFP that allows nonprofits and other organizations with expertise and experience in career advising to apply for state approval to offer their services. DEW would evaluate these applications and establish a list of providers who meet state expectations and have a documented history of assisting students. Districts and schools that choose to work with state-approved providers could then have a portion of the service cost covered by the state.

Support, meanwhile, can mean the difference between retaining advisors and scrambling to fill positions each year. Again, the EAF’s second lever identifies some promising ideas. They include developing a training experience for all new counselors and advisors to ensure they’re effectively onboarded; annually providing high-quality training that’s specific to individual roles; routinely tracking the performance and progress of counseling staff using normed evaluation tools along with student data; and ensuring that staff participate in meaningful professional development opportunities like visiting colleges and trade schools, completing training on financial aid, engaging with employers, and participating in mentorship experiences.

Lesson 2: Regularly seek feedback from impacted stakeholders.

According to the TNTP case study, more than 300 district and campus staff members were asked to share feedback on their experiences with the EAF pilot in May 2026. A whopping 94 percent of those surveyed reported satisfaction with their EAF coaching experience. In particular, they highlighted the value of having dedicated coaching support, practical tools, and protected time to focus on advising.

It’s great news that adults are having such positive experiences. But the true stakeholders in advising initiatives are students. TNTP notes that each year, districts participating in the pilot gather feedback from students through an anonymous survey. During the three most recent school years (2023–24 through 2025–26), students’ perception of their experiences improved by 3 to 7 percentage points across all topics. In 2025–26, 77 percent of students responded favorably about their future plans, while more than 65 percent responded favorably about pathway awareness, counselors, and the internal culture of advising.

These positive results are a feather in the cap of EAF. But for Ohio, the takeaway isn’t just that a system like the one in Texas can work—it’s that regularly seeking feedback matters. Students and staff should have consistent and meaningful opportunities to share what’s working and what’s not. District and state leaders should respond accordingly.

Lesson 3: Keep an eye on outcomes.

Texas measures student preparedness via a set of indicators known as College, Career, and Military Readiness. Criteria include completing dual credit coursework, earning an industry certification, and enlisting in the military. Not only do districts’ scores on these indicators contribute to their ratings on the state’s accountability system, but the Texas Education Agency also annually awards funding based on outcomes. According to TNTP, the first cohort of districts participating in EAF gained an average of 11 points over two years. The second cohort gained an average of 7 points in its first year. Although both cohorts began at a higher rate than the state average, they both showed the same or a higher rate of growth as the state.

Ohio has a similar set of indicators, though ours is known as the College, Career, Workforce, and Military Readiness component. As districts expand and improve the career advising they offer to students, state leaders and advocates should keep a close eye on improvements (or lack thereof) on this component. Districts that jump in the ratings deserve kudos (and perhaps bonus funds)[2]. Those with flat or declining results might benefit from additional support or even intervention.

***

Over the last few years, state leaders have done an admirable job of building on Ohio’s career-connected learning foundation. But there’s still a considerable amount of work to be done. Passing Senate Bill 328 is the first step. But after that, policymakers will need to keep pushing for more and better career advising opportunities. Following in Texas’s footsteps would be a solid place to start.



[1] For the past five years, TNTP has partnered with the Texas Education Agency to pilot the framework across the state.

[2] While directionally correct, Ohio’s CCWMR measure could use a few improvements before being linked to bonus funds.

view
IWIP update blog image

Ohio should tidy its high-priority IWIP industry credentials list, too

Aaron Churchill
9.8.2026
Ohio Gadfly Daily

In Ohio, the big news in the career pathways realm is the state’s recent revamp of the industry recognized credentials system. The makeover was sorely needed given evidence that schools had discovered the easiest-to-attain credentials and pushed students to collect them as shortcuts to graduation. Starting with this fall’s freshman, students must earn credentials from a slimmed-down list of 126 credentials to meet alternative graduation requirements (738 were previously approved). The new catalog is built on a data-driven system that incorporates employer demand and wage outcomes to help ensure students earn credentials of value en route to graduation.

Besides diploma requirements, Ohio also encourages credential attainment through the Innovative Workforce Incentive Program (IWIP). First enacted in 2019, it currently provides up to $725 per credential earned. The IWIP list has always been smaller and more selective than the graduation list, with a strong focus on high-priority career fields such as construction, engineering, healthcare, IT, and manufacturing. However, like with graduation, the IWIP credentials list was largely developed based on subjective judgments rather than objective data.

With the graduation list getting a facelift and more data now available on credentials, the IWIP list merits a closer look. As of 2025–26, the state designated 210 credentials as IWIP eligible, more than the number that’s now approved for graduation. This is a reversal of precedent and a potential concern given that IWIP is supposed to incentivize a narrow set of high-priority, high-value credentials.

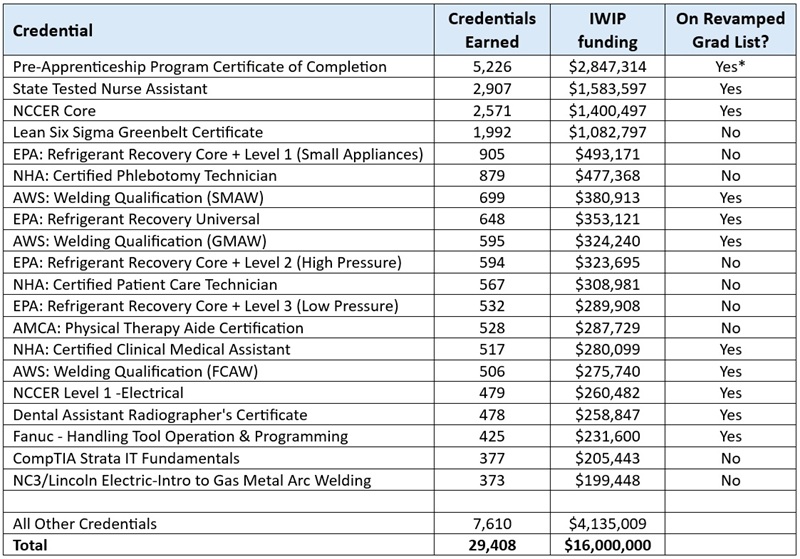
The disconnect is noticeable when looking at the most commonly earned IWIP credentials. As Table 1 indicates, nine of the top twenty IWIP credentials earned in 2024–25[1] do not appear on the revamped graduation list. With wage data available by credential, we learn that several of the non-graduation-approved IWIP credentials lead to low-paying jobs. For Ohio students attaining a six sigma greenbelt, certified phlebotomy technician, certified patient care technician, CompTIA fundamentals, and the physical therapy aide credentials, the median income was just $26,000 to $31,000 shortly after high school. That’s barely above the income for a full-time minimum wage job (about $23,000 per year). Such meager wage outcomes help explain the credentials’ exclusion from the graduation list—and highlight the need to revise IWIP standards.

Table 1: FY2026 IWIP funding—top twenty credentials

IWIP update blot table 1
Source: Ohio Department of Education and Workforce, Excel file titled “Innovative Workforce Incentive Program Payment” (FY2026). Abbreviations: NCEER = National Center for Construction Education and Research; EPA = Environmental Protection Agency; NHA = National Healthcareer Association; AWS = American Welding Society. Note: (*) The pre-apprenticeship certificate does not appear on the graduation credentials list, but is a standalone option in the state’s alternative graduation requirements.

Policy options

State officials have some options on how to handle IWIP eligibility in light of recent developments. Let’s explore three possibilities, with the final one (in bold, below) the best approach, in my view.

  1. Maintain the IWIP list as-is. This has the benefit of consistency and would not withdraw future support for schools that may have developed programs in response to the incentive. The problem is that we now know—as a result of extensive analysis of IRCs—that some IWIP credentials have questionable value for students in the labor market. In addition, maintaining an IWIP list that is larger than the graduation list seems at odds with program intent, which is to provide targeted incentive funds for only the highest-value credentials.

  2. Align the graduation and IWIP credentials lists. This has the advantage of creating a unified system. When meeting alternative graduation requirements, students would also be attaining an IWIP credential, which the state subsidizes. The rub is that some graduation-eligible credentials are arguably not ones that the state should incentivize monetarily. Most notably, the cosmetology licenses appear on the revamped graduation list but are not currently IWIP-designated. Given the low wages associated with that career field, those credentials should remain off of the IWIP list. Another challenge is that there will likely be significant pressure on state officials to expand the graduation-eligible list in future years. Automatic linkage to IWIP amid a ballooning graduation list would likely tarnish the incentive program. It also risks deeper “prorations” of the IWIP reimbursement rates if the number of credentials-earned rises within the fixed program budget.[2]

  3. Strategically remove items from the IWIP credentials list or simply start from scratch. This would avoid the problems discussed in the above options, while ensuring that Ohio maintains a more selective IWIP list. One option for accomplishing this is to start from the current IWIP list and remove credentials that have weak employer demand and wage outcomes. Another possibility is to start over: Use the new credentials framework to identify the highest-value credentials and make them IWIP eligible. Safeguarding the selectivity of IWIP will be essential in efforts to build support for increased program funding. Lawmakers are likely more inclined to invest taxpayer funds knowing that the approved credentials lead to strong employment outcomes for students.

State leaders have rightly enacted policies that encourage students to earn credentials. The recent shift towards quality, rigor, and value is critical to ensure that students benefit from attainment. The clean-up of the graduation list was a necessary first step. Now it’s time to do some housekeeping for IWIP as well.


[1] The IWIP program reimburses schools based on prior year credential earning, and is why Table 1 refers to FY2026 funding.

[2] Prorations—i.e., reductions to the maximum reimbursement rates to fit the program appropriation—are already a significant problem with IWIP. In FY26, schools received just $545 per credential (75 percent of the $725 max reimbursement) due to the volume of credentials earned and a limited appropriation of $16 million. 

view
Sector mixing among US homeschoolers SR image

Examining education sector mixing within homeschool families

Jeff Murray
9.8.2026
Ohio Gadfly Daily

Homeschooling in the United States is often imagined as an all-or-nothing decision: Families who choose it do so full-time, for all their children, across their entire K–12 education. Recent findings from Johns Hopkins University’s Homeschool Research Lab revealed a more complex picture of students moving between educational settings (homeschool, public school, co-ops, etc.) at different points in their lives. But explanations for and descriptions of these switches were absent. A new report from the lab’s researchers remedies that.

Albert Cheng, Angela Watson, and Matthew Lee use data from three administrations of the National Household Education Surveys (NHES) to a nationally representative sample of U.S. households in 2012, 2016, and 2019.[1] Each household included provides information about schooling experiences, parent involvement in their child’s education, family life, and demographic characteristics for one randomly selected school-aged child in the household. While NHES defines a household as “homeschool” or “conventional school” based on the response for that single sampled child, the survey does actually ask about the educational mode of other school-age children in the home. The analysts exploit this additional data for their study. Households in which the sampled child had no siblings or only had siblings who were too young/too old to be enrolled in primary and secondary schooling were excluded. The final sample comprised 25,261 households.

First, the team provides summary statistics to illustrate the prevalence of what the they call “sector mixing”—that is, a family simultaneously having at least one child in homeschooling and at least one other child in a district or private school. Over all three waves of NHES data, an average of 2.5 percent of U.S. households with more than one school-aged child practiced sector mixing. This includes a majority (53 percent) of the multi-child households that NHES deemed “homeschoolers” via their single-sampled-child methodology. The remaining 47 percent of multi-child homeschoolers were indeed exclusively in that setting. Nearly all (97 percent) of the multi-child households deemed “conventional schoolers” were exclusively so—although that could include a public and a private school within one family, a different type of “mixing” than the analysts are looking at here. The percentage of conventional schooling families embracing homeschooling for one or more children rose between the 2012 and 2019 administrations of the NHES survey, from 1.6 percent to 2.8 percent.

Family size, parental education, and parental employment status had the largest impact on sector mixing. Keeping in mind that the overall rate of sector mixing is low (2.5 percent), even small changes in likelihood are significant. Every additional child increased the likelihood of a family practicing sector mixing by about 1 percentage point. White families were more likely to practice sector mixing than Black, Hispanic, and Asian/Pacific Islanders by roughly 1 percentage point; households with college-educated parents were more likely to practice sector mixing than their high-school-diploma-only peers. Households in which both parents are working for pay were 1.6 percentage points less likely to practice sector mixing than households in which one or neither parent is working for pay. Sector mixing declined, however, at the highest income levels, with the wealthiest families in the survey nearly 2 percentage points less likely to do so than the lowest-income families. Sector mixing was more common in the South and West, but there were no significant differences in mixing rates based on urban, suburban, or rural locations.

NHES homeschool families were asked to consider eight specific reasons[2] for homeschooling their child and to choose all that applied to them. The analysts found that reasons related to “household needs” (such as providing religious or moral instruction and wanting a non-traditional approach to education) led to far less likelihood of sector mixing (by 10 to 15 percentage points, compared to the full NHES sample), while reasons related to “child-level needs” (like illness or mental health concerns) led to a much higher likelihood of sector mixing in the household (16 to 19 percentage points).

The researchers believe that their estimates of sector mixing among U.S. families likely underreport the true numbers due to the fact that the NHES surveys are not designed to provide the full data required for proper calculation. Nevertheless, they conclude that the picture of “the variegated nature” of homeschooling their estimates paint—prevalence, motivation, demographics, etc.—is valuable. This is especially true of sector mixing between homeschooling and traditional public/private schools. More data are required, but the questions needing answered by those data are becoming more and more clear.

SOURCE: Albert Cheng, Angela Watson, and Matthew Lee, “An analysis of educational sector mixing among U.S. homeschooling families from three waves of the national household education survey,” Cambridge Journal of Education (August 2026).


[1] 2023 data were captured, but are not publicly available as yet.

[2] (1) concerns about school environment such as safety, drugs or negative peer pressure; (2) dissatisfaction with academic instruction in school; (3) desire to provide religious instruction; (4) desire to provide moral instruction; (5) the child has a long-term mental or physical health problem; (6) the child has a temporary illness that prevents him or her from going to school; (7) the child has a special need that the school cannot or will not meet; and (8) interest in a nontraditional approach to the child’s education.

view
Graduation

Examining outcomes-based contracting in eight pilot districts

Jeff Murray
9.3.2026
Flypaper

Contracted or purchased services (tutoring, professional development, after-school care, etc.) constitute the second-largest category of school district expenditures after staff compensation. They add up to tens of billions of dollars each year. Typically, the procurement process for such services focuses on inputs and price, and unless something goes drastically wrong, districts are on the hook for the entire payment amount regardless of how well services are delivered. In 2021, the Center for Education Policy Research at Harvard University began piloting a different contracting model, looking to tie expenditures to specific, measurable results. A group of researchers at WestEd have published a new report evaluating these pioneering efforts.

Data come from eight unnamed districts that were early adopters of outcomes-based contracting (OBC) between the 2022–23 and 2024–25 school years in four states: California, Florida, Mississippi, and Texas. In the OBC model, contractors receive a baseline payment for providing services, with additional compensation—representing at least 40 percent of the overall contract value—contingent upon meeting predetermined success metrics that the district and provider agree upon collaboratively. Participating districts ranged in size from 10,000 to 100,000 students. The vast majority of students in all districts (more than 70 percent) were students of color, and the population of English language learners ranged from 3 percent to over 38 percent.

The specific services piloted via OBC were high-dosage tutoring (one-on-one or small-group tutoring focused on literacy or mathematics, delivered virtually or in person) and what is vaguely termed educational technology, described as “technology-based interventions for reading or math, typically implemented during the school day.” Between 700 and 2,500 students received one or both of these services in a given district each year. Quantitative data include student achievement and implementation metrics; qualitative data comprised interviews, observations, and document reviews.

WestEd’s analysts report six key findings, most of which focus on the contracting process itself and the “systems capacity” of districts. This is very important to those with a vested interest in OBC implementation, but less interesting for general audiences. So we will limit discussion here to the two most important findings. The first is district spending on OBC services. The analysts were limited in this regard to a subset of districts where data were available, but spending on services rendered via outcomes-based contracting in them was comparable to previous services obtained via traditional contracting processes. In other words, the new model did not lower district cost. They suggest, optimistically, that districts may therefore have received “greater intensity of services for a comparable cost,” but that is true only if student performance increased.

The second finding concerns student performance. Once again, data were limited to a subset of districts, but analysis showed some statistically significant gains caused by OBC compared to traditionally contracted services. For two examples: English language arts test proficiency boosts for second graders in one district, and a higher number of students meeting or exceeding typical literacy growth targets in another. On the upside, the specific OBC interventions under study were targeted at students determined to have the greatest need (low-income students, English language learners, students with special needs, etc.), thus magnifying the positive impact of OBC in those districts. On the downside, however, findings of positive impacts were limited to just two districts where contracted intervention services were delivered for the intended duration and in the contract-prescribed dosages. In the other districts, numerous implementation issues on both the provider and the school sides combined to render null impacts or, more commonly, no usable data at all.

It is this latter point that leads the report’s authors to cautiously conclude that OBC has “potential” to change contracting models in schools for the benefit of students. But fidelity of implementation (as ever) matters, and OBC generated a whole raft of new issues throughout the contracting process. The many lessons learned from these pilot programs (as detailed in the procedural findings) must be addressed before any more “potential” can be realized. To that point, it is also interesting to note that neither in the report nor in a recent interview did the analysts indicate whether any of the contracts had been reduced in scope or in price based on providers not achieving results. There seems to be plenty of evidence that a number of outcome goals were not realized, yet no clear evidence that payments contingent upon those outcomes were denied.

SOURCE: Kelsey Krausen et al., “Evaluation of Outcomes Based Contracting (OBC): Final Report,” WestEd (July 2026).

Fordham Logo

© 2026 The Thomas B. Fordham Institute
Privacy Policy
Usage Agreement

National

P.O. Box 110
Burke, VA 22009

202.223.5452

[email protected]

Ohio

P.O. Box 82291
Columbus, OH 43202

614.223.1580

[email protected]

Sponsorship

130 West Second Street, Suite 410
Dayton, Ohio 45402

937.227.3368

[email protected]