
Ohio is investing hundreds of millions to strengthen and expand access to CTE
Last January, during his 2023 state of the state address, Governor DeWine pledged to invest additional state funding in career and technical education (CTE) programs.

Last January, during his 2023 state of the state address, Governor DeWine pledged to invest additional state funding in career and technical education (CTE) programs.





Last January, during his 2023 state of the state address, Governor DeWine pledged to invest additional state funding in career and technical education (CTE) programs. These programs, which blend career training and academic coursework, provide students with opportunities to earn industry-recognized credentials and college credit and can be used as a pathway to a high school diploma. They are also an integral part of Ohio’s career pathways efforts, which aim to ensure that students are well-prepared for what comes after high school, whether it be college or career.
In his address, the governor noted that many of Ohio’s career centers lack the “modern, up-to-date equipment” and facilities needed to teach certain courses. He promised to address this by investing millions in one-time funding for CTE equipment and capital improvements, and he followed through in his budget recommendations for FY 2024 and 2025. The final budget, which was signed into law in July, allocated $100 million toward CTE equipment upgrades along with another $200 million for the Career-Technical Construction Program.
Over the last several months, the state has begun to distribute these funds. In November, Governor DeWine and Lieutenant Governor Husted announced which districts would be awarded funding under the Career-Technical Construction Program. Of the fifty-nine districts that applied, thirty-five were awarded funds. The majority (twenty-four) were Joint Vocational School Districts (JVSDs), which are independent school districts that primarily offer CTE programming. Four comprehensive districts (traditional districts that provide CTE programming at schools or career centers within their boundaries) and seven compact districts (groups of districts that collaborate and combine resources to offer students CTE programming) also received awards.
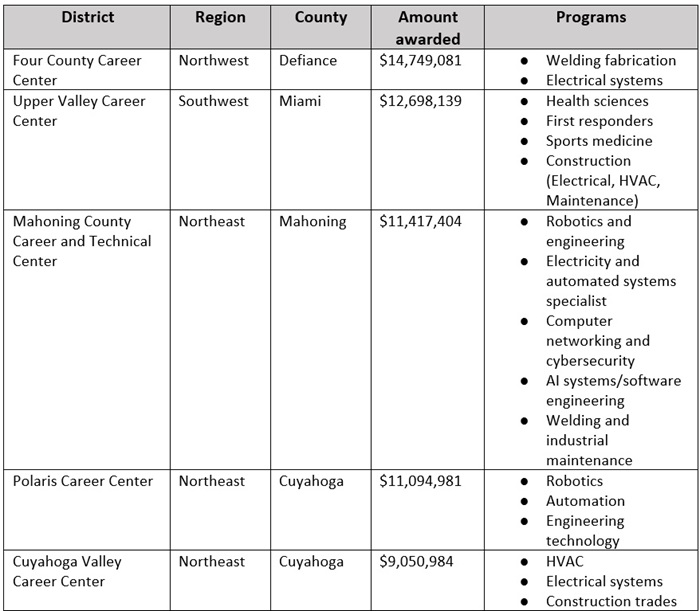
These dollars will be used to build and expand classrooms and training centers. And according to the state, this investment should result in 3,719 additional seats for students. The majority of these seats fall into three programs: construction and engineering, manufacturing and operations, and healthcare. Northeast Ohio will receive the biggest investment, with over $84 million being distributed to fifteen districts. Among the thirty-five grantees, the following five received the highest funding amounts.
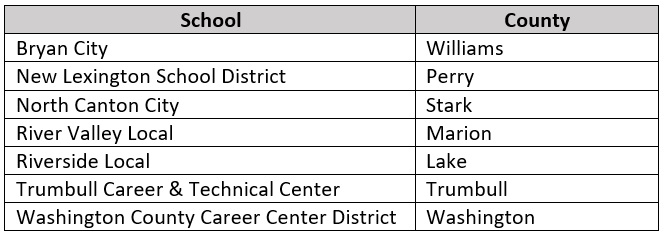
More recently, the administration announced the recipients of the first round of funding[1] for the $100 million Career-Technical Education Equipment Grant Program. This program is designed to award competitive grants to schools for equipment, instructional materials, facilities, and operational costs. To be eligible, schools must plan to offer a qualifying CTE program that supports a career on Ohio’s Top Jobs list or a qualifying credential program from the Innovative Workforce Incentive Program list. Under the first round of funding, fifty-six schools will receive grants that total more than $67.7 million. The state estimates that this funding should expand CTE access to an additional 10,345 students. The following seven schools received awards of $2.5 million, the highest amount provided to recipients in this round.
Given that these grants have only recently been awarded, it’s too soon to know what their true impact will be. But the state estimates that over 14,000 additional students will be able to access CTE, and that’s worthy of praise. Going forward, though, state lawmakers must shift their attention toward student outcomes. Significant taxpayer investment, along with the potential of high-quality CTE, make it crucial for the state to keep a close eye on the short- and long-term impacts of these programs. Adding more access and capacity is a great first step. But having more seats only matters if those seats ensure that more students master the knowledge and skills they need to secure in-demand, well-paying jobs.
[1] The application period for the second round of funding will open soon.

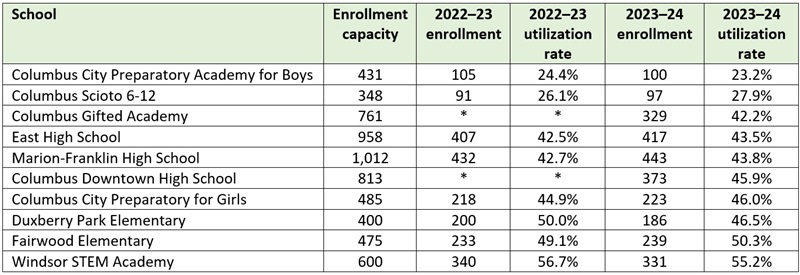
A recent Columbus Dispatch article revealed stunningly low enrollment rates in several Columbus City Schools’ buildings. Columbus Preparatory School for Boys and Columbus Scioto 6-12, for instance, operate at less than 30 percent of their enrollment capacities. Six more schools are less than half full.
That’s alarming on a couple levels. First, maintaining severely underenrolled schools is a terrible use of public funds. The district is spending far more taxpayer dollars than necessary on staffing, utilities, maintenance, and transportation just to keep these facilities open. Airlines don’t operate routes that are routinely half-empty; manufacturers don’t keep factories running in the face of plummeting demand. If they did this, they’d go bankrupt. While school systems don’t go out of business, they shouldn’t be operating facilities at half capacity, either, as it consumes dollars that could be allocated to better uses or requires them to seek additional taxpayer funding.
Beyond dubious fiscal management, the article also raises questions about whether Columbus City Schools is following a state law that requires districts to offer underutilized facilities to public charter schools. Under this provision, a district must offer—for lease or sale—a vacant facility or one that is at less than 60 percent of capacity to local charter schools.[1]
These provisions are perfectly sensible. Districts shouldn’t be hoarding taxpayer-funded classroom space that could be put to use by other educational entities. Columbus’s charter schools enjoy swelling enrollments thanks to booming parental demand—they’ve increased by 11.4 percent from 2018–19 to 2023–24—and many of them would benefit from having access to affordable, purpose-built facilities that allow them to meet rising demand.
Districts are required to offer these facilities in the year after they are identified as vacant or underutilized. So one explanation for this seemingly obvious violation of state law is that Columbus’s underenrolled schools this year were at more than 60 percent capacity in 2022–23 and not officially identified. As table 1 indicates, that isn’t the case. The underenrolled schools identified by the Dispatch for the 2023–24 school year were at less than 60 percent capacity in 2022–23, as well.
Table 1: Underenrolled school buildings operated by Columbus City Schools
Perhaps Columbus City Schools offered these schools behind the scenes to charters, but no one sought to purchase or lease them. Maybe so, but it’s also possible that the district is playing games, something that doesn’t seem far-fetched, given the anti-charter sentiment in the district and past efforts to keep facilities away from charters. Without much transparency, it’s hard to know what has or has not happened.
It shouldn’t be this way. Next school year, Columbus should make widely known that its underutilized facilities are available for purchase or lease to charters. State legislators—having seen a seemingly obvious violation of the law—should step up and revise the law in ways that leave no question that districts are actually offering such buildings to charters.
Good stewardship of taxpayer dollars means ensuring that publicly funded buildings are cared for and well used. When districts aren’t making adequate use of a building, they should offer the space to another educational institution. It’s the law. And it’s also the right thing to do, as communities benefit when charters have the capacity to serve more families and students.
[1] In addition to public charter schools, districts are also required to offer underutilized facilities to independent STEM schools (there is one such school in Columbus).

Last year, the state budget set aside $20 million for the Governor’s Merit Scholarship. This program, which officially launched in December, aims to incentivize Ohio’s top high school graduates to remain in Ohio to attend college rather than enrolling in universities out of state. State leaders designed the program in light of data indicating that more than a third of Ohio’s highest-achieving high school graduates attend college in another state each year, and roughly two-thirds of all college students stay to work in the state from which they graduate. This scholarship could help convince talented high school grads to stay in the Buckeye State. But with a little tweaking, it could also help bolster Ohio’s teacher pipeline.
Under current law, the Governor’s Merit Scholarship provides up to $20,000 in financial assistance over four years to seniors in Ohio’s public and private high schools[1] who graduate in the top 5 percent of their class.[2] The scholarship can be used to cover not just tuition and fees, but also other educational expenses, such as books, room and board, or transportation costs. By expanding it to provide an additional $5,000 per year—making the scholarship worth $40,000 total over the course of four years—to students who pursue teaching degrees at an accredited college or university in the state, Ohio could incentivize its best and brightest to teach.
Limiting eligibility to high-performing students is important, as research indicates that teachers who were excellent students produce high student achievement. But there are several other reasons why policymakers should consider this expansion.
First, research indicates that having student debt can motivate graduates to choose substantially higher-salary jobs and, as a result, reduce the likelihood that they will choose to work in “low-paid, public interest” jobs like education. Establishing a statewide scholarship program aimed at making college more affordable for prospective teachers could help, as it would cover the majority of tuition and fees at several public colleges and universities—including Kent State University, Ohio State University, and Wright State University. Students would still need to cover the cost of room and board. But with other financial-aid options available (like the federal TEACH grant, Pell grants, the Ohio College Opportunity Grant, or college-specific scholarships), future teachers could have a significant chunk of their college education paid for.
Second, making college more affordable for prospective teachers could help address teacher shortages. It’s difficult to grasp the true size and scope of Ohio’s shortages because the state doesn’t (but should) collect data on teacher vacancies. But the data that are available point to several problems, including that fewer young people are entering the profession. A host of possible reasons explain this decline, including concerns about low pay that are compounded by the looming specter of student loan debt. An increasing number of teenagers are deciding to forgo college, and nationally representative surveys of high school students indicate that cost is the primary reason why. Mitigating some of those costs is crucial for talented students who could succeed in college but are choosing to steer clear because of student loans.
Third, there’s evidence that state-funded scholarship programs like this can have a positive impact. The Choose Ohio First scholarship program was created in 2007 to help strengthen Ohio's competitiveness within STEM (science, technology, engineering, and mathematics) fields. It does so by awarding funding to Ohio colleges and universities, which then provide competitive scholarships and work-based learning experiences to students who are seeking a certificate or associate, bachelor’s, or graduate degree in eligible STEM disciplines. Thanks in part to this program, the number of STEM degrees awarded at Ohio’s public colleges and universities has increased from over 26,000 total students in 2008 to more than 39,000 total students in 2023.
Given the outsized importance of teachers to Ohio’s future, state policymakers should consider adding one important caveat to the program: Students who receive a teacher scholarship must work in an Ohio school for at least five years once they’ve graduated. As the U.S. Department of Education does with TEACH Grant recipients, those who leave the classroom prior to meeting their obligation will have the teacher portion of their scholarship converted to loan. In Ohio, the converted loan could be prorated according to how many years the individual spent in the classroom. For example, a teacher who taught for three years before leaving the classroom would only be required to repay 40 percent of their scholarship amount.
To bolster Ohio’s teacher pipeline, state leaders and lawmakers need to develop a comprehensive package of incentives and initiatives. Establishing a teacher scholarship program is an important first step, as it could help encourage Ohio’s best and brightest students to pursue teaching careers. Moreover, it would send a clear message that policymakers are paying attention to the teacher pipeline—and that they’re willing to invest in it because they recognize the value of teachers.
[1] Homeschooled students who are within the top 5 percent of similar applicants are also eligible.
[2] The Ohio Department of Higher Education will provide each school with the number of students who are eligible for the scholarship based on the number of students who are enrolled and in the third year of the graduation cohort. Schools determine which students fall within the top 5 percent of their class.

Rarely do you see media coverage in Ohio about a public charter school embarking on an ambitious expansion. It’s not that the press is hostile to charters; it’s that such expansions don’t often occur in Ohio. That’s because Buckeye charters typically lack access to the resources that allow them to undertake large-scale capital projects. It’s also why recent news reports about Cornerstone Academy are worthy of note. The 1,000-student Westerville charter school managed to secure $30 million in bond financing via the Columbus-Franklin County Finance Authority for a significant facilities project.
This is terrific news for Cornerstone and its students. Yet those same articles illustrate a shortcoming in Ohio’s charter facility policies: lack of access to affordable financing for capital projects. Cornerstone will be paying 7 percent interest on the bond. While that seems normal in today’s high-rate environment, it’s still a lot to pay for debt service.
And it’s a lot more than traditional districts typically pay for capital projects. Dublin City Schools, for instance, recently secured $95 million in bond financing at 3.99 percent interest. Similarly, Bowling Green City Schools just obtained $73 million in financing at 4.08 percent.
It is true that charters, unlike districts, can close or be closed and they don’t have the power to tax, factors that may help to explain Cornerstone’s higher interest rate. But—just like districts—charters are public schools, held fully accountable for being fiscally responsible, as well as for their academic results. Charters also provide tens of thousands of Ohio families with additional public school options, and on average, they outperform their local school district.
To grow at scale, charter schools need access to more affordable financing. The high cost of debt servicing discourages many charters from undertaking capital projects in the first place, which often means they operate in less-than-optimal facilities. And when they do embark on substantial facilities improvements, the high interest rates they must pay tie up more of their budget with debt service and leave fewer dollars for classroom instruction. Given these challenges, it’s no surprise that only a handful of Ohio charters have ever accessed bond financing for capital projects.
Recognizing this problem and the disadvantage it poses to charter schools and their pupils, five states—Arizona, Colorado, Idaho, Texas, and Utah—have created “credit enhancement” programs. Ohio lawmakers should do that, too. But what exactly are these programs, how are they structured, and what savings do they actually deliver?
A recent report from the Local Initiatives Support Corporation (LISC) provides a useful guide. LISC describes such programs this way:
State bond credit enhancement programs represent one of the most effective and least costly options available to lower the cost of financing for charter school facilities. These programs significantly reduce taxpayer dollars spent on facility debt service by effectively substituting the state’s generally far superior credit rating for that of the charter school, resulting in a lower interest rate and reduced debt service payments.
LISC notes two basic approaches to providing enhanced credit:
Both routes effectively enhance the credit of charter schools, usually just a notch below a state’s own credit rating but higher than the rating a charter would receive on its own.[2] States, of course, do not actually pay the regular bond principal and interest—that remains the responsibility of the school. They only intervene if a school does not make a payment. This added layer of security reduces the risk to creditors and lowers charter schools’ interest rates.
To insulate the state from risk, states set aside an up-front amount to cover the possibility of default. In Colorado, for example, the legislature initially appropriated $1 million as a dedicated reserve fund, and over the years, it’s added another $6.5 million to it. Another $8.1 million has been contributed from participating charter schools, which pay a nominal fee to receive the enhanced credit, along with another $1 million from interest earnings. With no defaults—and thus no draws on the reserve—Colorado’s reserve fund stood at $16 million as of 2023.
In addition to maintaining a reserve, states also set minimum criteria that charters must achieve to receive enhanced credit. In Colorado and Utah, for instance, a charter must receive, prior to participating, a non-credit-enhanced investment grade rating to participate. This, too, minimizes the risk to the state—and as the table below indicates, no defaults have actually occurred in states with bond enhancement programs for charters.
According to the LISC analysis, credit-enhancement programs in other states have delivered huge savings to participating charter schools. In Colorado, for example, $1.1 billion in charter facilities financing has been credit-enhanced, saving schools $130 million in debt service expense. Texas’s credit enhancement program has produced some $770 million in savings for its charter schools. These savings have been accomplished, again, without any defaults on a credit-enhanced bond.
Table 1: Credit-enhanced bond financing for charter schools, and estimated cost-savings

* * *
The bottom line is that, by enacting supportive facility policies, other states have enabled quality charter schools to expand and thus to serve more families and students. In fact, some of the nation’s finest and fastest growing charter networks—e.g., Basis, Great Hearts, and IDEA—call these states home. Regrettably, Ohio still lags behind. Creating a strong credit enhancement program would go a long way toward enabling Ohio’s best charters to educate more students.
[1] Ohio does not appear to have a formal guarantee program for school district bonds, so it may be more challenging to go in this direction.
[2] The State of Ohio currently has the top credit rating possible.

The Metropolitan Council for Educational Opportunity (METCO) began in the mid-1960s as a direct result of school desegregation efforts in Boston. Originally christened “Operation Exodus,” 400 Black students from the Roxbury neighborhood whose families were fed up with foot-dragging from desegregation opponents enrolled themselves in mostly White schools with surplus capacity in surrounding suburbs. The entire history is worth reading, but the upshot is that the protest action eventually became a formal, structured voluntary interdistrict school choice program. Today, it serves 3,150 Boston students—nearly all of them Black or Hispanic—who attend 190 schools in thirty-three suburban districts. A January report from Tufts University researcher Elizabeth Setren examines the long-term impacts of METCO participation on student academic and behavioral outcomes.
METCO supplied application and award data for K–12 students between the 2002–03 and 2019–20 school years. Applicants were matched to Massachusetts Department of Elementary and Secondary Education’s administrative data for school enrollment, demographics, and K–12 outcomes (MCAS test scores, attendance, suspensions, etc.) through the 2022-23 school year. The National Student Clearinghouse provided college outcomes data, which include any matched applicants who were eighteen to twenty-two years old between 2002 and 2022. Earnings and unemployment data from the Massachusetts Department of Unemployment Assistance cover 2010 to 2023 and exclude individuals with federal and military jobs, those who are self-employed, and those in jobs located outside of Massachusetts. Additional applicant demographic data come from the Massachusetts Department of Vital Records. The sample includes approximately 20,000 students who applied to METCO and entered first grade in the state between 2002–03 and 2016–17.
Frustratingly, no specific number of accepted or non-accepted students is provided for either comparison group. However, Setren does give us lots of details on how she set up the comparisons between applicants who were offered a spot in a suburban school via lottery and those who were not. These include using a two-stage least squares analysis to estimate the effect of actual METCO participation (versus simply an intent-to-treat effect) and controls to adjust for the fact that some suburban schools pause acceptance in certain years which could limit the comparability of participant and non-participant cohorts in and after those pause years.
Almost 50 percent of Black students in Boston applied to METCO during the study period, and about 20 percent of Hispanic students did so, as well. The full sample of applicants is almost evenly split between boys and girls, but slightly more girls than boys ultimately participated. Setren tells us those with and without offers have similar neighborhood characteristics, health at birth, family structure, income status at birth, and parental education level. Most students apply in kindergarten or first grade, with a sharp fall-off after that, despite METCO applications being open to all grades. Just under 50 percent of those who receive K–1 offers remain in METCO schools until graduation.
Setren found substantial positive impacts for METCO participants almost across the board. By tenth grade, participants score 50 percent closer to the state average for math and two-thirds closer to the state average for ELA than their non-participant peers. Participating in METCO increases SAT taking by 30 percent and increases the likelihood of scoring 1000 or higher by 38 percent. Participation also significantly increases the likelihood students meet the state’s Competency Determination graduation requirement. However, students are not more likely to score above a 1200 on the SAT, and METCO participation showed no impact on AP exam taking or scores. Impact patterns are similar in all thirty-three suburban districts that accept Boston students.
As far as non-academic outcomes, the program lowers the likelihood students are suspended by about one-third for middle and high school grades and two-thirds for elementary grades. METCO participation increases attendance by two to four days a year (despite the farther travel distance to school every day), halves the high school dropout rate, and increases on-time high school graduation by 10 percentage points over non-participants. Long-term, attending suburban METCO schools increases four-year college enrollment by 17 percentage points, though it has no impact on enrollment in the most competitive colleges. METCO participation also results in a 6-percentage-point increase in four-year college graduation rates and leads to increased earnings and employment in Massachusetts between ages twenty-five and thirty-five.
Additionally, Setren finds no disruptive effect of having METCO participants in the grade cohort on suburban students’ MCAS test scores, attendance rates, or suspension rates. Having METCO peers does not change the proportion of a suburban student’s classmates that are suspended, regardless of the concentration of METCO students in a given grade or class. These findings are also consistent across all thirty-three suburban districts.
Do these findings indicate that suburban schools are clearly “better” than Boston Public Schools, and that METCO families are accessing “stronger” options outside the city? This and other research show that METCO students are doing far better than their peers who remain in Boston. But they do not appear, as a group, to be reaching the same performance levels as their suburban-resident classmates. Setren doesn’t look into the usual suspects like per-pupil spending, teacher pay, or teacher quality, but she does provide some interesting evidence off the beaten track. She notes that METCO participation moves students from schools where about half of graduates enroll in a four-year college to schools where about three-fourths pursue a four-year degree, and posits that this could be a key mechanism. It is likely that a strong college-going culture permeates these suburban districts—from solid literacy and numeracy foundations in elementary school, to systematic math pathways and strong extracurriculars in middle school, to ACT/SAT prep, transcript burnishing, and FAFSA support in high school. If one or more of these factors is missing or de-emphasized in a non-METCO student’s urban school, this could account for some of the outcome gaps observed.
Even more interestingly, positive outcomes for METCO students—including MCAS performance and college enrollment—occur even though they are more likely to be tracked into lower-performing classes than their non-METCO peers. It seems likely that high expectations for all students, including mastery of lower-level material before moving on to the next academic challenge, is also baked into the culture of these suburban schools. More research is needed to get to the bottom of this, particularly comparisons between METCO students and their suburban-resident classmates as well as the specific school factors that might be at play. But the fact remains that decades after the bold individual action that created METCO, Black and Hispanic parents in Boston are seeking out this systemic option in large numbers today—and students lucky enough to win the lottery are reaping quantifiable rewards.
SOURCE: Elizabeth Setren, “Impacts of the METCO Program,” The Metropolitan Council for Educational Opportunity, Massachusetts Department of Elementary and Secondary Education, and Tufts University (January 2024).

The Trends in International Mathematics and Science Study (TIMSS) and the Program for International Student Assessment (PISA) are arguably the most important international tests in education. Both have been administered for decades in dozens of countries. Each new set of student outcomes is tracked, analyzed, and endlessly written about. Because they are distinct assessments whose data often appear to provide contradictory messages about student academic health, most advocates and policymakers assume that TIMSS and PISA measure different types of educational inputs and outcomes. But a trio of researchers from Umeå University in Sweden recently pared down the two tests’ data to their most basic commonalities and analyzed the results to find some correspondence among the contradictions.
The researchers utilize data from the 2015 administration of both tests, which is the most recent year in which they coincided (TIMSS tests are given every four years, PISA every three years). Additionally, they had a tested topic in common that year. While TIMSS assesses the same subjects in every round (math and science), PISA varies one of its three subjects in each round (also including reading, financial literacy, and a number of other subjects), and most students are assessed in only two of the subjects in any given administration. Thus there isn’t much overlap in tested topics. However, both exams featured science questions in 2015, and this was synchronicity enough for the researchers. They further enhance the similarities by focusing on test takers in Sweden and Norway only, as the two countries’ education systems were felt to be similar enough to reduce noisy input variables.
TIMMS science results in 2015 came from 4,800 Swedish eighth graders and 4,100 Norwegian ninth graders; PISA science results arose from a nearly-even split of approximately 5,460 fifteen-year-olds in each country. Each testing round also includes a number of questionnaires (including surveys of parents, students, school leaders, and teachers), but these vary greatly between the two test types. School-level and student-level surveys were common between them and thus were the only ones analyzed for this report. The researchers whittled the survey data further down into a set of factors that could influence students’ academic performance. Home-related factors common to both tests/surveys include such things as number of books at home and the study resources available at home (desk, laptop, internet, etc.). School-related factors common to both tests/surveys include such things as staffing levels and homework help offerings.
Overall, the number of books reported in the home and an aggregate measure of school resources were the only common factors significantly positively related to science achievement on both tests in both countries. A mélange of test-specific and country-specific factors showed minimal levels of significance to student achievement (think rural versus urban schools or native versus immigrant parents) on their respective tests and students overall. However, breaking down the results by country, test, and school, various factors were found to be significant in limited contexts. For just two examples: Overall school staffing levels (including a measure of teacher quality) were positively and significantly associated with student performance in low-performing schools, but not significant in high-performing schools; and the “discipline of students” factor (think, school culture) was only a significant influence on Swedish students.
So does this smörgåsbord of data simply reinforce the initial idea that TIMSS and PISA are too different in their intent and construction to render any commonalities, even when served up on the same platter like this? The report’s authors say no: TIMSS and PISA assessments provide “partially complementary information.” The common thread is that school- and home-related inputs are correlated with boosts to (or hindering, if missing) student outcomes, even if the determinations of what inputs matter, how important they are, and when they exert influence are, as yet, unclear. Further research, they conclude, should work to more clearly define these input factors—what, for example, is “having books in the home” a proxy for—and examine their impacts on specific academic outcomes with additional clarity and detail.
SOURCE: Inga Laukaityte, Ewa Rolfsman, and Marie Wiberg, “TIMSS vs. PISA: what can they tell us about student success?—a comparison of Swedish and Norwegian TIMSS and PISA 2015 results with a focus on school factors,” Frontiers in Education (February 2024).

By Aaron Churchill
Does expanding educational options harm traditional school districts? This question—a central one in the school choice debate—has been studied numerous times in various locales. Time and again, researchers have returned with a “no.” Choice programs do no harm to school districts, and in many instances even lead to improvements through what economists call “competitive effects.” Brian Gill of Mathematica Policy Research, for instance, reports that ten out of eleven rigorous studies on public charter schools’ effects on district performance find neutral to positive outcomes. Dozens of studies on private schools’ impacts on districts (including ones from Ohio) find similar results.
This research brief by the Fordham Institute’s Senior Research Fellow, Stéphane Lavertu, adds to the evidence showing that expanding choice options doesn’t hurt school districts. Here, Dr. Lavertu studies the rapid expansion of Ohio’s public charter schools in some (largely urban) districts during the early 2000s. He discovers that the escalating competition in these locales nudged districts’ graduation and attendance rates slightly upward, while having no discernable impacts on their state exam results.
Considered in conjunction with research showing that Ohio’s brick-and-mortar charters outperform nearby districts, we can now safely conclude that charters strengthen the state’s overall educational system. Charters directly benefit tens of thousands of students, provide additional school options to parents, and serve as laboratories for innovation—all at no expense to students who remain in the traditional public school system.
It’s time that we finally put to rest the tired canard that school choice hurts traditional public schools. Instead, let us get on with the work of expanding quality educational options, so that every Ohio family has the opportunity to select a school that meets their children’s individual needs.
Compelling evidence continues to show that the emergence of charter schools has had a positive impact on public schooling. Recently, professors Feng Chen and Douglas Harris published a study in a prestigious economics journal that found that students attending public schools—both traditional and charter public schools—experienced improvements in their test scores and graduation rates as charter school attendance increased in their districts.[1] Based on further analysis, the authors conclude that the primary driver was academic improvement among students who attended charter schools (what we call “participatory effects”) though there were some benefits for students who remained in traditional public schools (due to charter schools’ “competitive effects”).
These nationwide results are consistent with what we know from state- and city-specific studies: Charter schools, on average, lead to improved academic outcomes among students who attend them and minimally benefit (but generally do not harm) students who remain in traditional public schools. The estimated participatory effects are also consistent with what we know about Ohio’s brick-and-mortar charter schools, which, on average, have increased the test scores and attendance rates of students who attend them.
Feng and Harris’s study provides some state-specific estimates of charter schools’ total impact (combined participatory and competitive effects) in supplementary materials available online, but those appendices report statistically insignificant estimates of the total effects of Ohio charter schools. How could there be no significant total effect, given what we know about the benefits of attending charter schools in Ohio? One possibility is that their data and methods have limitations that might preclude detecting effects in specific states. Another possibility, however, is that their null findings for Ohio are accurate and that charter schools’ impacts on district students are sufficiently negative that they offset the academic benefits for charter students.[2]
To set the record straight, we need to determine Ohio charter schools’ competitive effects—that is, their impact on students who remain in district schools. The novel analysis below—which addresses several limitations of Feng and Harris’s analysis[3]—indicates that although the initial emergence of charter schools had no clear competitive effects in terms of districtwide student achievement, there appear to have been positive impacts on Ohio districts’ graduation and attendance rates. Combined with what we know about Ohio charter schools’ positive participatory effects, the results of this analysis imply that the total impact of Ohio’s charter schools on Ohio public school students (those in both district and charter schools) has been positive.
There are limitations to this analysis. For methodological reasons, it focuses on the initial, rapid expansion of charter schools between 1998 and 2007. And although it employs a relatively rigorous design, how conclusively the estimated effects may be characterized as “causal” is debatable. But the research design is solid and, considered alongside strong evidence of the positive contemporary impacts of attending Ohio’s brick-and-mortar charter schools, it suggests that Ohio’s charter sector has had an overall positive impact on public schooling. Thus, the evidence indicates Ohio’s charter-school experience indeed tracks closely with the positive national picture painted by Chen and Harris’s reputable study.
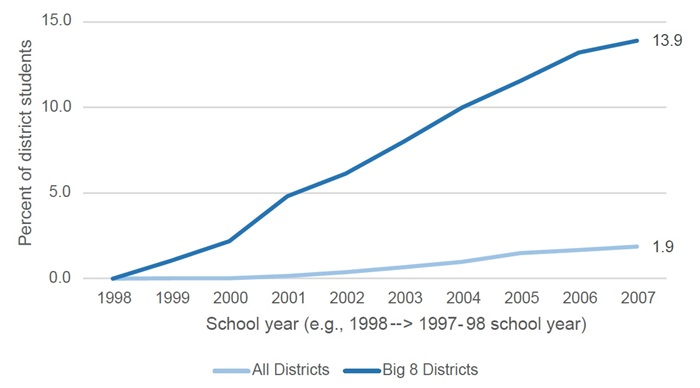
A first step in estimating competitive effects is obtaining a good measure of charter school market share that captures significant differences between districts in terms of charter school growth.[4] Figure 1 illustrates the initially steep increase in the share of public school students in the average “Ohio 8” urban district[5] (from no charter school enrollment during the 1997–98 school year to nearly 14 percent enrollment during the 2006–07 school year) as well as the much more modest increase in the average Ohio district (nearly 2 percent of enrollment by 2006–07).[6] The rapid initial increase in some districts (like the Ohio 8) but not others provides a pronounced “treatment” of charter school competition that may be sufficiently strong to detect academic effects using district-level data.
Figure 1. Charter market share in Ohio districts
Focusing on the initial introduction of charter schools between 1998 and 2007 provides significant advantages. To detect competitive effects, one must observe a sufficient number of years of district outcomes so that those effects have time to set in. It can take time for districts to respond to market pressure, and there may be delays in observing changes in longer-term outcomes, such as graduation rates. On the other hand, it is important to isolate the impact of charter schools from those of other interventions (notably, No Child Left Behind, which led to sanctions that affected districts after the 2003–04 school year) and other events that affected schooling (notably, the EdChoice scholarship program and the Great Recession after 2007). Because these other factors may have disproportionately affected districts that were more likely to experience charter school growth, it is easy to misattribute their impact to charter competition. To address these concerns, the analysis focuses primarily on estimating the impact of the initial growth in charter enrollments on district outcomes three and four years later (e.g., the impact of increasing market share between 1998–2003 on outcomes from 2001–2007).
After creating a measure that captures significant differences between districts in initial charter school growth, the next step is to find academic outcome data over this timespan. Ohio’s primary measure of student achievement for the last two decades has been the performance index, which aggregates student achievement levels across various tests, subjects, and grades. It is a noisy measure, but it goes back to the 2000–01 school year and, thus, enables me to leverage the substantial 1998–2007 increase in charter school market share. In addition to performance index scores, I use graduation and attendance rates that appeared on Ohio report cards from 2002 to 2008 (which reflect graduation rates from 2000–01 to 2006–07 and include attendance rates from 2000–01 to 2006-07).[7]
Using these measures, I estimate statistical models that predict the graduation, attendance, and achievement of district students in a given year (from 2000–01 to 2006–07) based on historical changes in the charter school market share in that same district (from 1997–98 to 2006–07), and I compare these changes between districts that experienced different levels of charter school growth. Roughly, the analysis compares districts that were on similar academic trajectories from 2001 to 2007 but that experienced different levels of charter entry in prior years. A major benefit of this approach is that it essentially controls for baseline differences in achievement, attendance, and graduation rates between districts, as well as statewide trends in these outcomes over time. And, again, because impact estimates are linked to charter enrollments three and four years (or more) prior to the year in which we observe the academic outcomes, the results are driven by charter-school growth between 1998 and 2003—prior to the implementation of No Child Left Behind and EdChoice, and prior to the onset of the Great Recession.
Finally, I conducted statistical tests to assess whether the models are in fact comparing districts that were on similar trajectories but that experienced different levels of charter entry. First, I conducted “placebo tests” by estimating the relationship between future charter market shares and current achievement, attendance, and graduation levels in a district. Basically, if future market shares predict current academic outcomes, then the statistical models are not comparing districts that were on similar academic trajectories and thus cannot provide valid estimates of charter market share’s causal impact. I also tested the robustness of the findings to alternative graduation rate measures and the inclusion of various controls that capture potential confounders, such as changes in the demographic composition of students who remained in districts. The results remain qualitatively similar, providing additional support for the causal interpretation of the estimated competitive effects.[8]
Finding No. 1: A 1-percentage-point increase in charter school market share led to an increase in district graduation rates of 0.8 percentage points four years later. That implies that districts with a 10 percent charter market share had graduation rates 8 percentage points higher than they would have had in the absence of charter school competition.
I begin with the analysis of graduation rates. Figure 2 (below) plots the estimated impact of increasing charter market share by one percentage point on district-level graduation rates. Roughly, the thick blue line captures differences in achievement between districts that experienced a one percentage point increase in charter market share to those that did not experience an increase. Year 0 is the year of the market share increase, and the blue line to the right of 0 captures the estimated impact of an increased market share one, two, three, four, and five (or more) years later. The dotted lines are 95 percent confidence intervals, indicating that this interval would contain the estimate 95 percent of the time if the statistical test were repeated.
The results indicate that an increased charter market share had no impact on district graduation rates in the first couple of years. However, an increase in charter market share of 1 percentage point led to district graduation rates that, four years later, were 0.8 of a percentage point higher than they would have been in the absence of charter competition. Thus, if the average district had a charter market share of 10 percent in 2003, the results imply that they would have realized graduation rates that are 8 percentage points higher in 2007 (i.e., 0.8 x 10 four years later). For a typical Ohio 8 district that experienced a 14 percent increase in charter market share, that was the equivalent of going from a graduation rate of 57 percent to a graduation rate of 68 percent.
Figure 2. Impact of charter market share on districts’ graduation rates (2001–2007)
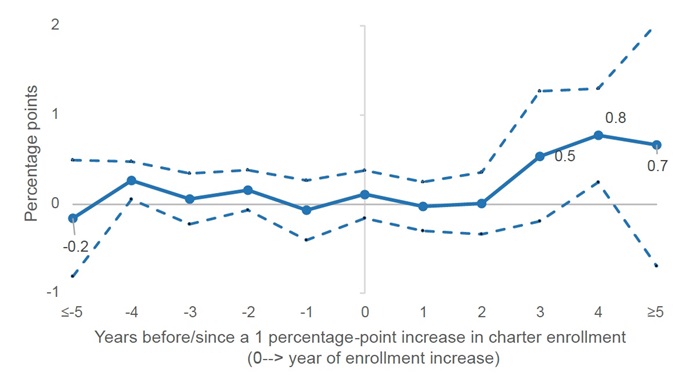
Importantly, as the estimates to the left of the y axis reveal, there are no statistically significant differences in graduation rates between districts that would go on to experience a 1-percentage-point increase in market share (in year 0) and those that would not go on to experience that increase. This is true one, two, three, four, and five (or more) years prior. Controlling for changes in districts’ student composition (e.g., free-lunch eligibility, race/ethnicity, disability status, and achievement levels) does not affect the results. Finally, although the estimates in Figure 1 are statistically imprecise (the confidence intervals are large), the Year 4 estimate is very close in magnitude to the statistically significant estimate (p<0.001) based on a more parsimonious specification that pools across years (see appendix Table B1). These results suggest that competition indeed had a positive impact on district students’ probability of graduation.
One potential limitation of this study is that the market share measure includes students enrolled in charter schools that are dedicated to dropout prevention and recovery. If students who were likely to drop out left district schools to attend these charter schools, then there would be a mechanical relationship between charter market share and district graduation rates. This dynamic should have a minimal impact on these graduation results, however. First, in order to explain the estimated effects that show up three and four years after charter market shares increase, districts would have needed to send students to dropout-recovery schools while they were in eighth or ninth grade (they couldn’t be in grades ten to twelve, as the dropout effects show up in Year 4); and these students needed to be ones who would go on to drop out in eleventh or twelfth grade (as opposed to grade nine or ten). That is a narrow set of potential students. Second, for this dynamic to explain the results (where a one-percentage-point increase in charter market share leads to an 0.8-percentage-point decrease in dropouts), then a large majority of the market share increase that districts experienced would need to be due to these students who would eventually drop out. Given the small proportion of charter students in dropout-recovery schools and the even smaller proportion of those who meet the required profile I just described, it seems that shipping students to charters focused on dropout prevention and recovery can be only a small part of the explanation.
Finding No. 2: A 1-percentage-point increase in charter school market share led to an increase in district attendance rates of 0.08 percentage points three years later. That implies that districts with a 10 percent charter market share had attendance rates 0.8 of a percentage point higher than they would have had in the absence of charter school competition.
The results for district attendance rates are also imprecise, with unstable point estimates and large confidence intervals in Years 4 and 5 (or later). But Figure 3 indicates a statistically significant effect in Year 3 of 0.08 percentage points, and this Year-3 estimate is very close in magnitude to the statistically significant estimate (p<0.01) based on a more parsimonious specification that pools across years (see appendix Table B1). For the typical Ohio 8 district, the estimated effect is the equivalent of their attendance rate going from 90.5 percent to 91.6 percent.
Figure 3. Impact of charter market share on districts’ attendance rates (2001–2007)
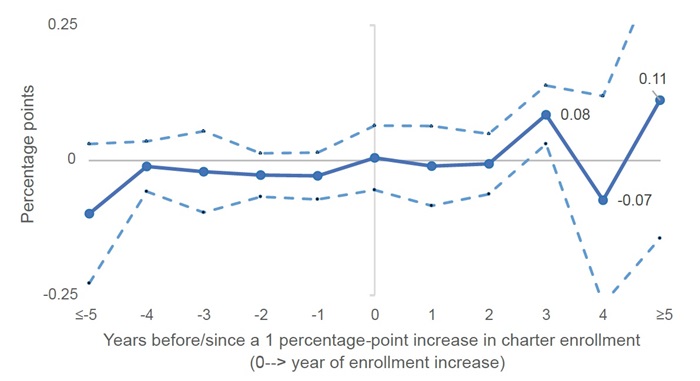
Thus, as was the case with graduation rates, these by-year estimates are imprecise, but they confirm more precise estimates from models that pool across years, provide evidence that there is a plausible time lag between increases in market share and increases in attendance rates, and provide some confidence that the results are not attributable to pre-existing differences between districts that experienced greater (as opposed to lesser) increases in charter competition. That the timing of attendance effects roughly corresponds to increases in graduation rates provides further support that the results don’t merely capture statistical noise.
Finding No. 3: An increase in charter school market share did not lead to a statistically significant change in districts’ scores on the performance index.
The results for districtwide student achievement indicate no statistically significant effects (see Figure 4, below). Unfortunately, we lack the statistical power to rule out effects that one might deem worthy of attention. Additionally, the immediate (statistically insignificant) decline in the performance index in the year of the market share increase (Year 0) might be attributable to relatively high-achieving students leaving for charter schools and thus might not capture changes in student learning. If high-achieving students were more likely to go to charter schools, then districts’ performance index scores should decline in exactly the year that charter market shares increased.[9]
Figure 4. Impact of charter market share on districts’ scores on the performance index (2001–2007)
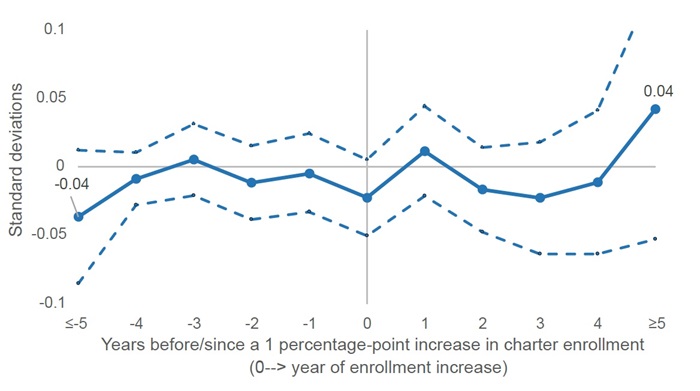
The results of a simple model that pools across years indicates a negative relationship between charter market share and district performance index scores (see Table B1 in the appendix). The results in Figure 4, however, put into question this negative correlation between charter market share and district performance index scores. Controlling for future market share (as does the model used to generate Figure 4) renders statistically insignificant the estimates from Year 1 to Year 4. That the coefficient for five years (or more) prior is -0.04 and nearly statistically significant suggests that the relationship in Table B1 between market share and the performance index may be attributable to the fact that districts experiencing declines in achievement were more likely to subsequently experience charter school growth, as opposed to the other way around.[10] The estimate from the simple performance-index model that pools across years is also the only one that is not robust to limiting the analysis to pre-NCLB years (see Table B1 in the appendix).
Despite the somewhat imprecise (and perhaps invalid) statistical estimates of the impact of charter market share on districts’ performance index scores, what one can say is that the analysis rules out large declines in the achievement levels of district students. Additionally, these results are similar to those of a 2009 RAND study that found no statistically significant differences in student-level test score growth among students who attended a traditional public school that had a charter school in close proximity, as compared to students whose traditional public schools were farther from the nearest charter school. That study did not leverage the initial growth in the charter school sector, but it provides a different type of evidence and relatively precise estimates.
Thus, in spite of the potential limitations related to changes in student composition and imprecise (and perhaps invalid) statistical estimates, the results of this analysis provide one more piece of evidence that charter school competition did not have negative effects on student learning in district schools.
The introduction of charter schools in Ohio significantly disrupted school district operations. For example, in 2002, EdWeek documented Dayton Public Schools’s newfound dedication to academic improvement in response to its rapidly expanding charter sector. As Chester E. Finn, Jr. discussed in a post that same year, the district considered a number of reforms—notably the closure of under-enrolled and under-performing schools, which Feng and Harris’s recent study identified as the most likely mechanism explaining the positive impact of charter school competition on districtwide academic outcomes. The results above suggest that, for the average Ohio district experiencing charter school growth, these efforts did not yield large positive impacts on student achievement (though they very well may have in Dayton[11]), nor any discernable negative impacts.
On the other hand, the average Ohio district’s response to charter school competition led to increases in attendance and graduation rates. The more charter competition a district felt, the less likely their students were to miss school or drop out three or four years later. That charter school competition appears to have spurred improvements in Ohio school districts between 2001 and 2007 is particularly remarkable given how maligned Ohio’s charter sector was in those days. Charter schools were not nearly as effective in those early years as they are today (though the best evidence for that time period indicates that brick-and-mortar charter schools were no worse, on average, than district schools). Why that may have occurred is a topic for another day, but one wonders whether keeping students in school (and, thus, keeping the state funds that follow them) became more important to districts as they began to face competition. For now, though, the analysis above provides some further reassurance that it is worthwhile to draw attention to districts with solid charter market shares as an indicator of healthy school marketplaces.
Stéphane Lavertu is a Senior Research Fellow at the Thomas B. Fordham Institute and Professor in the John Glenn College of Public Affairs at The Ohio State University. Any opinions or recommendations are his and do not necessarily represent policy positions or views of the Thomas B. Fordham Institute, the John Glenn College of Public Affairs, or The Ohio State University. He wishes to thank Vlad Kogan for his thoughtful critique and suggestions, as well as Chad Aldis, Aaron Churchill, and Mike Petrilli for their careful reading and helpful feedback on all aspects of the brief. The ultimate product is entirely his responsibility, and any limitations may very well be due to his failure to address feedback.
[1] An open-access version of the paper is available here, and an accessible summary of an earlier version of the paper is available here. These results are consistent with those of a prior Fordham study.
[2] Note that their analysis leaves out students in virtual charter schools and those serving special-education students, which suggests that the participant effects should be positive.
[3] The primary limitation of Chen and Harris’s analysis relates to their data. Their study measures important quantities with significant error (e.g., charter market share and graduation rates), does not exploit pronounced differences in charter school growth between districts (e.g., their achievement data begins in 2009, well after the initial and steep charter school growth I examine in my analysis), and focuses on years after the implementation of No Child Left Behind and the onset of the Great Recession (both of which disproportionately affected districts with growing charter sectors). These limitations likely make it difficult to detect effects in specific states, particularly states like Ohio, where the measurement error and lack of market-share variation is significant. I am not criticizing the quality of their valuable nationwide analysis. The data they use are the only option for conducting a rigorous nationwide analysis, as they need measures that are available across states. But when estimating Ohio-specific estimates of charter school effects, these limitations might preclude detecting effects because the signal-to-noise ratio is too low. I provide further details in the appendix.
[4] I thank Jason Cook for kindly sharing these data with me, which he collected for this study of charter competition’s impact on district revenues and expenditures. Note that Cook’s study estimates charter enrollment effects in the post-NCLB period, which may introduce some complications that my study seeks to avoid.
[5] The Ohio 8 districts are Akron, Canton, Cincinnati, Cleveland, Columbus, Dayton, Toledo, and Youngstown.
[6] Average market share increases more slowly and unevenly after 2007, as charter closures became more prevalent in districts with more mature charter sectors. Thus, although average enrollments continued to increase statewide through 2014, there is not a clean upward trajectory in charter market share in every district.
[7] These graduation rates are not as good as the cohort-based graduation rates introduced in later years, but they cover the same time span as the performance index and are based on calculations that account for actual enrollments and dropouts in every high school grade.
[8] Specifically, I estimated two-way fixed-effects panel models with lags and leads of district market share as predictor variables and 2001–2007 achievement, attendance, and graduation rate data as the dependent variables. Scholars have recently identified potential problems with these models, and there are concerns about the extent to which they capture “difference in differences” comparisons that warrant a causal interpretation, which is why I sometimes use qualifiers such as “roughly” when describing what the estimates of my analysis capture. The basic model includes district and year fixed effects, but the results are qualitatively similar when I control for time-varying demographics (e.g., student free-lunch eligibility, race/ethnicity, and disability status). These robustness checks, in conjunction with the use of leads that allow for placebo tests and control for potential differences in district trends, provide reassurance that the estimates are credible. The appendix contains a more precise description of the statistical modeling and results.
[9] Note that there is no estimated change in Year 0 for the attendance and graduation analyses, and if students more likely to attend school and graduate were the ones who switched to charters, that should have led to lower district attendance and graduation rates.
[10] Indeed, this potential explanation is consistent with the design of the charter school law, which in later years permitted the establishment of charter schools in districts that failed to reach performance designations (which were based in large part on the performance index).
[11] Unfortunately, Dayton is one of the handful of districts for which I am missing initial years of data, which means its 2002 efforts—in response to enrollment losses in the preceding two years—do not factor into the estimates above. Additionally, the statistical analysis cannot speak to the effects in a specific district.